the distribution of extreme execution times that are very hard to measure and potentially impossible to observe. To measure execution times with very low ...
On the Reliability of the Probabilistic Worst-Case Execution Time Estimates Fabrice Guet, Luca Santinelli, and Jérôme Morio ONERA - The French Aerospace Lab, Toulouse France {fabrice.guet|luca.santinelli|jerome.morio}@onera.fr
1.
INTRODUCTION
The execution of software tasks within real-time systems needs to be analysed with respect to both functional and nonfunctional constraints. In particular, real-time systems require strict timing evaluations of the tasks execution behavior, especially their Worst-Case Execution Time (WCET). Safety-critical embedded systems exhibit execution time variability, although classical real-time modeling and analyses account only for the worst-case. The systemic complexity of realtime systems comes from the hardware complexity (e.g., current multi-core architectures, shared resources such as memory, and speculative mechanisms like cache memories and pipelines [13, 23]), the software complexity (e.g., multiple embedded functionalities, wide interoperability, co-existence of functional and non-functional constraints), complex system component interactions and dependences, and diverse environments. All of them participate to the variability in the temporal behavior of the tasks. Regarding this systemic complexity, probabilistic approaches are emerging as effective alternative to deterministic approaches for WCETs estimate. Their objective is to characterize system execution variabilities with probability distributions that associate to multiple possible WCETs their probability of occurence within a system execution trace, on contrary to deterministic approaches that provide a single WCET estimate. The challenge is to ensure the predictability based on the probabilities. So far, the probabilistic approaches are less costly in modeling task execution behavior and more accuracy with regard real-time systems average performances compared to the deterministic approaches. This paper focuses on Measurement-Based approaches for Timing Analyses (MBPTA). MBPTA relies on both execution time measurements and the application of the Extreme Value Theory (EVT). Thus an exact model of both hardware and software is not required, contrary to deterministic approaches, as the measurement of the actual system behavior is sufficient. The MBPTA provides probabilistic Worst-Case Execution Time (pWCET) estimates1 [6, 18]. Currently, the main problem of the MBPTA is the lack of mathematical robustness since EVT actual application relies on non systematic statistical approaches. Hardware systemic effects in real-time systems [33] make EVT applicability difficult with regard to its required theoretical hypotheses. It is necessary then to ensure the applicability of the EVT to realistic embedded systems (non timerandomized embedded systems). Moreover, real-time systems require strong guarantees on the pWCET estimates thus, diag1
pWCETs are alternative to deterministic Worst-Case Execution Times as distributions with multiple extreme execution times, each with a probability of happening.
nostic tests have to be introduced to check hypotheses for generalizing the EVT applicability to any embedded systems [37]. In this paper we propose the logical workflow that checks the applicability of the EVT for the pWCET estimation problem. The proposed framework is a DIAGnostic tool for the eXTReMe value theory, named diagXtrm. The tool applies tests and makes a decision on the reliability of the resulting pWCET estimate without human intervention. The objective is to establish a systematic and reproducible process for estimating the pWCET which is able to cope with both performance and safety of existing as well as future real-time systems. Organization of the paper. In Section 2 we relate the WCET problem, especially for the MBPTA, by depicting existing approaches and stressing the novelty of the proposed framework. In Section 3, we set the basics of the real-time probabilistic modeling and focus on the theoretical aspects of the EVT applicability. Section 4 presents the main steps of the diagXtrm tool, and Section 5 develops the tests that compose the tool. In Section 6 diagXtrm is applied to a realistic hardware platform running a set of tasks. Section 7 is for conclusions and future work.
2.
RELATED WORK
Estimating the WCET of a task for hard real-time systems has been addressed in many ways [40]; all differ depending on the kind of hardware architecture. Platforms are said to be deterministic whenever the execution time of a task is the same for the same input data. They are said to be non deterministic instead, whenever the execution time varies for the same input data. The non determinism comes from hardware components like cache memories, pipelines, etc. [35]. Static deterministic timing analysis and measurement-based deterministic timing analysis are effective for deterministic platforms. Static approaches provide safe WCET estimates as they are proved to be the worst. They rely either on an exact modeling of the system and a complete exploration of all its state or on a simplified version where some conditions are respected or even enforced. Measurement-based approaches provide timing behavior upper-bounds as distributions that overcome most of the possibilities. That is the reason why static approaches are preferred on measurement-based ones to give high guarantees on the system constraints. Nevertheless, when it comes to non deterministic architectures, static approaches produce pessimistic WCET estimates due to the overall systemic complexity; the analytical modeling phase is more and more difficult, the models confidence decreases, and the resulting estimates deteriorate [7]. However, tools based on the static modeling of both hardware and software aspects
are able to provide safe but pessimistic WCET estimates because they take into account the worst-case at every modeling step. The estimates could be far from actual measurements and hardware performances. The non determinism resulting from enhanced performance and the consequent execution time variability question the deterministic approaches. Facing this new challenge, probabilistic approaches tend to emerge: they can be either Staticbased [18, 9] or Measurement-Based Timing Analyses (MBPTA). diagXtrm is a MBPTA approach and is able to capture well the systemic effects together with the coherence mechanisms between shared resources. As it relies on endto-end measurements of the task execution time, it does not require a huge amount of information or exact hardware nor software models. The probabilistic worst-case profiles are derived on the basis of the set of execution time measurements. Nevertheless, as MBPTA relies on measurements, the lack of completeness of experimental conditions can lead to unsafe pWCET estimates due to unobserved execution conditions.
2.1
MBPTA approaches
3.
Probability Theoretical distribution
Safety Set of mea- Pessimism surements
Minimal measurement
Within the PROARTIS project first and then the PROXIMA project [1, 2], the EVT is applied to artificial (ad-hoc) random systems (Random Replacement policies in cache memories),[4, 15, 17]; 2) the elaboration of a methodology for guaranteeing the applicability of the EVT from the strong fundamentals of its mathematical hypotheses [5, 8, 31, 37] and derive reliable pWCET estimates from any real-time system (timerandomized as well as non time-randomized). The approach proposed in the diagXtrm tool is a MBPTA approach and aims at solving the problem of the EVT applicability for real-time systems (both time-randomized and non time-randomized systems) by pursuing the works in [19, 25, 33, 37]. It represents the first structured and formal approach designed as a logical workflow that evaluates the EVT hypotheses for guaranteeing the MBPTA estimates. diagXtrm applies tests proved to be efficient for the considered analyses and an automatic parameter estimate process to provide pWCET estimates with an associated confidence for the EVT hypotheses.
Execution time Upper Maximal c measure- WCET timing bound ment
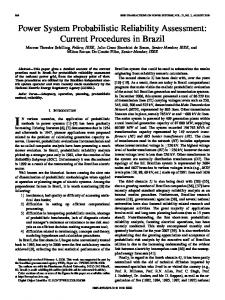
Figure 1: Overview of the WCET problem. Example of a timing probabilistic profile of a task. The objective of MBPTA approaches is to derive probabilistic profiling of the timing behavior of a task, like in Figure 1, through a statistical modeling. Such a profile has to tend to the true theoretical distribution of execution times. In particular, MBPTA approaches are interested in modeling extreme execution times, for characterizing the worst-case, i.e. the values far from the average execution times, and potentially not measured. The probabilistic theory that focuses on extreme values and large deviations from the average values is the Extreme Value Theory (EVT) [20]. The EVT is a probabilistic paradigm that aims at predicting the improbable, i.e. it enables to derive the probability of rare events without requiring too many simulations. The EVT for estimating the WCET of a task in a scheduling analysis is first used in [19] where the Gumbel distribution is applied for modeling the distribution of execution times. A first algorithm for applying the EVT appeared in [25]. It extracts values from a sequence of execution time measurements according to the block maxima paradigm2 and fits a Gumbel distribution to the measurements. Then the fitted distribution is compared to the measurements through a χ2 -test to confirm the model, otherwise the process is applied again for another number of extracted values. The EVT applicability for embedded systems is first questioned in [33] and in particular about the statistical independence and the continuity of the execution time measurements. Two directions emerged from those questions: 1) the randomization of the hardware for solving the independence problem. 2 The sequence is divided into blocks of same size and only the maximum value of each block is retained.
PROBABILISTIC MODELING
The EVT relies on measurements of the system performance parameters, here the execution time of a task τ , for estimating extreme behaviors, where the worst-case should lie. The variability of the execution time of a task motivates its definition as a random variable3 , denoted by C, which picks different possible values within the set4 Ω ⊆ N, i.e. the distribution support of execution times the task τ can take to complete with a certain probability. The definition of a random variable stands for the uncertainty that lies on the uncertain systemic effects that occur in real-time systems. Each measurement Ci at discrete time instant i, is stored in a trace T such that ∀i, T (i) = Ci . The length of T is denoted by n. Three equivalent representations are used for C, each is a probability distribution function: for all possible execution time c ∈ Ω, it exists i) the cumulative distribution function (CDF) FC (c) = P (C ≤ c), ii) the complementary cumulative distribution function function (CCDF) F C (c) = P (C > c) = 1−FC (c), and iii) the probability mass function fC (c) = P (C = d c) (for a continuous random variable it is fC (c) = dc FC (c)). The discrete random variable C, based on the execution time measurements is said to be the Execution Time Profile5 (ETP) of the task τ . One key element about the pWCET relates to its theoretical existence: the pWCET exists but cannot be observed since it is the distribution of extreme execution times that are very hard to measure and potentially impossible to observe. To measure execution times with very low probability (e.g., 10−9 ), it would require a large amount of simulations and well defined experimental conditions. Moreover, the worst-case conditions have to be guaranteed to be explored making such approach very costly in terms of time and exploration conditions. The lack of completeness of the experimental conditions cannot ensure the existence of pWCET estimates directly from ETPs. 3 A random variable is a variable whose value is subject to variations due to chance, i.e. randomness, in a mathematical sense. Generalizing, also non-variable execution time could be represented as random variables, with only one value and the probability of happening equal to 1. Since execution times are from measurements, they results into empirical random variables. 4 Execution time can assume only discrete values as multiple of the system clock. 5 ETPs are discrete distributions since task execution times can only be a multiple of the system clock.
Probability
where c0 is the potential WCET of τ . GP Dξ the Generalized Pareto Distribution with the same shape parameter ξ as Hξ , and F u from Equation (1).
Safety Pessimism fC ∗
f λ C WCET
c Probabilistic upper timing bound
Figure 2: The pWCET estimate problem with the relationship between exact pWCET and pWCET estimate. An example of safe estimate C λ with respect to the exact C ∗ .
For formally defining the exact pWCET, we introduce the partial ordering of random variables by comparing their CCDF. Thus a random variable Ci is greater than or equal to a Cj , Ci � Cj , iff P (Ci > c) ≥ P (Cj > c), for every c ∈ ΩCi ∩ ΩCj . Thus, the exact pWCET is the least upper random variable over all the ETPs for every execution condition. We denote the exact pWCET of a task by the random variable C ∗ . Since exact pWCETs are impossible to obtain, as for any timing analysis approaches, we focus on pWCET estimates C λ . A pWCET estimate C λ has to be safe i.e. has to be greater than C ∗ , so C λ � C ∗ like in Figure 2. The statistical modeling method from the EVT is the process we apply to achieve C λ .
3.1
Reliable pWCET estimates
The EVT is a widely used theory for predicting the improbable, i.e. giving probabilities of occurrence to extreme behaviors. Under the hypothesis of independent and identically distributed (iid) execution time measurements C1 , . . . , Cn from an average discrete cumulative distribution function FC . The EVT ensures that the limit law of the maxima, i.e. the extreme execution times, denoted by Mn = max (C1 , . . . , Cn ) is a Generalized Extreme Value Distribution (GEV) Hξ under norming constants such as the shape parameter ξ ∈ R, the mean µ ∈ R > 0 and the variance σ 2 ∈ R > 0 of the extreme execution times, with the Fisher-Tippett-Gnedenko theorem [20, 24]. This result implies that FC belongs to the Maximum Domain of Attraction of the GEV Hξ , denoted by FC ∈ M DA(Hξ ). Given C, whenever the iid hypothesis is respected and under good norming constants, the GEV is an appropriate distribution for the extreme execution times. Depending on the value of ξ, the GEV can be either the Frechet (ξ > 0), the Gumbel (ξ = 0), or the Weibull (ξ < 0) distribution. In previous works the pWCET distribution has been assumed to be Gumbel, while here no assumption is made about the resulting GEV distribution and so there is no restriction on the values that ξ can take. The objective of the study is to get reliable pWCET estimates so that the distribution has to best-fit the measurements: the Gumbel can result from the best-fit or it can be imposed afterwards. Considering C and FC , the CDF of the peaks C − u above the threshold u knowing C > u is F u (c) = P {C ≤ u + c | C > u} = 1 −
1 − FC (u + c) . 1 − FC (u)
(1)
If FC ∈ M DA(Hξ ) then the limit law of the peaks is given by the Pickands theorem [36]: Theorem 3.1
(Pickands theorem). FC ∈ M DA(Hξ )
iff lim
sup
u→c0 0≤c≤c −u 0
|F u (c) − GP Dξ (c)| = 0,
(2)
The Pickands Theorem states that for values above a threshold, the nearest the threshold is to the actual WCET (which is the task execution time right end-point for increasing values) the more the distribution of execution times tends to a Generalized Pareto Distribution. Definition 3.2 (Generalized Pareto Distribution). The distribution function GP Dξ is the Generalized Pareto Distribution (GPD) defined as: � 1 − (1 + ξ × (c − u)/αu )−1/ξ if ξ 6= 0 GP Dξ (c) = 1 − exp(−(c − u)/αu ) if ξ = 0, (3) with αu = µ−ξ(u−σ 2 ), and defined on {c, 1+ξ(c−u)/αu > 0}. This fixes the basis of the EVT POT approach which consists in extracting the execution time measurements from T above a threshold u and fitting the experimental CDF with the continuous distribution function Pξ . By applying the POT approach to the trace of execution times, the pWCET estimate which is the distribution of extreme execution times C λ is a GPD. For applying the EVT, one needs i) independent and ii) identically distributed execution time measurements from iii) a distribution in the Maximum Domain of Attraction of a GEV of shape parameter ξ. Those three elements are the hypotheses to check for having reliable pWCET estimates. In practice, the independence hypothesis is difficult to assume because of history dependence in memory components as explained in Section 2.1. Moreover, the true distribution of the execution times is unknown and prevents from proving that execution times are identically distributed from a distribution in the Maximum Domain of Attraction of a GEV. Further researches in the EVT domain proved the convergence of the Fisher-Tippett-Gnedenko theorem for stationary execution time measurements under two conditions [29, 30], and so the applicability of the EVT in the more general stationary case. The conditions especially relax the strict independence of the measurements and it is not necessary to know precisely the probabilistic law of the execution times as soon as they are stationary. The strict hypotheses that prevented EVT applicability to non time-randomized embedded systems (todays systems), notably the independence, are so released allowing to apply the EVT to the pWCET estimate problem for any real-time system (both time-randomized and non time-randomized).
4.
A DIAGNOSTIC TOOL FOR ESTIMATING THE PWCET WITH THE EXTREME VALUE THEORY
The main challenge of the MBPTA is the definition of a systematic approach that provides reliable pWCET estimates with the EVT. The reliability of a process comes from its definition: it is crucial to well identify the hypotheses and to choose both powerful tests and a proper parameter estimate process. A test is said to be powerful if it is able to reject a hypothesis when it is known to be false but also not reject it when it is known to be true. The reliability of the pWCET estimates holds if every hypothesis of the EVT is verified. Making use of the well defined tests and a proper estimate of
the distribution parameters, here ξ and αu , the reliability can be guaranteed. The diagXtrm, by construction tends to reduce the sources of uncertainty that lie on the execution time measurements to fulfill the EVT hypotheses and the selection of the threshold [38]; moreover it quantify the estimates confidence. In that sense, the tool is a diagnostic of the stastical modeling with the EVT. The tool is designed as a logical workflow which checks the applicability of the EVT with specific tests. For an input trace of execution times, diagXtrm provides a pWCET estimate C λ and an associated confidence with regard to the EVT applicability hypotheses. The hypotheses to check on the trace of execution time measurements are: 1) stationarity, 2) short range dependence, 3) local independence of the peaks, 4) empirical peaks over the threshold follow a GPD. The four hypotheses define the hypothesis testing blocks includes in the main steps of the tool, described in Figure 3. In this section the diagXtrm is presented at a high level; the tests that compose it will be detailed in the following section. Trace T
1) Stationarity
no
STOP
yes 2) Short range dependence
no
STOP
p − value = P (H0 |H0 ) =
σ
� −x2 � 1 exp √ 2π 2σ 2
α −cv
0
result
+cv
Figure 4: Hypothesis testing with a metric following a Gaussian law. (cv: the associated critical value to the α false positive rate)
reject it decreases. Fuzzy logic is widely used to build decision making processes and is called robust statistics [12, 22, 26] when applied to statistics by quantifying the uncertainties associated to classical statistical approaches. For instance, instead of having or not a stationary trace of ETs, fuzzy logic quantifies whether the trace is near or far from the stationary model. The nearest it is the more confidence there is in the EVT applicability. Instead of one α level, 4 values are selected so that it is possible to either reject H0 or accept H0 with low, medium, high and full confidence level, corresponding to the p − values 0.01, 0.025, 0.05 and 0.1. To resume, the approach we are formalizing for the pWCET estimation with EVT defuzzifies the statistical test by associating fuzzy p − values to human-understandable confidence levels, depicted in Figure 5, and ease the decision making.
yes Confidence level cl Threshold selection
4 3
3) Local dependence of the peaks
yes
Peaks over the threshold are iid from a GPD
ξ, αu
2
yes 4) Matching
Reliable
1
no
no STOP
Not reliable
Figure 3: Decision diagram of the diagXtrm enlisting the tests and actions applied.
4.1
0.01| 0.025| cv4 cv3
0.05| cv2
0.1| cv1
p − value| result
Figure 5: The Defuzzification is a function from fuzzy p − values (or equivalently their associated critical value (cv)) to confidence levels in {0; 1; 2; 3; 4}. For increasing confidence levels, H0 is rejected or H0 is accepted with low, medium, high and full confidence.
Design of the tests
diagXtrm is mainly based on the hypothesis testing theory that studies the rejection of a null hypothesis H0 . If H0 is not rejected it is a necessary but not sufficient condition to satisfy H0 . The first step is to select an appropriate metric that evaluates the possibility of rejecting H0 , then the metric is applied to the trace T of execution time measurements returning a result through which making a decision about H0 . In the design phase of the test, training sets are used to quantify the power of the metric for detecting H0 . The focus is on the conditional probability to reject H0 knowing that H0 is true p − value = P (H0 |H0 ), which is the false positive rate of the test. The arbitrary threshold to reject H0 is the value α defining the confidence interval for the test, hence for the hypothesis testing. A test may have a symmetric confidence interval, a two-sided test, otherwise this is a one-sided test. If the result of the applied metric to T is within the confidence interval, then H0 is not rejected. Usually, α is chosen near 0 e.g., 0.01, 0.05 or 0.1, and corresponds to as many critical values cvs like in the two-sided test illustrated in Figure 4. If the result is in the darkest area, then H0 is rejected but one has α × 100% of rejecting wrongly H0 . We consider the possibility to fulfill H0 [26], and use a fuzzy logic approach to test hypotheses. As the possibility to fulfill H0 increases and so the confidence in H0 , the necessity to
4.2
Decision making process
Each hypothesis testing block, blocks 1), 2), 3) and 4) in Figure 3, provides a result about the trace of execution times and so a confidence level as in Figure 5. Those confidence levels aims at reliable pWCET estimates with the EVT with regard to its hypothses applicability. One purpose of the fuzzy approach is to have a common scale for every test in order to aggregate each confidence level and to get a final confidence level on the pWCET estimate with the EVT. There exist many ways to aggregate the confidence levels, but one requirement is to have an aggregation in agreement with the tool specifications. In particular, the reliability is ensured when every hypothesis is guaranteed. In the proposed process, there are four hypotheses to check: 1) the stationarity, 2) the short range dependence, 3) the local dependence of the peaks and 4) the matching with a GPD model. The final confidence level is denoted by clreliability as a possibility metric to fulfill the whole process. Consequently, the confidence levels associated to each hypothesis are: cl1 , cl2 , cl3 and cl4 . To statisfy the reliability requirement, if one confidence level is zero then the reliability has to be zero too. The confidence in the model is the barycenter of all the confidence levels so that it leads to Algorithm 1.
Algorithm 1 Aggregation algorithm of the confidence levels in the diagXtrm 1: conf idence levels ← [cl1 , cl2 , cl3 , cl4 ] . Previous analyses 2: procedure Aggregation(conf idence levels) 3: if min(conf idence levels) ≥ 1 then . Reliability 4: clreliability ← (cl1 + cl2 + cl3 + cl4 ) /4 . Reliability levels 5: else 6: clreliability ← 0 7: end if 8: end procedure
Let H0 : the EVT is applicable to T be a null hypothesis, then clreliability gives the confidence in fulfilling H0 . With regard to Algorithm 1, either H0 is rejected for a null clreliability , or H0 is accepted and in this case the higher clreliability is, the more confidence in the model there is and thus in the pWCET estimates. The power of the tool to fulfill H0 and to provide reliable pWCET estimates, depends also on the selected tests for each hypothesis. The diagXtrm is a high level methodology to provide reliable pWCET estimates, and one may easily replace a selected test in its respective hypothesis testing block by a better one thanks to new research works in time series (trace) analysis.
5. 5.1
TESTS DETAILS Stationarity analysis
Stationarity is an essential property in statistical analyses but it is usually assumed. The problem is even more diffcult because there is no systematic way to study stationarity and it often relies on subjective analyses [34]. Definition 5.1 (Strictly Stationary Trace). A trace T = (C1 , C2 , . . .) is a strictly stationary trace if for all j, k, l, the set of execution times Cj , . . . , Cj+k has the same probabilistic law as the set Cl+j , . . . , Cl+j+k . If the execution time measurements in T are such that they respect Definition 5.1, then there is strong evidence that measurements are identically distributed (id) from the same probabilistic law (e.g., Gaussian, Gumbel, Weibull etc). As probabilistic laws are continuous, the stationarity analysis also addresses the problem of continuous execution times, even though execution times are discrete variables (see footnote 4). The stationarity analysis in the diagXtrm applies a test to check Definition 5.1. As in practice the law of the execution times is unknown, we consider that a trace of execution times, at each discrete time instant t, can be written as the sum of a deterministic trend f (t), a random walk rt and a stationary residual �t [27]: T (t) = f (t) + rt + �t .
(4)
rt is a random walk and may be written rt = rt−1 + ut where ut is a noise following a Gaussian distribution of mean 0 and unknown standard deviation σu . The Kwiatowski Philips Schmidt Shin (KPSS) test [27] checks whether T has a null deterministic trend and a null random walk for stating T . In the case of a null deterministic trend, the KPSS test consists in testing the null hypothesis H0 : σu = 0. The KPSS test is applied to T and its confidence level is evaluated on the basis of the KPSS result and the associated p − values as in Section 4.1, of the test detailed in [27].
5.2
Independence analysis
The independence analysis focuses on the short range dependence that refers to Berman’s condition, or condition D in [29, 30]: Condition 1 (D(un )). For any integers p,q and n: 1 ≤ i1 < . . . < ip < j1 < . . . < jp ≤ n such that j1 − jp ≥ l we have |P ({Ci , i ∈ A1 ∪ A2 } ≤ un ) − P ({Ci , i ∈ A1 } ≤ un ) P ({Ci , i ∈ A2 } ≤ un ) | ≤ αn,l ,
(5)
where A1 = {i1 , . . . , ip }, A2 = {j1 , . . . , jp } and αn,l → 0 as n → ∞ for some sequence l = ln = o(n). For distant enough measurements, here l as the distance, and with un a sequence in the Fisher-Tippett-Gnedenko theorem, Condition 1 assures that the limit law of the maxima is still a GEV. In this view, blocks of execution time measurements of length l are considered, and their degree of correlation is evaluated with the Brock Dechert Scheinkman (BDS) test [11]. By choosing different values of length l, the degree of correlation varies and enables to identify particular patterns within the trace of execution times; Condition 1 holds for decorrelated blocks. The BDS test consists in testing the null hypothesis H0 : T is an iid trace [11, 34] on the basis of the correlation integral. It allows to evaluate the statistical relationship between consecutive measurements (independence) and if they belong to the same distribution (identical distribution). Definition 5.2 (Correlation Integral). The correlation integral CIl,n (�) at embedding dimension l for a distance � is 1 XX χ� (||Csl − Ctl ||). (6) CIl,n (�) = n� 2
1≤s