Anal Bioanal Chem (2010) 397:115–125 DOI 10.1007/s00216-010-3464-7
ORIGINAL PAPER
Comparison of two derivatization-based methods for solid-phase microextraction–gas chromatography–mass spectrometric determination of bisphenol A, bisphenol S and biphenol migrated from food cans P. Viñas & N. Campillo & N. Martínez-Castillo & M. Hernández-Córdoba
Received: 29 September 2009 / Revised: 22 December 2009 / Accepted: 7 January 2010 / Published online: 3 February 2010 # Springer-Verlag 2010
Abstract An environmentally friendly sample pretreatment system based on solid-phase microextraction (SPME) for the sensitive determination of bisphenol A (BPA), bisphenol S (BPS) and biphenol (BP) is described. Two derivatisation reactions to obtain volatile derivatives are compared. Derivatisation with acetic anhydride (AA) was performed in situ in a 5-mM Na2CO3/NaHCO3 buffer solution and analytes were extracted by direct immersion (DI) using a PA fibre (85 µm) at 90°C for 40 min with stirring at 1,500 rpm. For derivatisation with bis-(trimethylsilyl)trifluoroacetamide (BSTFA), the analytes were first extracted by DI using the PA fibre at 70°C for 40 min with stirring at 500 rpm. The fibre was then removed, dried in a nitrogen stream for 2 min and introduced into the headspace of BSTFA at 50°C for 30 s. After derivatisation, the analytes were desorbed in the injection port of the GC in the splitless mode at 280°C for 4 min. The separation was carried out by coupling gas chromatography with mass spectrometry in the selected ion monitoring mode, GC-MS(SIM). The method allowed the determination of the migrating levels of bisphenols found in food cans, and it was validated for linearity, detection and quantitation limits, selectivity, accuracy and precision. Detection limits ranged from 3 to 16 pg mL−1, depending on the compound, at a signal-to-noise ratio of 3. Recoveries obtained for spiked samples were satisfactory for all compounds. Levels of BPA were higher than those of BPS and the lowest contents were found for BP. P. Viñas : N. Campillo : N. Martínez-Castillo : M. Hernández-Córdoba (*) Department of Analytical Chemistry, Faculty of Chemistry, University of Murcia, 30071 Murcia, Spain e-mail:
[email protected]
Keywords Gas chromatography–mass spectrometry . Solidphase microextraction . On-fibre derivatisation . Bisphenols . Food cans
Introduction Bisphenol A (BPA), 4,4′-dihydroxy-2,2-diphenylpropane, is a chemical used as stabilising material for the production of polycarbonate, epoxy resins, unsaturated polyester resins and polyacrylate and polysulphone resins [1]. Bisphenol S (BPS), 4,4′-sulphonyldiphenol, is used in curing fast drying epoxy glues, as an anti-corrosive and it is also commonly used as a reagent in polymer reactions. 2,2'-Biphenol (BP) is an important organic intermediate which can be used as antioxidant for rubbers and plastics and also as dyestuff intermediate and oil product stabiliser. Thanks to its excellent thermal resistance, it can be used as modifying monomer for polyester, polyurethane, polycarbonate and epoxy resin to produce engineering plastics and composite materials with excellent properties. Many foodstuff containers are made of these resins, such as polycarbonates (storage containers, infant feeding bottles, microwave ovenware or milk bottles) and epoxy resins (lining food cans or coating of metal lids for glass jars) [2]. At high temperatures (sterilisation or microwave heating of canned food), the resin or polymeric material can decompose and bisphenol-type compounds migrate from packaging to food [3]. The most important factors influencing the migration of bisphenols are the time and temperature used in the manufacture of the resins (incomplete polymerisation produces the leaching of an increasing amount of residual BPA from the epoxy resin), the conditions of time and
116
temperature of the canning process, as well as the presence of sodium chloride, vegetable oils or acids, and the storage time of the canned foods [3]. BPA is also an endocrine disruptor, showing estrogenic activity, and has been classified as a carcinogen and mutagenic compound, producing adverse effects on animal and aquatic life and to human health [4]. The EU Commission established a specific migration limit (SML) for BPA from food contact plastic materials of 600 ng g−1 [5] and the reference dose established by the Environmental Protection Agency (EPA) [6] is 0.05 mg BPA/kg body weight/day. The extensive use of BPA-based polymers, has led to widespread contamination and concentrations in the ranges 0.1–384 ng g−1 in foodstuffs have been reported [1]. Consequently, new efficient and sensitive methods are necessary in order to control human exposure to bisphenols. Determination of bisphenol-type compounds in foods requires a sample preparation step prior to chromatographic analysis. Solid-phase extraction (SPE) [7–18] and liquid– liquid extraction (LLE) [8, 10, 14, 18, 19] are the most widely used techniques for the isolation of BPA from foods. However, these conventional approaches are tedious and time-consuming and require great volumes of sample and organic solvents, as repeated extractions are usually necessary to ensure the complete isolation of BPA. The use of large amounts of organic solvents produces environmental contamination, risks for human health and additional costs for residue treatment. Because of the importance of developing clean chemistry procedures with a minimal use of organic solvents, a number of miniaturised sorptive extraction techniques for sample preparation have emerged, as discussed in a recent review [20]. One of the most important solvent-free pre-concentration techniques is SPME, which offers the possibility of automation and is clean, selective, rapid and efficient, improving the isolation and clean-up of contaminants from food [20, 21]. SPME is based on the partitioning of analytes between a fused silica fibre coated with a thin layer of a sorbing material and a sample [22, 23]. The extraction can be performed by exposure to the vapour phase above a liquid sample in the headspace (HS-SPME) or by direct immersion into the sample (DI-SPME), the desorption being carried out by dissolution when interfaces with liquid chromatography (LC). SPME coupled to gas chromatography–mass spectrometry (GC-MS) has been applied to the determination of BPA in aqueous food simulants [24, 25] and other samples [26–29]. SPME-LC-Fluorescence has been used for the analysis of BPA in food cans [30] or human plasma [31]. The miniaturised sample treatment technique can be coupled to a chromatographic technique and different analytical methods for determining BPA residues in different food matrices have been proposed, mainly based
P. Viñas et al.
on GC or LC. The coupling GC-MS offers adequate selectivity and sensitivity and is excellent for preventing interferences. Thus, the technique has widely been used for the analysis of BPA in food without derivatisation [32–36]. However, the derivatisation of bisphenols allows nonvolatile compounds to be converted into volatile derivatives, thus improving the separation, selectivity or sensitivity of SPME-GC determination. This step can be performed in the sample solution prior to sampling, on the SPME fibre coating or during desorption in the GC injection port. For on-fibre derivatisation, the chemical agent has to be loaded on the fibre prior to or after analyte extraction. Commonly, the analytes are first extracted and then the fibre is exposed to the vapour of the derivatising agent [37]. Silylation and acetylation have been the most used derivatisation procedures for phenols. Silylation of the active hydrogens of BPA is mainly carried out using bis(trimethylsilyl)trifluoroacetamide (BSTFA) [25, 38–40]. Acetylation of the hydroxyl groups of BPA with acetic anhydride (AA) [41, 42] is another frequent procedure for obtaining volatile derivatives. GC-MS is the most sensitive technique for the determination of BPA in foods [43, 44] and water [45, 46]. As far as we know, no procedures based on the SPMEGC-MS technique have been reported for the determination of BPS and BP. The present study describes SPME methods for the sensitive determination of BPA, BPS and BP migrated from food cans. Derivatisation was necessary to convert the non-volatile compounds into volatile derivatives and two reactions were compared using AA and BSTFA. The developed method was validated according to the criteria of Commission Decision 2002/657/EC.
Materials and methods Reagents Analytical-reagent grade methanol was purchased from Lab-Scan (Dublin, Ireland). Ultrapure water was obtained from a Milli-Q water purification system (Millipore, Bedford, MA, USA). Commercially available bisphenol A (4,4′-dihydroxy-2,2-diphenylpropane), bisphenol S (4,4′-sulphonyldiphenol) and biphenol (2,2′-biphenol; >98–99%) were obtained from Sigma (St. Louis, MO, USA). Stock solutions (100 mg L−1) were prepared by dissolving the commercial products, without previous purification, in methanol. They were kept at −4°C in dark bottles sealed with PTFE/silicone caps. Working standard solutions were prepared daily by diluting with methanol. The derivatising reagents were BSTFA and BSTFA containing 1% trimethylchlorosilane (TMCS), obtained from Supelco (Bellefonte, PA, USA), and AA (Fluka,
Bisphenol A, bisphenol S and biphenol from food cans
Switzerland, >99%); all reagents were maintained at room temperature in the dark. Instrumentation GC analyses were performed on an Agilent 6890N (Agilent, Waldbronn, Germany) gas chromatograph coupled to an Agilent 5973 quadrupole mass selective spectrometer equipped with an inert ion source and provided with a split–splitless injection port and a 0.75 mm i.d. liner. The mass spectrometer was operated using electron-impact (EI) mode (70 eV). The helium carrier gas was maintained at a constant flow of 1 mL min−1. A SLBTM-5MS (Supelco, Barcelona, Spain) capillary column (30 m×0.25 mm i.d., 0.25 µm film thickness) was used. Desorption of the fibres into the injection port was carried out in the splitless mode at 280°C for 4 min. The GC temperature was programmed as follows: start temperature of 80°C and increase to 320°C at 20°C min−1. The temperatures of the ion source and the transfer line were 230°C and 325°C, respectively. Bisphenols were quantified in the SIM mode in order to improve the detection limits, using one target and two or three qualifier ions. Identification was confirmed by the retention time of the target ion and the qualifier-to-target ion ratios for each compound (Table 1). The SPME holders for manual use and fibres coated with 100 µm polydimethylsiloxane (PDMS, apolar), 65 µm polydimethylsiloxane-divinylbenzene, (PDMS-DVB, bipolar), 50/30 µm divinylbenzene-carboxenpolydimethylsiloxane (DVB-CAR-PDMS, bipolar), 65 µm carbowax-divinylbenzene (CW-DVB, polar), 85 µm polyacrylate (PA, polar) and 60 µm polyethylene glycol (PEG, polar), were purchased from Supelco. The fibres were conditioned by heating in the injection port of the GC according to the manufacturer. All analyses were performed in 15-mL amber glass vials sealed with hole-caps and PTFE/ silicone septa and the solutions were stirred with a magnetic stirrer (IKA RH KT/C, Supelco) using PTFE-coated magnetic stir bars (10 mm×6 mm o.d.). To control the adsorption temperature, a home-made heating system consisting of a drilled block provided with an electronic temperature control
Table 1 Retention time and target and qualifier ions for the bisphenols
Compound
Derivatizing
Biphenol
BSTFA AA BSTFA AA BSTFA AA
Bisphenol S Bisphenol A
117
system was used. Derivatisation with BSTFA was performed in 1.5-mL amber glass vials sealed with hole-caps and PTFE/ silicone septa to avoid evaporation. An IKA-A11 grinder and an UP 200H ultrasonic probe processor (Dr. Hielscher, Teltow, Germany) were also used for the homogenisation of samples. Samples Samples of different type of foods stored in cans internally protected with epoxy lacquers were obtained commercially from different manufacturers and analysed just after opening. Samples included peas, peas with carrots, sweet corn, artichoke, mushroom, bean shoot and mixed vegetables. Both the supernatant liquid contained in the can and the solid food were analysed. Recovery experiments were carried out using samples which were spiked with a standard mixture of bisphenols at two concentration levels of 0.5 and 5 ng mL−1. The samples were allowed to stand at 4°C for at least half an hour before starting the extraction procedure. Analytical procedure All analyses were performed using 15 mL amber vials. The samples were filtered and the supernatant liquid was separated from the food. Then, both liquid and solid samples were analysed separately. For the analysis of the canned food, the solid sample was triturated in an IKA-A11 grinder and sonicated for 5 min (50% amplitude) by means of a probe directly immersed in the sample. Then, portions of 2 g were weighed into 15 mL vials and 13 mL of water were added. For analysis of supernatant liquid, the samples were prepared by adding 10 mL of the supernatant liquid and 4 mL of water. For the in situ derivatisation with AA, 100 µL of the reagent and 1 mL of 5 mM Na2CO3/NaHCO3 buffer solution (pH 5) were added. After 1 min, to avoid sputtering, the vial was sealed with the cap after introducing the magnetic stir bar and placed in the home-made heating module. Analytes were extracted by DI using the PA fibre (85 µm) at 90°C for 40 min with stirring at 1500 rpm. For the derivatisation with BSTFA, the analytes were first extracted by DI using the PA fibre at 70°C for
tR (min) 7.65 7.94 9.26 9.36 10.09 10.65
T 186 186 165 165 213 213
Q1 (Q1/T %) 157 128 180 180 228 228
(75) (52) (42) (80) (90) (75)
Q2 (Q2/T %) 165 228 236 236 357 312
(42) (15) (13) (51) (71) (68)
Q3 (Q3/T %) 228 43 186 242 371 270
(17) (10) (12) (4) (21) (10)
118
P. Viñas et al.
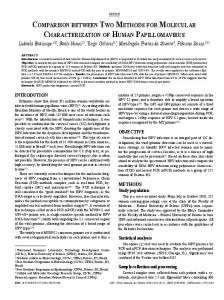
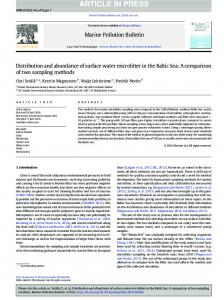
Fig. 1 Influence of the type of fibre (a) using DI-SPME and BSTFA derivatisation and the extraction mode (b) for both BSTFA and AA derivatizing reagents. Sample volume, 15 mL; desorption time, 4 min; 40 ng mL−1 bisphenols
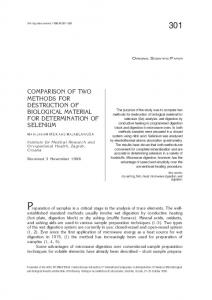
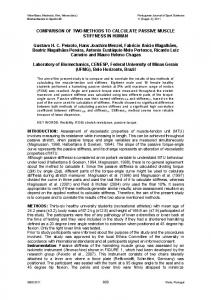
40 min and stirring at 500 rpm. Then, the fibre was removed and dried using a nitrogen stream for 2 min to avoid hydrolysis of the derivatizing reagent. Finally, the fibre was introduced into the headspace of a 1.5 mL amber vial containing 10 μL of BSTFA at 50°C for 30 s. After derivatisation, the analytes were desorbed in the injection port of the GC in the splitless mode at 280°C for 4 min. Each sampling was performed in duplicate. Fig. 2 Influence of extraction temperature (a) and extraction time (b) using the PA fibre for both derivatisation reactions. Sample volume, 15 mL; desorption time, 4 min. Symbols correspond to: BP, 4 ng mL−1 (filled circle); BPS, 2 ng mL−1 (filled inverted triangle) and BPA, 7 ng mL−1 (filled square)
Results and discussion GC-MS separation The separation conditions were optimised by comparing two different capillary columns coated with non-polar stationary phases, SLB-1MS (100 % dimethylpolysiloxane) and SLB-5MS (5% diphenyl–95 % dimethylpolysiloxane;
Bisphenol A, bisphenol S and biphenol from food cans
119
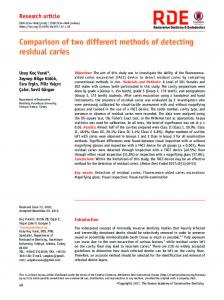
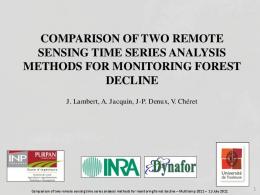
Fig. 3 Influence of pH on efficiency extraction using the PA fibre for both derivatisation reactions. Sample volume, 15 mL; desorption time, 4 min. Symbols correspond to: BP, 4 ng mL−1 (filled circle); BPS, 2 ng mL−1 (filled inverted triangle) and BPA, 7 ng mL−1 (filled square)
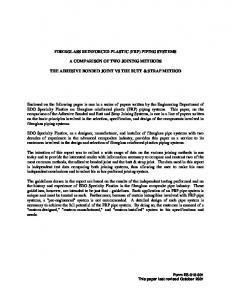
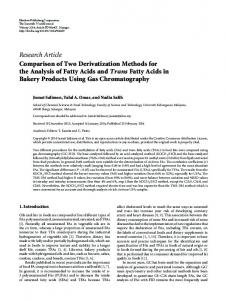
30 m×0.25 mm×0.25 µm). Best separation was achieved with the SLB-5MS column, which was selected. Several temperature programmes were tested in order to achieve the best separation and the shortest analysis time. The programme selected is summarised in the “Experimental” section. The flow of helium gas was varied in the 0.5–4 mL min −1 range and an optimal value of 1 mL min−1 was selected. Table 1 shows the retention times as well as the target and the qualifier ions selected for the bisphenols under the chromatographic conditions finally used in the SIM mode. Optimisation of SPME conditions The derivatisation with AA was performed in situ and, consequently, the experimental variables affecting to both the extraction and derivatisation processes were studied together. However, for derivatisation with BSTFA, the analytes were first extracted by DI and then the fibre was removed and introduced into the headspace of BSTFA. In this case, the experimental variables were different for both the extraction and derivatisation steps. The SPME coatings tested for the extraction efficiency differed in their polarity and sorptive properties. The fibres assayed using the DI mode were: PDMS, PDMS-DVB, PA, Fig. 4 Optimisation of the derivatizing reagent volumes using the PA fibre. Sample volume, 15 mL; desorption time, 4 min. Symbols correspond to: BP, 4 ng mL−1 (filled circle); BPS, 2 ng mL−1 (filled inverted t riangle) and BPA, 7 ng mL−1 (filled square)
CW-DVB, DVB-CAR-PDMS and PEG. The presence of both derivatizing reagents produced many problems concerning the durability of the fibres. Carbowax is a hydrosoluble material, whose durability is often a problem because it swells and becomes detached when used to extract analytes from water samples. Thus, the durability must be considered as fibres made of PDMS and CW-DVB were rapidly detached after ten extractions. Figure 1a shows the extraction efficiencies obtained for triplicate injections of the bisphenol mixture and BSTFA performed on the more stable fibres. Maximum sensitivity for most compounds and long durability was achieved with the PA fibre, which was selected. The two extraction SPME modes, HS and DI, were compared using the PA fibre and both derivatizing reagents. Figure 1b shows that extraction efficiencies were around ten and one hundred times higher, depending on the analyte, when the latter method (DI) was used. When the extraction temperature was varied between 30°C and 90°C using an extraction time of 20 min, the extraction efficiency increased for higher temperatures up to 70°C for all compounds when derivatising with BSTFA and for temperatures of 90°C when using AA, except for BPS (Fig. 2a). In both cases, the use of higher temperatures led to analyte losses as a result of sample boiling. The
120
P. Viñas et al.
Table 2 Analytical data for bisphenol standards using the SPME-GC-MS method Compound
Derivatizing
Biphenol
BSTFA AA BSTFA AA BSTFA AA
Bisphenol S Bisphenol A
Working range (ngmL−1) 0.08–10 0.1–8 0.01–1 0.1–10 0.05–10 0.1–10
r2 0.9928 0.9951 0.9959 0.9984 0.9934 0.9954
LOD (ngmL−1)
LOQ (ngmL−1)
RSD (n=10)
0.01 0.03 0.0025 0.022 0.016 0.025
0.033 0.1 0.0083 0.073 0.055 0.083
2.09 1.96 4.47 4.11 5.12 5.43
temperatures selected were 70°C and 90°C for BSTFA and AA, respectively. The extraction time was critical for establishing the equilibrium between the sample and the PA fibre and Fig. 2b shows the influence of this variable for times between 10 and 80 min. The extraction efficiency increased for longer extraction times of up to 60 or 40 min. A time of 40 min was selected for both derivatisation reactions to decrease the total analysis time. The kinetic of the process is very important in SPME, and stirring aqueous samples may reduce the extraction time. The stirring speed was varied between 100 and 2,000 rpm and the signals increased, especially for BPA, up to a speed of 500 rpm when using BSTFA, and 1,500 rpm for AA, these values being selected. The pH and ionic strength of the sample can affect the extraction efficiency by decreasing the solubility of the analytes when they are present mainly in their neutral form. Figure 3 depicts the pH effect in the 3–8 range, using 0.01 M phosphate buffer solutions and BSTFA. As can be seen, maximal extraction was obtained for all compounds at about pH 6, which was selected. The pH was varied using 0.05 M Na2CO3/NaHCO3 buffer solutions when using AA for derivatisation and, in this case, a value of pH 5 led to maximal bisphenol extraction efficiency. The influence of ionic strength was studied by adding 0–15% m/v concentrations of sodium chloride. However, the fibre was damaged in the presence of such concentrations of salt and, consequently, its use was discarded. Optimisation of derivatisation reactions As indicated, the conditions for derivatisation with AA were optimised, together with the extraction process. However, when using BSTFA, silylation hyphenated with SPME is difficult because the reagents and the silylmethylated derivatives are hydrolyzed in aqueous solutions. To avoid this problem, the analytes were first extracted by DI and then the fibre was removed, exposed to a nitrogen flow to remove water and solvent residues, and bisphenols were immediately derivatized by exposing to the BSTFA gaseous phase. Thus, in this case, the experimental variables were different for the extraction and derivatisation steps.
Fig. 5 Elution profile obtained for an aqueous standard sample by SPME-GC-MS using the total ion chromatogram. a Chromatogram using AA derivatisation: BP (1 ng mL−1), BPS (5 ng mL−1) and BPA (1 ng mL−1); b using BSTFA derivatisation: BP (1 ng mL−1), BPS (0.1 ng mL−1) and BPA (1 ng mL−1); c without derivatisation: BP (5 ng mL−1); BPS (5 ng mL−1) and BPA (5 ng mL−1)
Bisphenol A, bisphenol S and biphenol from food cans
Several variables were examined to determine their influence on the silylation process. When the temperature was varied between 30°C and 70°C, extraction efficiency was seen to increase up to 50°C for all compounds. The derivatisation time was varied in the 0–120 s range and optimal efficiencies were obtained at 30 s. The presence of a catalyst can modify the reaction and thus the efficiency of both reagents, BSTFA and BSTFA + 1% TMCS, was compared. However, similar extraction efficiencies were obtained and, consequently, the BSTFA reagent was selected. Since the fibre must be dried before derivatisation using a nitrogen stream to avoid hydrolysis of the reagent, the drying time was varied between 1 and 10 min, with optimal effectiveness of the reaction being achieved when the fibre was dried for 2 min in a closed vial at room temperature. The optimal volumes of the derivatizing reagents are very important parameters to achieve maximal extraction efficiency (Fig. 4). Thus, the volume of BSTFA was varied in the 5–100 µL range and the maximal signal for all the analytes was obtained when 10 µL were used. The volume
Fig. 6 Elution profile obtained for a peas-with-carrots canned sample by SPME-GC-MS using derivatisation with BSTFA. Peaks correspond to: 1 BP, 2 BPS and 3 BPA
121
of AA was varied between 10 and 500 µL and a value of 100 µL was selected. Optimisation of desorption conditions The effects of both the temperature and time of the desorption step were studied. Temperature was varied between 240 and 300°C and the signal for all the compounds increased up to 280°C, which was selected for both derivatisation reactions. Next, the variation in the extraction efficiencies obtained for a total desorption time of 6 min, increasing by 0.5 min intervals, was studied. The optimal time for extracting maximal amounts of all compounds with no memory effects was 4 min, although most was desorbed in the first minute. Method performance The method was checked for linearity, detection and quantification limits, selectivity, accuracy and precision. Calibration curves using SPME-GC-MS were obtained by
122
P. Viñas et al.
least-squares linear regression analysis of the peak area versus analyte concentration using six concentration levels in duplicate. Quantification was performed by the external standard procedure. The validation parameters, working range and the correlation coefficients for bisphenols are shown in Table 2. The values of r2 were good (r2 >0.99) and excellent linearity was obtained for the range studied. The limits of detection (LOD, calculated as three times the signal-to-noise ratio) and the limits of quantification (LOQ, calculated as ten times the signal-to-noise ratio) are included in Table 2. It can be seen from the data that the sensitivity and detection limits were lower when using BSTFA than those obtained for the use of AA. On the other hand, in the absence of a derivatisation reaction, LOD were about one hundred times higher for all bisphenols. The lowest LOD value was 3 pg mL−1 for BPS and the highest 16 pg mL−1 for BPA, limits which are below the usual concentrations of bisphenols in foods, meaning that the method is sufficiently sensitive. To check the repeatability of the method, ten replicate analyses of a mixture were performed at the level of 1 ng mL−1 for each compound, with relative standard deviations (RSD) below 6% in all cases (Table 2). Figure 5 shows the chromatograms obtained by SPME-GC-MS under SIM mode for an aqueous standard mixture under the selected conditions, without and with derivatisation. The selectivity of the method was assessed according the absence of interfering
peaks at the elution times of the analytes for blank chromatograms of different food samples. The matrix effect was evaluated by comparing the slopes of aqueous standards and standard additions calibration graphs for the supernatant liquid of different canned food samples, obtained by plotting concentration (at six levels) against peak area and following linear regression analysis. Quantification was based on the target and qualifier ions. Slopes for the supernatant liquid from food samples were lower than those for aqueous standards. A statistical study was carried out to compare the slope values of the different samples and the aqueous standards and the analysis of variance test showed that there were statistically significant differences. Consequently, to obtain a generally reliable procedure, the standard additions method is recommended for quantitation purposes. Recovery In order to check the accuracy of the proposed method, a recovery study was carried out by fortifying two supernatants (sweet corn and peas with carrots) at two concentration levels corresponding to 0.5 and 5 ng mL−1. The recoveries of the bisphenols from spiked samples varied from 84% to 112% with an average recovery±standard deviation (SD) (n=24) of 99±8. The similarity in recoveries obtained for the different samples indicates that the
Table 3 Bisphenol contents in supernatant liquid of canned food (nanogrammes per millilitre) and canned food (nanogrammes per gramme) Canned food
Peas and carrots Peas Natural peas Sweet corn 1 Sweet corn 2 Artichoke Mushroom Bean shoot Mixed vegetables
Sample
BPA
BPS
BP
BSTFA
AA
BSTFA
AA
BSTFA
AA
Supernatant Food Supernatant Food Supernatant Food
254±14 77.7±8.5 317±26 50.3±6.4 226±13.7 44.8±5.3
234±16 65.6±7.9 321±17 54.4±7.3 232±26 38.9±4.8
175±18 36.1±4.4 16.7±3.7 ND 30.9±3.3 ND
170±5.3 34.1±5.9 18.6±3.1 ND 34.3±5.9 ND
176±16 20.9±3.4 290±27 40.1±6.2 365±14 17.8±1.0
173±12 17.2±2.3 283±19 34.1±2.9 358±29 15.3±1.1
Supernatant Food Supernatant Food Supernatant Food Supernatant Food Supernatant Food Supernatant Food
13.3±2.4 ND 11.7±3.3 ND 75.7±6.8 18.8±1.8 156±16 ND 35.7±3.4 ND 135±8.9 14.9±3.4
15.9±3.3 ND 13.1±2.9 ND 78.5±8.1 12.9±3.5 136±4.7 ND 41.9±3.0 ND 124±13.6 19.1±5.1
ND ND ND ND 34.3±4.9 ND 11.5±1.8 ND 14.0±1.8 ND 70.1±6.6 ND
ND ND ND ND 30.1±2.4 ND 8.90±0.3 ND 19.3±2.1 ND 73.9±9.5 ND
17.2±2.1 ND 31.5±4.4 ND 36.4±2.5 ND 136±14 ND 71.5±9.6 ND 221±14 24.8±4.0
20.5±3.1 ND 25.1±4.2 ND 31.6±3.9 ND 129±18 ND 74.3±5.9 ND 235±27 27.1±2.5
Values are mean±standard deviation (n=3)
Bisphenol A, bisphenol S and biphenol from food cans
123
Table 4 Migration tests with food simulants Time, h
BPA (ng mL−1)
BPS (ng mL−1)
BP (ng mL−1)
Water (25°C)
Water (80°C)
3% HAc (25°C)
3% HAc (80°C)
Water (25°C)
Water (80°C)
3% HAc (25°C)
3% HAc (80°C)
Water (25°C)
Water (80°C)
3% HAc (25°C)
3% HAc (80°C)
0.08 0.5 1 2 4 12 24 72 120 144
0 0 0 0 0 0 0.26 0.57 1.65 2.53
0 0 0 0 0 1.78 3.87 8.57 24.8 37.9
0 0 0 0 0 1.85 2.90 4.23 6.45 8.60
0 0 0 0 10.9 52.0 111 174 254 367
0 0 0 0 0 0 0 0.055 0.071 0.14
0 0 0 0 0 0 0 0.16 0.75 2.72
0 0 0 0 0 0.18 0.43 0.49 0.51 0.64
0 0 0 0 0 0.54 1.30 1.47 1.53 3.43
0 0 0 0 0 0 0.36 0.50 0.71 1.74
0 0 0 0 0 0 1.07 1.51 2.12 6.29
0 0 0 0 0 0.39 0.86 1.52 1.96 3.30
0 0 0 0 0 0.45 1.16 2.57 4.56 5.89
192 240
3.13 4.97
47.0 74.6
503 516
0.44 0.52
3.14 3.54
0.91 2.17
4.15 5.36
2.50 3.17
7.50 8.58
3.69 4.98
11.4 16.0
matrix effect was corrected by using the standard additions calibration. Analysis of canned foods The supernatant liquids of canned foods were analysed under the selected conditions. Figure 6a shows a typical chromatogram obtained by SPME-GC-MS under SIM mode for a peas and carrots sample under the selected conditions, showing the ion corresponding to each peak. Similar chromatograms were obtained for the other samples. The profiles demonstrated the absence of interfering peaks at the retention times for the analytes. Figure 6b shows the mass spectra, which confirmed the identity. The bisphenols were identified by comparing the retention time, identifying the target (T) and qualifier ions (Q) and comparing the qualifier-to-target ratios (Q/T%) of the peaks in both the sample and the standard solution. The average values for the retention times pointed to very good agreement between the retention data obtained in the
10.9 14.1
different samples. The T and Q abundances were determined by injecting individual standards under the same chromatographic conditions, except in full scan mode. The Q/T percentage was determined by dividing the abundance of the selected qualifier ion by the target ion (see Table 1). After identification of the peaks, different canned food supernatants were analysed using the SPME-GC-MS procedure. All samples were analysed in triplicate and Table 3 shows the results obtained (nanogrammes per millilitre). Migration levels of BPA were higher than those of BPS and the lowest contents were found for BP. The food solid portions were also analysed and results are shown in Table 3 (nanogrammes per gramme). Higher levels were obtained for BPA and lower levels for BPS. A comparison of the bisphenol contents considering the volume of the supernatants and the weight of the solid foods might conclude that most of bisphenols which have migrated from the packaging to the food were present in the supernatants (most above 75%). In all cases, contents of the solid canned foods were below the MRL of 600 ng g−1 for
Table 5 Validation of the procedure according to the criteria of Commission Decision 2002/657/EC Compound
Derivatising
BPA
BSTFA AA BSTFA AA BSTFA AA
BPS BP
a
Added (ng g−1) 600a 600a 600a
Found±SD (ng g−1) 591±10 609±4 603±6 592±15 591±8 613±10
MRL for bisphenols with established permitted limits
Error α (1.64×SD)
CCα (ng g−1)
Added (ng g−1)
17 6.5 9.8 25 13 17
617 607 610 625 613 617
617 607 610 625 613 617
Found±SD (ng g−1) 612±8 625±13 615±7.4 593±29 603±10 635±7
Error β (1.64×SD)
CCβ (ng g−1)
13 22 12 47 17 12
625 647 627 641 619 647
124
P. Viñas et al.
bisphenols. Consequently, the supernatant can be considered as a test portion of the whole canned food, thus confirming the application of the described methodology.
using organic solvents or clean-up steps, thus reducing the sample preparation time and allowing the reliable control and screening of canned foods.
Migration studies using food simulants
Acknowledgements The authors are grateful to the Spanish MEC (Project CTQ2009-08267/BQU) for financial support. N. MartínezCastillo acknowledges a fellowship from Departamento de Formación del Personal Académico de la Universidad Centroccidental Lisandro Alvarado (Venezuela).
A study was carried out considering the application of the proposed methodology in migration studies involving unused cans and food simulants according to Council Directive 85/572/EEC of 18 December 1995 laying down the list of simulants for testing migration of the constituents of plastic materials and intended to come into contact with foodstuffs. The food simulants are classified by convention as having the character of one or more food types. Thus, for aqueous foods, the simulant was distilled water and for acidic foods the simulant was acetic acid 3% (w/v). Consequently, both simulants were used for the migration tests in the samples of vegetables and fruits used in this study. The experiments were carried out at different migration conditions of contact for the plastic material and the food content; temperatures were 25°C and 80°C and different times of contact in the 0–240 h range were selected. Table 4 shows the results obtained. As can be seen, the levels of bisphenol A, bisphenol S and biphenol increased when acetic acid was used as simulant and higher values were also found for increased temperature and contact times up to 240 h. Validation of the method The method was also validated according to the criteria of the Commission Decision (2002/657/EC) which states that the spiking experiments for MRL substances should be around the MRL level, while validation of banned substances should focus around the quantitation limit. Statistical analysis for CCα and CCβ was performed at the 95% confidence level using 20 replicate analyses. Table 5 summarises the CCα and CCβ obtained for 20 samples at the MRL values of 600 ng g−1 for BPA, BPS and BP.
Conclusion A comparative analysis of bisphenol A, bisphenol S and biphenol using derivatisation reactions with BSTFA or AA together with SPME followed by GC-MS determination has been made. Detection limits were better using BSTFA than AA and were also about 100 times better than those obtained without derivatisation. The development and validation of the method according to 2002/657/EC Commission Decision permitted its application to the determination of migrating levels of bisphenols without
References 1. Ballesteros-Gómez A, Rubio S, Pérez-Bendito D (2009) J Chromatogr A 1216:449–469 2. Staples CA, Dom PB, Klecka GM, O’Blook ST, Harris LR (1998) Chemosphere 36:2149–2173 3. Jeong-Hun K, Fusao K, Yoshiki K (2006) Toxicology 226:79–89 4. Krishnan AV, Stathis P, Permuth SF, Tokes L, Feldman D (1993) Endocrinology 132:2279–2286 5. Commision Directive 2004/19/EC, Off J Eur Commun L71 8 6. http://www.epa.gov/iris/subst/0356.htm 7. Lambert C, Larroque M (1997) J Chromatogr Sci 35:57–62 8. Yoshida T, Horie M, Hoshino Y, Nakazawa H (2001) Food Addit Contam 18:69–75 9. Kang JH, Kondo F (2002) Food Addit Contam 19:886–890 10. Kang JH, Kondo F (2002) Res Vet Sci 73:177–182 11. Inoue K, Murayama S, Takeba K, Yoshimura Y, Nakazawa H (2003) J Food Compos Anal 16:497–506 12. Shao B, Han H, Hu J, Zhao J, Wu G, Xue Y, Ma Y, Zhang S (2005) Anal Chim Acta 530:245–252 13. Covaci A, Voorspoels S (2005) J Chromatogr B 827:216–223 14. Kang JH, Kondo F, Katayama Y (2006) Anal Chim Acta 555:114–117 15. Sun C, Leong LP, Barlow PJ, Chan SH, Bloodworth BC (2006) J Chromatogr A 1129:145–148 16. Maragou NC, Lampi EN, Thomaidis NS, Koupparis MA (2006) J Chromatogr A 1129:165–173 17. Kuruto-Niwa R, Tateota Y, Usuki Y, Nozawa R (2007) Chemosphere 66:1160–1164 18. Gyong Y, Shin JH, Kim HY, Khim J, Lee MK, Hong J (2007) Anal Chim Acta 603:67–75 19. Toyo’oka T, Oshige Y (2000) Anal Sci 16:1071–1076 20. Nerín C, Salafranca J, Aznar M, Batlle R (2009) Anal Bioanal Chem 393:809–833 21. Luque de Castro MD, Luque García JL (2002) Acceleration and automation of solid sample treatment. Elsevier, The Netherlands 22. Pawliszyn J (1997) Solid phase microextraction. Theory and practice. Wiley-VCH, New York 23. Pawliszyn J (ed) (1999) Applications of Solid Phase Microextraction. Royal Institute of Chemistry 24. Salafranca J, Battle R, Nerín C (1999) J Chromatogr A 864:137–144 25. Chang CM, Chou CC, Lee MR (2005) Anal Chim Acta 539:41–47 26. Helaleh MIH, Fujii S, Korenaga T (2001) Talanta 54:1039–1047 27. Braun P, Moeder M, Schhrader S, Popp P, Kuschk P, Engewald W (2003) J Chromatogr A 988:41–51 28. Basheer C, Parthiban A, Jayaraman A, Kee-Lee H, Valiyaveettil S (2005) J Chromatogr A 1087:274–282 29. Xiangli L, Li L, Shichun Z, Chongyu L, Tiangang L (2006) Chin J Anal Chem 34:325–328
Bisphenol A, bisphenol S and biphenol from food cans 30. Nerín C, Philo MR, Salafranca J, Castle L (2002) J Chromatogr A 963:375–380 31. del Olmo M, Zafra A, Suárez B, Gónzalez-Casado A, Taoufiki J, Vílchez JL (2005) J Chromatogr B 817:167–172 32. Munguía-López EM, Gerardo-Lugo S, Peralta E, Bolumen S, Soto-Valdez H (2005) Food Addit Contam 22:892–898 33. Biles JE, McNeal TP, Begley TH, Hollifield HC (1997) J Agric Food Chem 45:3541–3544 34. Biles JE, McNeal TP, Begley TH (1997) J Agric Food Chem 45:4697–4700 35. McNeal TP, Biles JE, Begley TH, Craun JC, Hopper ML, Sack CA (2000) ACS Symp Ser 747:33–34 36. D'Antuono A (2001) Campo Dall‘Orto V, Lo Balbo A, Sobral S, Rezzano I. J Agric Food Chem 49:1098–1101 37. Dietz C, Sanz J, Cámara C (2006) J Chromatogr A 1103:183– 192
125 38. Kuo HW, Ding WH (2004) J Chromatogr A 1027:67–74 39. Wingender RJ, Niketas P, Switala CK (1998) J Coat Technol 70:75–82 40. Basheer C, Lee HK, Tan KS (2004) Mar Pollut Bull 48:1145–1167 41. Goodson A, Summerfield W, Cooper I (2002) Food Addit Contam 19:796–802 42. Thomson BM, Grounds PR (2005) Food Addit Contam 22:65–72 43. Jin X, Jiang G, Huang G, Liu J, Zhou Q (2004) Chemosphere 56:1113–1119 44. Stuart JD, Capulong CP, Launer KD, Pan X (2005) J Chromatogr A 1079:136–145 45. del Olmo M, Gónzalez-Casado A, Navas NA, Vílchez JL (1997) Anal Chim Acta 346:87–92 46. Vílchez JL, Zafra A, Gónzalez-Casado A, Hontoria E, del Olmo M (2001) Anal Chim Acta 431:31–40