We present a novel method for onset detection in musical sig- ... the 6th Int. Conference on Digital Audio Effects (DAFx-03), London, UK, September 8-11, 2003.
Proc. of the 6th Int. Conference on Digital Audio Effects (DAFx-03), London, UK, September 8-11, 2003
COMPLEX DOMAIN ONSET DETECTION FOR MUSICAL SIGNALS Chris Duxbury, Juan Pablo Bello, Mike Davies and Mark Sandler Department of Electronic Engineering Queen Mary, University of London Mile End Road, London E1 4NS, UK ABSTRACT
0.2
We present a novel method for onset detection in musical signals. It improves over previous energy-based and phase-based approaches by combining both types of information in the complex domain. It generates a detection function that is sharp at the position of onsets and smooth everywhere else. Results on a handlabelled data-set show that high detection rates can be achieved at very low error rates. The approach is more robust than its predecessors both theoretically and practically.
(a) Piano signal
Energy burst
0 −0.1 −0.2
Duration 0
0.1
0.2
0.3
0.4
0.1
0.2
0.3
0.4
0.5
0.6
0.7
0.8
0.9
1
0.5
0.6
0.7
0.8
0.9
1
time (secs) Unstable elements Steady−state
5000
(b) Spectrogram
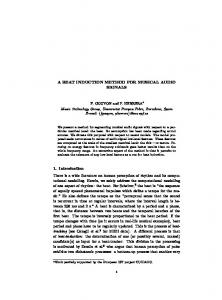
1. INTRODUCTION Temporal segmentation of audio into note events is useful for a range of audio analysis, editing and synthesis applications, such as automatic transcription [1], non-linear time-scaling and pitchshifting as in [2], and content analysis. Figure 1 shows a simple case of two piano onsets, illustrating the energy increase, short duration and instability related to note onset transients, as well as the stability of the steady-state part. The wide range of signals and onset types can be considerably more complex than this example, but these phenomena are common to most. Almost all onset detection algorithms can be separated into two distinct parts. The first of these, often called the detection function, converts the signal from its time domain samples into a function which is more effective in locating onset transients. The second part of any onset detection algorithm is often called the peak picking stage, and involves locating points in the detection function which correspond to onset transients. A strong detection function will typically have sharp peaks located at transients, and few spurious peaks located elsewhere. The more this is the case, the more robust the detection function is to the peak picking algorithm used. For this reason , the majority of this paper is concerned with the detection function generation stage. The peak picking stage should be effective in selecting only those peaks corresponding to note onsets. Therefore, simply choosing all peaks is only effective in the unlikely case of a perfect detection function. Effective thresholding of the detection function to ignore spurious peaks is a common problem in the peak picking stage. Section 4 will briefly discuss peak picking, however this work is more concerned with detection function generation which is robust to the peak picking method used. Typically, note onset detection schemes use energy based approaches, often involving frequency weighting [3]. In recent years, this has been extended to include sub-band schemes such as [4, 5]. In [6], a phase based approach to onset detection was proposed. This approach offers clear improvements to those signals which have softer, less percussive onsets. The idea was extended on [7]
0.1
4000 3000 2000 1000 0
0
time (secs)
Figure 1: Sequence of two piano notes (a) and the corresponding spectogram (b). where a combined phase and energy based approach was proposed. Here, we bind the previous work by developing a complex domain approach to note onset detection. 2. PREVIOUS APPROACHES TO NOTE ONSET DETECTION 2.1. Energy-Based Onset Detection A new note will always lead to an increase in signal energy. In the case of strong percussive note attacks, such as drums, this increase in energy will be very sharp. For this reason, energy has proved to be a useful, straightforward, and efficient metric by which to detect percussive transients, and therefore certain types of note onset. If we consider the L2 norm squared energy of a frame of the signal, x(m): E(m) =
mh X
|x(n)|2
(1)
n=(m−1)h
where h is the hop size, m the hop number and n is the integration variable. Taking the first derivative of E(m) produces a detection function from which peaks may be picked to find onset locations. This is one of the simplest approaches to note onset detection. This idea can be extended to consider frames of an FFT. Consider a
DAFX-1
Proc. of the 6th Int. Conference on Digital Audio Effects (DAFx-03), London, UK, September 8-11, 2003 3. COMPLEX DOMAIN ONSET DETECTION
time-domain signal s(mh), whose STFT is given by: ∞ X
Sk (m) =
s(n)w(mh − n)e−j2πnk/N
(2)
n=−∞
where k = 0, 1, . . . , N − 1 is the frequency bin index and w(n) is a finite-length sliding window. It follows that the amplitude difference is then: δS =
N X
|Sk (m)| − |Sk (m − 1)|
(3)
k=1
2.2. Phase-based onset detection Intuitively, Fourier analysis proposes that a signal can be represented by a group of sinusoidal oscillators with time-varying amplitudes, frequencies and phases. During the steady-state part of the signal these oscillators will tend to have stable amplitudes and frequencies. Therefore, the phase of the k th oscillator at a given time n could be easily predicted according to: ϕ ˜k (n − 1) − ϕ ˜k (n − 2) = ϕ ˜k (n) − ϕ ˜k (n − 1)
(4)
where the ϕ˜ operator denotes phase unwrapping. This implies that the actual phase deviation between the target and the real phase values is given by the term: ˜ k (n − 1) + ϕ dϕ = princarg[ϕ ˜k (n) − 2ϕ ˜k (n − 2)]
(5)
where princarg maps to the [−π, π] range. dϕ will tend to zero if the phase value is accurately predicted and will deviate from zero otherwise. The latter is the case for most oscillators during attack transients. This can be extrapolated to the distribution of deviations for all oscillators in one analysis frame. During the steady-state part of a signal most values will be concentrated around zero creating a sharp distribution. On the other hand, during attack transients the distribution will be wide and less sharp. By measuring the spread of the distribution an accurate onset detection function can be constructed [6]. 2.3. Combining phase and energy based approaches While energy-based methods are straightforward, and thus widely used, they rely on the presence of pronounced energy increases for all events in music. However this is not always the case, especially with complex mixtures when overlapping between notes is common. Phase-based approaches offer an alternative to this, increasing effectiveness for less salient onsets. However, these methods are susceptible to phase distortion and to the variations introduced by the phase of noisy components. In [7] a method was proposed that combined both the energy and the phase approaches. It made use of the similar behavior of the distributions of phase deviations and of spectral magnitude differences. Measures of spread per frame for each distribution were obtained as: η(n) = mean(fn (|x|)) (6) where f (x) is the probability density function of our data set. Then they were multiplied, emphasising the phase characteristic of those components most relevant for the analysis. The method compensated for instabilities in either approach, and produced sharper peaks for detected onsets. Results consistently outperformed both the energy and the phase-based methods.
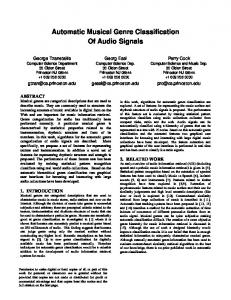
Figure 2: Phasor diagram in the complex domain showing the phase deviation between target and current vector, and the Euclidean distance between them. By definition, for locally steady state regions in audio signals, it holds that the frequency and amplitude remain constant. In the previous sections it has been shown that by inspecting changes in either frequency and amplitude onset transients can be located. However, we can simultaneously consider the effect of both variables by predicting values in the complex domain. It can be assumed that, in its polar form, the target value for an FFT bin is given by: ˆ k (m)ej φˆk (m) Sˆk (m) = R (7) ˆ where the target amplitude Rk (m) corresponds to the magnitude of the previous frame |Sk (m − 1)|, and the target phase φˆk (m) can be calculated as the sum of the previous phase and the phase difference between preceding frames: φˆk (m) = princarg[2ϕ ˜k (m − 1) − ϕ ˜k (m − 2)]
(8)
We may then consider the measured value in the complex domain from the FFT: Sk (m) = Rk (m)eφk (m)
(9)
where Rk and φk are the magnitude and phase for the kth bin of the current STFT frame. By measuring the Euclidean distance between target and current vectors in the complex space, as shown in Figure 2, we can then quantify the stationarity for the k th bin as: Γk (m)
=
{[