Clinical Chemistry 55:11 2019–2025 (2009)
Endocrinology and Metabolism
Composite Reference Interval for Thyroid-Stimulating Hormone and Free Thyroxine, Comparison with Common Cutoff Values, and Reconsideration of Subclinical Thyroid Disease H. Alec Ross,1,2* Martin den Heijer,2 Ad R.M.M. Hermus,2 and Fred C.G.J. Sweep1
BACKGROUND: Examination of the 2-dimensional probability distribution of thyroid-stimulating hormone (TSH) and free thyroxine (FT4) shows that the widths of the TSH and FT4 reference intervals derived from this bivariate distribution are mutually interdependent, an aspect commonly ignored when interpreting thyroid testing results with separate reference intervals for TSH and FT4. We desired to establish and critically evaluate a composite reference interval for TSH and FT4 to allow bivariate classification of biochemical thyroid conditions. METHODS: FT4 and TSH results of 871 healthy individuals [361 women and 510 men, 18 – 40 years old, without history of thyroid-related disease or medication, negative for anti–thyroid peroxidase (anti-TPO) antibody] were transformed to standard normal variables by logarithmic transformation with correction for skewness and subsequent normalization. We established a 95% reference interval of the distance of each FT4/TSH pair of values to the center of the 2-dimensional probability distribution. RESULTS:
The bivariate 95% reference interval is enclosed by a circular profile with radius 2.45 SD. By contrast, conventional reference intervals comprise a square with the boundaries of ⫺1.96 and ⫹1.96 SD for both FT4 and TSH that enclose only 90% of all data. Compared with the ⫾1.96 SD square, the bivariate reference interval classified 4% fewer of 3651 healthy individuals older than 40 years as subclinically hyperthyroid and 14% fewer of 712 anti-TPO–positive healthy individuals as subclinically hypothyroid. CONCLUSIONS: Conventional application of separate cutoff values for FT4 and TSH leads to overestimation of the incidence of subclinical thyroid disease. Ap-
1
Department of Chemical Endocrinology and 2 Department of Endocrinology, Radboud University Nijmegen Medical Centre, Nijmegen, the Netherlands. * Address correspondence to this author at: 479 ACE, Department of Chemical Endocrinology, Radboud University Nijmegen Medical Centre, P.O. Box 9101, 6500 HB Nijmegen, the Netherlands. Fax ⫹31-24-3541484; e-mail
plication of a composite overall reference interval is recommended. © 2009 American Association for Clinical Chemistry
Subclinical thyroid disease is defined as the combination of normal free thyroxine (FT4)3 with either subnormal or increased thyroid-stimulating hormone (TSH). It is common practice to apply the cutoff values corresponding to the 95% reference intervals (either parametrically or nonparametrically established) for FT4 and TSH established in a healthy reference population to decide how a particular FT4/TSH combination should be biochemically classified (1–3 ). In a TSH vs FT4 diagram, this corresponds to division of the area into 9 rectangular sections. In such a graphical presentation (e.g., Fig. 1A), it is obvious that these limits do not follow uniform probability densities. Moreover, a 95% reference interval obviously should enclose 95% of the reference population, but the central section in which all FT4 and TSH values fall within their corresponding ⫾1.96 SD limits encloses only 95% of 95%, i.e., 90.25% of all data points. The remaining 9.75% is distributed as follows: 0.25% for the combinations low/ low, high/low, low/high, and high/high FT4 and TSH and 9.5% for the combinations normal/low, normal/ high, low/normal, and high/normal. Thus, 4.75% of the reference population would be classified as subclinically hyper- or hypothyroid. Herein we propose a method to obtain a bivariate 95% reference interval for transformed and normalized FT4 and TSH values. The reference interval is based on combining these values in a function expressing the distance from the center of the 2-dimensional distribution. We assume a uniform probability density and set the cutoff limit so that about 5% of the refer-
[email protected]. Received January 28, 2009; accepted August 4, 2009. Previously published online at DOI: 10.1373/clinchem.2009.124560 3 Nonstandard abbreviations: FT4, free thyroxine; TSH, thyroid-stimulating hormone; TPO, thyroid peroxidase.
2019
A 6
5
TSH (mU/L)
I
III
II
4
3
2
IV
V
1
VI
0 0
VIII
VII
5
10 15 FT4 (pmol/L)
20
25
B 5 4
II
I
3
Study Participants and Methods
III
TSH (normalized)
2 1 0
IV
–1
V
–2 –3
VI
VII
VIII
–4 –5 –5
–4
–3
–2
–1
0
1
2
3
4
5
FT4 (normalized)
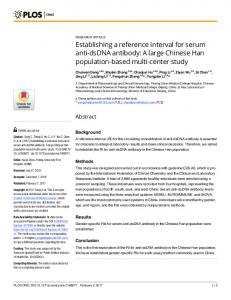
Fig. 1. TSH and FT4 values as measured in the reference group. (A), Untransformed values for data points, with reference limits obtained by reversal of the transformation and normalization, with conventional 1.96 SD limits (dotted lines) and composite limits (solid lines). Sections outside the curved reference zone correspond to thyroid conditions outlined in the text. (B), Normalized, transformed TSH and FT4 values for the reference group which formed the basis of the composite reference limits.
ence population will exceed this bivariate reference limit. Because the reference population must be suit2020 Clinical Chemistry 55:11 (2009)
able to identify cases of subclinical thyroid conditions, no signs of thyroid autonomy or failure should be conspicuous. Within a population harboring some degree of thyroid autonomy, a negative correlation between FT4 and TSH is expected due to negative feedback; conversely, in a group of individuals in which pituitary failure occurs, a positive correlation is anticipated. Therefore, if neither organ displays autonomy or fails by itself, no correlation should be observed between TSH and FT4. Basal TSH and FT4 concentrations depend on the partially genetically determined pituitarythyroid set point (4 ) that appears to result in entirely random combinations of FT4 and TSH values among individuals. When this is the case, a bivariate reference limit is easy to calculate. To investigate the effect of this approach on the definition of subclinical hyper- and hypothyroidism, we estimated the frequencies of these conditions by composite, bivariate, and conventional univariate approaches in a euthyroid older (compared to the reference group) age group without anti-TPO antibodies, and in an anti-TPO–positive group.
The individuals included in this study originated from the Nijmegen Biomedical study (5 ). Serum TSH was measured by immunoluminometric assay in an Architect random access assay system (Abbott Diagnostics). The functional detection limit (i.e., the concentration at which the interassay CV is 20%) was 0.007 mU/L. At higher concentrations, interassay CVs were as follows: 3.3% at 0.250 mU/L, 3.6% at 1.72 mU/L, and 3.0% at 9.86 mU/L. Serum FT4 was estimated by a luminescence enzyme immunoassay in a Vitros ECI random access assay system (Ortho Clinical Diagnostics). This assay uses a labeled anti-T4 antibody in a medium that is essentially free of other extraneous T4-binding proteins. Serum samples may be diluted up to 8 times without significant effect on measurement results. Interassay CVs were as follows: 3.8% at 10.1 pmol/L, 4.5% at 15.8 pmol/L, and 4.6% at 28.7 pmol/L. The total population consisted of 6434 individuals age 18 years and older. After exclusion of all those with self-reported thyroid disease and/or thyroid surgery, those on thyromimetics and thyrostatics and on other medication known to affect thyroid function or thyroid function parameters, pregnant women and women on oral contraceptives, a group of 5235 healthy individuals remained. Individuals with increased antiTPO antibodies (n ⫽ 712) (aTPO⫹ group) were excluded, and of the remaining 4523, TSH and FT4 concentrations were logarithmically transformed including a correction for skewness. Based on the mean and SD of the transformed values, 14 outliers were
Composite Reference Interval for TSH and FT4
eliminated (see Appendix for transformation and outlier algorithms). In addition, 16 individuals with TSH below the functional sensitivity limit of 0.007 mIU/L were removed. Because we had observed a tendency toward lower TSH and higher FT4 concentrations with age (5 ), the reference group was restricted to people 40 years old and younger (n ⫽ 871). The distribution of transformed FT4 and TSH values in this reference group was not found to differ from a normal gaussian distribution. From these data, we made a 2-dimensional diagram of transformed TSH plotted against transformed FT4. A reference limit was represented by a circular profile centered at (0,0), which encloses a specified fraction of all data points. The remaining 3622 individuals were supplemented with results for the previously removed 13 of 14 outliers and for 16 values with TSH below the functional detection limit, all ⬎40 years old, to form the older anti-TPO negative (⬎40, aTPO–) group (n ⫽ 3651). The squared normalized distance, D2, of each data point to the center of the distribution for this reference population equals the sum of the squared normalized TSH and FT4 values and is given by the following formula: D 2 ⫽ 关兵log(TSH ⫹ 0.303兲 ⫺ 0.243其/0.171] 2 ⫹ 关兵log(FT4 ⫹ 11.2兲 ⫺ 1.39其/0.0324] 2 .
(1)
With the assumption that TSH and FT4 are uncorrelated, D2 is mathematically identical to the Mahalonobis distance measure traditionally used for multivariate reference regions (6 ) and follows a 2 distribution with 2 degrees of freedom so that P0.95 is at 5.99. For the distance D, the critical value is 公5.99 or 2.45. The constants 0.303 and 11.2 are corrections for skewness, 0.243 and 1.39 are the means of the transformed TSH and FT4 values, and 0.171 and 0.0324 are the corresponding SDs (see Appendix). Because all outliers except one were ⬎40 years old, outlier removal had no effect on the parameters of the reference group. The area outside the composite reference interval may be subdivided into 8 sections (Fig. 1, A and B), i.e., the number of combinations of low, normal, and high TSH and FT4 with the combination normal/normal excluded. The 4 corner sections I, III, VI, and VIII represent the zones in which both TSH and FT4 exceed the same absolute limit of 1.73 (2.45/公2) SD (or conventionally, ⫾1.96 SD). Section I represents overt hypothyroidism with high TSH and low FT4, whereas section VIII represents overt hyperthyroidism with high FT4 and low TSH. Sections II and VII represent subclinical hypo- and hyperthyroidism, respectively. Using the z-test for population proportions, we compared observed frequencies in the sections statistically to each other and expected values (7 ); P values
⬍0.05 were considered significant. For P values ⬎0.25, the predicate “not different” was assigned. Distributions were tested for normality by Kolmogorov– Smirnov test (SPSS v. 16; SPSS Inc.). Results The distribution of transformed FT4 and TSH values in the reference group was not found by Kolmogorov– Smirnov testing to differ from a normal gaussian distribution. The separate 95% univariate reference intervals obtained after reversal of the transformation were 0.51–3.48 mIU/L for TSH and 9.8 –16.9 pmol/L for FT4 (Fig. 1A). The circumference of the bivariate 95% reference region is given by Eq. 1, with the value 5.99 assigned to D2 (distance D ⫽ 2.45). For each FT4 value, a pair of TSH values was obtained, representing the TSH reference interval corresponding to that particular FT4 value. Thus, for an FT4 value of 13.1 pmol/L, the lower and upper limits for TSH are 0.36 and 4.28 mU/L, respectively. Conversely, if TSH is 1.45, the range for FT4 is 9.0 –18.0 pmol/L. Furthermore, if FT4 is 9 pmol/L, the reference interval for TSH would be restricted to a single value of 1.45 mU/L. When using the separate univariate reference intervals for TSH and FT4, 10.8% (n ⫽ 94) of data points in the reference group fall outside the area in which both criteria are met; by contrast, with the bivariate composite approach, 5.2% (n ⫽ 45) fall outside the constructed combined reference region. Both numbers fall close to the expected values of 9.75% and 5% (z-test for population proportions). The same holds after further subdivision into subclinical hypo- and hyperthyroidism (see Table 1): separate limits give 2.4% and 2.8% (expected 2.4% for both), and the bivariate composite limit yields 1.2% and 0.8% (expected 1.1% for both). Fig. 2, A and B, shows the data from the group of healthy older (⬎40 years) individuals and healthy individuals with positive anti-TPO superimposed on the reference grid. Table 1 presents the observed frequencies of subclinical hypo- and hyperthyroidism as assessed by the composite and conventional methods. In many instances, the differences between observed frequencies were significantly greater than expected from inclusion of a larger percentage of normal values (2.4% vs 1.1%) alone. This observation was particularly apparent in the frequency of subclinical hypothyroidism in the anti-TPO positive group. The estimate of subclinical hypothyroidism according to the conventional approach was almost 24%, whereas the composite approach indicated only 10%. In the elderly anti-TPO– negative group, the observed frequency of subclinical hypothyroidism was slightly higher than in the referClinical Chemistry 55:11 (2009) 2021
Table 1. Observed and expected incidence rates in subclinical hyper- and hypothyroid ranges. Composite Subclinical hypothyroid
Expected incidence
0.0108
Conventional
Subclinical hyperthyroid
Subclinical hypothyroid
0.0108
0.0238
Subclinical hyperthyroid
n
0.0238
Observed incidence
a b
Reference
0.0115
0.00804
0.0241
0.0276
⬎40, aTPO⫺
0.0153a,b
0.0337a
0.0331a,b
0.0731a,b
3651
871
aTPO⫹
0.101a,b
0.0281a
0.237a,b
0.0506a,b
712
Significant difference (z-test for population proportions) with reference and expected. Significant difference between aTPO⫹ and ⬎40, aTPO⫺.
ence group if the composite limits were used (1.5% vs 1.2%), but the difference was somewhat more pronounced (3.3% vs 2.4%) when applying separate limits. For subclinical hyperthyroidism, the composite approach gave frequencies for the elderly anti-TPO– negative and anti-TPO–positive groups that were higher than expected (3.4% and 2.8% vs 0.8%) on the basis of the reference group, but not significantly different from each other. For the conventional method, frequencies for the elderly anti-TPO–negative and anti-TPO–positive groups were 7.3% and 5.1%, respectively, vs 2.8%, of which the former is significantly higher than the latter, whereas both are higher than in the composite approach. Discussion Plots of TSH vs FT4 values from larger data sets show that the shape of the density distribution of points is egg-like (Fig. 1A) rather than rectangular. Whereas FT4 approximates a normal distribution, the distribution of TSH is skewed, but approximates a normal distribution after log transformation. Fine-tuning of the transformation by correcting for residual skewness, applying log transformation for FT4 as well with subsequent normalization, results in a circular-shaped 2-dimensional diagram for healthy individuals without any thyroid medication or sign of disease. This is a reflection that, if the negative feedback system is at equilibrium, TSH and FT4 combine randomly among individuals. A negative correlation will be observed if there is a tendency of thyroid autonomy within the data set, in the form of either thyroid hyperactivity or failure. Conversely, a trend toward pituitary autonomy would lead to a positive correlation. If TSH and FT4 do correlate, the density distribution will tend toward an elliptic shape with Y ⫽ X and Y ⫽ ⫺X as main axes. A trivariate [TSH, FT4 index, free triiodothyronine (FT3) index] probability density distribution was presented 2022 Clinical Chemistry 55:11 (2009)
by Kagedal et al. (8 ) for 3885 women 39 – 60 years of age. In this group, negative correlations were observed between logTSH and both FT4 and FT3 indices and a positive correlation between FT4 and FT3 indices. This resulted in an ellipsoidal frequency distribution and reference limit. We also observed a negative correlation between FT4 and logTSH for individuals ⬎40 years old, which was the reason to exclude those from the reference group since our aim was to obtain a reference group that is suitable for detecting subclinical thyroid disease. Although the univariate probability density distributions of FT4 and TSH are mutually independent, the bivariate density distribution depends on both FT4 and TSH, and therefore the reference limits derived from the bivariate distribution for each parameter are mutually dependent. So the derived reference limits for FT4 are further apart if TSH values tend toward their average, than with TSH values toward the extremes, and vice versa. Classification of thyroid conditions on the basis of a logTSH/FT4 diagram has been shown before (2 ). Although the authors indicated in their graph that the normal reference region was elliptical (and would be circular after normalization) rather than rectangular, this aspect was not further explored. The squared distance of each data point to the center of the distribution equals the sum of squared normalized TSH and FT4 values. As a consequence of normalization, TSH and FT4 each have a mean of 0 with variance 1. Thus, each squared transformed and normalized TSH and FT4 value is an estimate of this variance. Therefore, the sum of squared TSH and FT4 will be 2 distributed with 2 degrees of freedom. The 95% reference interval corresponds to a 2 value of 5.99, so it encloses a circle with a radius of 2.45, which is the square root of 5.99. Indeed, 94.8% of all data from the reference group fall within this region; in contrast, 89.2% fall within the separately applied limits, meaning that 5% of healthy individuals would be inappro-
Composite Reference Interval for TSH and FT4
Fig. 2. Normalized, transformed TSH and FT4 values, with conventional 1.96 SD limits (dotted lines) and the composite limits (solid lines) as based on the reference group. (A), Healthy, anti-TPO–negative individuals older than 40 years and (B), the healthy, anti-TPO–positive group of participants.
priately classified as abnormal with the latter approach. Conversely, with the composite approach, the number of healthy individuals not requiring further investigation increases by 5%.
Subdivision of the area outside the reference interval (see Fig. 1B) into sections corresponding to various thyroid conditions is intuitive when using conventional separate 95% limits at ⫾1.96 SD. With the circular reference area it is somewhat less obvious. The dividing lines must intersect at ⫾1.73 SD, by which the corner sections will correspond to regions where not only TSH and FT4 combined fall outside the reference interval, but also separately exceed the same limit. This limit is defined by the 4 points on the circle where the absolute values of normalized TSH and FT4 are equal. This is at 2.45/公2 ⫽ 1.73 SD. For the reference population, the difference between conventional and bivariate composite classifications is almost exclusively located in the sections corresponding to the 4 possible combinations normal/ abnormal, 2 of which represent subclinical hyper- and hypothyroidism. Plotting the data from the healthy anti-TPO–negative participants older than 40 in the grid (Fig. 2, A and B), it appears that the data are shifted downward and to the right with respect to the reference group. This is a corollary of observations we made earlier (5 ). Interpretation of this shift depends on whether the composite reference limits or conventional reference limits are used. Table 1 shows that there was a slight but significant increase in frequency of subclinical hypothyroidism compared to the reference group, but the difference tended to be more pronounced with conventional classification. This was also true when considering the data from the anti-TPO–positive participants (Fig. 2B and Table 1). The composite approach shows clearly higher incidence of subclinical hypothyroidism with respect to both the older anti-TPO negative and reference groups, but no difference with the former for subclinical hyperthyroidism. Thus, the composite approach does not indicate a relation between anti-TPO status and the incidence of subclinical hyperthyroidism, whereas the conventional approach does. The higher incidence of subclinical hyperthyroidism compared to the younger reference group suggests an age effect instead. Because the purpose of this report is presentation of the composite reference interval approach, the underlying causes for the age and anti-TPO–related differences in probability distributions from the reference group in these individuals are not discussed here. However, since it is questionable whether all patients classified as having subclinical thyroid disease by the usual definition benefit from treatment (3 ), the approach that is based on a composite reference region appears to be more conservative and thus may help to prevent unnecessary treatment. A prospective study, randomly assigning those classified as having subclinical disease Clinical Chemistry 55:11 (2009) 2023
by univariate criteria but not by the bivariate approach to treatment or no treatment, will be required to test this supposition. Practical Considerations Because of assay method differences, each laboratory should establish its own composite reference interval, along the guidelines given in the Appendix. Patient results must be substituted into the resulting formula for the distance to the center of the distribution as a “thyroid balance index.” If the result is ⬍2.45, there should be no need for reporting separate TSH and FT4 values, although many physicians still may want to have these values. For example, a TSH value of 4.2 mU/L exceeds the 1.96 SD limit, but if FT4 is close to the average of 13.1 pmol/L the data pair remains within the composite overall 95% reference interval. For ease of use to the physician, the calculation can be performed in the laboratory instead of supplying assay results with the formula. The physician will then receive a report with TSH and FT4 results supplemented with either “Thyroid balance index within the reference interval” or “Thyroid balance index outside the reference interval.” An alternative could be to provide a diagram, prepared by the laboratory, similar to Fig. 1A, showing only the egg-shaped profile and grid, and plotting the reported TSH and FT4 results to see if the data pair falls within the reference region, and if not, what clinical category is likely to apply. If “screening by TSH” as a first step is common practice, the warning limits for ordering FT4 may be kept at the univariate P2.5 and P97.5 for TSH. If these warning limits are exceeded, subsequent FT4 measurement will reveal if the same holds with regard to the bivariate reference limit. Such a strategy limits the number of unnecessary FT4 measurements and does not impair diagnostic sensitivity compared to a bivariate approach. In conclusion, the proposed bivariate reference interval for TSH and FT4 may lead to a better definition of subclinical thyroid conditions with fewer false positives. Its implementation can be readily included in existing diagnostic strategies.
Appendix TRANSFORMATION OF DATA
In Excel, to each tabulated TSH and FT4 value the same offset (9 ) was added and the logarithm of the sum was calculated. The skewness of the distribution of transformed values of the healthy group was expressed as (mean ⫺ median)/SD, i.e., Pearson’s skewness index divided by 3 (7 ), and the value of the offset was obtained by adjusting until a skewness index value of ⬍0.001 times its original value had been reached. Finally, from each transformed value the mean was subtracted and the difference was divided by the SD to obtain values following a standard normal distribution. This was confirmed by Kolmogorov–Smirnov testing. Symmetry was further ascertained by comparing the numbers of individuals exceeding ⫾1.96 SD limits by the z-test for population proportions. REMOVAL OF OUTLIERS
An outlier was defined as a value for which the probability not to be encountered at all in a sample of the same size as the population was 50%, which means that the probability of finding at least 1 observation exceeding this value was 50% or less. For a sample size of 4523, this holds for values of P ⬍ 0.00015 or ⬎3.61 SD from the mean, according to the following formula: P ⫽ 1 ⫺ 0.5 共 1/4523 兲 ⫽ 0.000153. Because the ⫺3.61 interval for TSH extends beyond the detection limit of the assay, it seemed sensible to exclude all values below this limit.
Author Contributions: All authors confirmed they have contributed to the intellectual content of this paper and have met the following 3 requirements: (a) significant contributions to the conception and design, acquisition of data, or analysis and interpretation of data; (b) drafting or revising the article for intellectual content; and (c) final approval of the published article. Authors’ Disclosures of Potential Conflicts of Interest: No authors declared any potential conflicts of interest. Role of Sponsor: The funding organizations played no role in the design of study, choice of enrolled patients, review and interpretation of data, or preparation or approval of manuscript.
References 1. Kratzsch J, Fiedler GM, Leichtle A, Bruegel M, Buchbinder S, Otto L, et al. New reference intervals for thyrotropin and thyroid hormones based on National Academy of Clinical Biochemistry criteria and regular ultrasonography of the thyroid. Clin Chem 2005;51:1480 – 6. 2. Demers LM, Spencer CA, eds. Laboratory medicine practice guidelines: laboratory support for the diagnosis and monitoring of thyroid disease.
2024 Clinical Chemistry 55:11 (2009)
Washington (DC): National Academy of Clinical Biochemistry; 2002. www.nacb.org (Accessed July 2009). 3. Biondi B, Cooper DS. The clinical significance of subclinical thyroid dysfunction. Endocr Rev 2008; 29:76 –131. 4. Hansen PS, Brix TH, Sorensen TI, Kyvik KO, Hegedus L. Major genetic influence on the regulation of the pituitary-thyroid axis: a study of
healthy Danish twins. J Clin Endocrinol Metab 2004;89:1181–7. 5. Hoogendoorn EH, Hermus AR, de Vegt F, Ross HA, Verbeek AL, Kiemeney A, et al. Thyroid function and prevalence of anti-thyroperoxidase antibodies in a population with borderline sufficient iodine intake: influences of age and sex. Clin Chem 2006;52:104 –11. 6. Boyd JC. Reference regions in two or more di-
Composite Reference Interval for TSH and FT4
mensions. Clin Chem Lab Med 2004;42: 739 – 46. 7. Sheskin DJ. Handbook of parametric and nonparametric statistical procedures. 4th ed. Boca Raton (FL): Chapman & Hall/CRC; 2007.
8. Kagedal B, Sandstrom A, Tibbling G. Determination of a trivariate reference region for free thyroxine index, free triiodothyronine index, and thyrotropin from results obtained in a health survey
of middle-aged women. Clin Chem 1976;24: 1744 –50. 9. Sachs L. Angewandte statistik. 6th ed. New York: Springer; 1984.
Clinical Chemistry 55:11 (2009) 2025