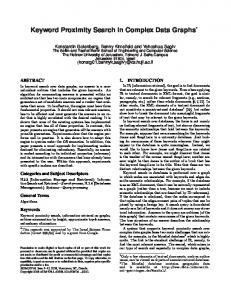
Jan 23, 1996 - Figure 5 shows the behavior of the qualitative magnitudes of the amounts of glucose and insulin. We can see that they oscillate in tandem, with ...
Comprehending Complex Behavior Graphs through Abstraction� Richard S. Mallory Bruce W. Porter Benjamin J. Kuipers
Department of Computer Sciences The University of Texas at Austin, Austin TX 78712
fmallory,
g
porter, kuipers @cs.utexas.edu
January 23, 1996
Abstract
Qualitative simulation is often a useful tool for studying the behavior of physical systems and has promise for providing automatic explanations of their behavior. However, in some cases it can overwhelm with detail. Behavior graphs with hundreds or thousands of states may obscure the basic patterns of behavior that a qualitative model was intended to explore. This paper describes an approach to comprehending complex behavior graphs by abstracting the behavior graph according to user-speci ed criteria that are simple and natural to provide. We present properties that an abstraction should meet to be faithful to the original behavior graph, prove necessary and su�cient operational conditions for an abstraction method to maintain these properties, and present a simple algorithm that incorporates these conditions and works for any behavior graph. We demonstrate on several externally-provided problems that our method can greatly simplify complex behavior graphs in number of states and behaviors while remaining faithful to the original behavior graph. It enables simple graphical output that can reveal underlying patterns of behavior that have not been apparent with previous methods, and shows promise for expanding the utility of qualitative reasoning for generating explanations.
1 Introduction Qualitative simulation has proved a useful tool for studying the behavior of dynamic systems. Given a di�erential equation model of a system, state-based qualitative simulation produces a set of states that the system will pass through over time. See generally [Forbus 84, deKleer and Brown 84, Kuipers 86, Kuipers 94, Weld and deKleer 90]. Qualitative simulation is distinctive in that is uses incomplete knowledge of the equations and variables involved. Functional relationships may be speci ed, for example, simply as being monotonic and variable magnitudes are computed only as being at or between speci ed landmark values. This degree of imprecision is often useful when a sketch of a system's behavior is su�cient or, as is often the case in the life sciences, more precise information is often not available. However, imprecision in the input leads to ambiguity in the results, and the behavior of a system | its trajectory through a sequence of states | can branch if two or more states are possible successors This research has taken place at the Arti cial Intelligence Laboratory at the University of Texas at Austin. Support for this research is provided by a grant from Digital Equipment Corporation and a contract from the Air Force O�ce of Scienti c Research (F49620-93-1-0239). �
1
of some state. Although a handful of branches in the behaviors may be comprehensible, state-based qualitative models of modest size can produce behaviors containing hundreds or thousands of states. This degree of branching usually renders the results incomprehensible and obscures the relationships that the user sought to explore. Thus appropriate methods for achieving abstraction and summary are required to reveal the fundamental characteristics of the behaviors that the user may most wish to observe. They are also important to providing succinct descriptions and explanations from complex qualitative simulations. Quantitative information can sometimes be used to reduce or eliminate branching. However, quantitative information may be di�cult to nd or inconvenient to invent and its use may inadvertently eliminate some branching in behaviors that the user would like to reveal. And in domains such as the life sciences, numeric information is unavailable or too incomplete to be useful. Our work in particular has been pursued in the context of a large knowledge base on plant physiology [Porter 88, Lester 94], where many useful conclusions can be drawn without quantitative information [Rickel 92, Rickel 94]. Thus our simulations, like many others [Ironi 94], are purely qualitative. The complexity of qualitative simulations often derives from the fact that qualitative states maintain a variety of distinctions that are uninteresting, and a number of methods have been developed to eliminate these distinctions through abstractions. For Qsim simulations [Kuipers 86, Kuipers 94], these methods include chatter elimination [Clancy 93], behavior aggregation [Fouche 91, Clancy 93], and model decomposition [Clancy 94]. Each identi es and reduces or eliminates a speci c class of uninteresting distinctions. These methods make important or essential contributions to the tractability of qualitative simulation. Chatter elimination, in particular, is essential for many Qsim simulations. However, even with these techniques and others a qualitative model of modest size may still produce an incomprehensibly large behavior graph. Thus in many cases there is still much to be done to make the results of simulation clear to the human user. This paper approaches behavior abstraction from a di�erent perspective. Other approaches have identi ed particular sources of qualitative distinctions likely to be uninteresting in any context and abstracted them away. In contrast, our algorithm abstracts away all distinctions except those selected by the user to be preserved in an abstracted behavior graph. As will be clear from an example, the criteria for such distinctions are natural and simple to supply. Typically, the user will want to build several di�erent abstractions that highlight the behavior of selected individual variables or pairs of variables. The simulation must rst be completed,1 so other techniques that render simulation tractable are essential for our algorithm to have results to work on. Our algorithm then builds an abstract behavior graph by abstracting together adjacent states2 that, by the user's criteria, need not be distinguished. We have found that this approach to abstraction can greatly simplify a complex behavior graph. In the example we present in detail, it abstracts a behavior graph with 188 states and 63 behaviors to ones with nine states and three or ve behaviors. An abstraction is provably faithful to the original behavior graph in that every path through the abstract graph corresponds to some path through the original graph and vice versa. The abstractions are capable of revealing overall patterns in the behavior that are often of interest to users but have been di�cult The algorithm is currently implemented as a post processor. When the simulation can be completed with current methods and several abstractions are desired, post processing is most appropriate | the behavior graph created by simulation can be abstracted in any number of di�erent ways. However, if the simulation cannot be completed, abstraction during simulation coupled with the disposal of unneeded states might be useful. 2 With some important quali cations developed below, two states are adjacent for our purposes if one is the successor of the other or if they share common predecessors or successors in the behavior graph. 1
2
to discern with previous methods and complex behavior graphs. In addition, high-level abstractions such as these are essential to automatically providing concise, natural language explanations from qualitative models, which is our ultimate objective. In the following sections, we discuss the following:
Section 2 The utility of behavior abstraction, including an example and the nature of the criteria
required from the user. Section 3 The details of the abstraction algorithm, including how the user's criteria are employed, the relationships between the original states and the abstract states that de ne an abstraction as faithful to the original, the proof of operational conditions that assure faithfulness, and the control structure of the algorithm. Section 4 Future research, including ongoing research on how to automatically derive the abstraction criteria now required of the user, by analysis of the qualitative model. Section 5 Evaluation and conclusions.
2 The Utility of Behavior Abstraction For our purposes, a good abstraction will reveal important underlying patterns in the behavior graph. One may at best suspect what these patterns may be | else why run the simulation | and our algorithm does not look for such patterns directly. Instead, it relies on the user to provide criteria that describe the information to be presented in an abstraction. These criteria can be quite simple and still reveal much about the behaviors. The utility of this approach is easier to see if we start with an example and then generalize the results. We will use the model of the glucose-insulin regulatory system in the human body presented in Figure 1. See [Ironi 94, Clancy 94]. The model contains the amounts of glucose and of insulin in the blood and the interactions between them that a�ect their respective rates of production and elimination. The model was simulated with Qsim by perturbing it from an equilibrium state so that glucose was above the equilibrium value but decreasing and insulin was at the equilibrium value but increasing. Chatter elimination and other techniques were used to reduce the number of states. The resulting behavior graph contained 188 states in 63 behaviors with a large number of cycles and four identical nal states. See Figure 2. The values of variables can be graphed for individual behaviors, but with this many behaviors it is di�cult to get a global view of what is happening. However, it is possible to ask some focused questions about the behaviors. It is often the case that the behavior of some variables is of more interest than that of others. In the glucose-insulin model, the user had in mind studying primarily what happens to the amounts of insulin and glucose. We might ask, for example, for a graph of the behavior of just the amount of glucose, or just the amount of insulin. These graphs may be derived from the behavior graph for the whole model by merging adjacent states that do not di�er in the qualitative value of the variable of interest. We formalize this process in the next section. In particular, the question of when states can be considered \adjacent" turns out to be rather tedious and is presented in detail in Theorem 1, but roughly speaking two states are adjacent for our purposes if one is the successor of the other or if they share common immediate predecessors or immediate successors in the behavior graph. The results of building these abstractions are shown in Figures 3 and 4. The graphs in these gures and in Figure 5 were produced automatically by our program. 3
effect of glucose on glucose production
effect of glucose on glucose elimination
+
+
rate of glucose production S-
Q+
effect of insulin on glucose production
+ d/dt glucose
+
rate of glucose elimination
+ rate of insulin production
-
+ S+
D/DT
effect of insulin on glucose elimination
rate of insulin elimination -
d/dt insulin
S-
S+
Q+
D/DT
amount of glucose
amount of insulin
Figure 1: Model of the glucose-insulin regulatory system in the human body. Arrows indicate constraints between variables. D/DT indicates a derivative constraint, Q+ and Q- indicate monotonic functional constraints, S+ and S- indicate functional constraints that are monotonic in the center and at on the ends, and + and ? indicate that the variables at the tails of the arrows sum (with the indicated sign) to the variable at the head of the arrows.
Figure 2: Behavior graph for the glucose-insulin model in the previous gure, perturbed from an equilibrium state as mentioned in the text. 4
A-5: Inc Norm A-1: Dec Norm
A-2: Dec Low
A-3: Std Low
A-6: Inc High
A-4: Inc Low
A-8: Std Norm
A-0: Dec High
A-7: Std High
Figure 3: Behavior of the amount of glucose in the glucose-insulin model. The diamond is the initial state and the double circle is the nal state. Arrows indicate successor relations between states. The items after each state number are its label | the qualitative magnitude of the amount of glucose and its qualitative direction of change. A magnitude of Norm means it is at its eventual equilibrium value and High or Low mean it is above or below that value, respectively. Directions of change Inc, Dec, or Std mean increasing, decreasing, and steady, respectively.
A-10: Inc High
A-9: Inc Norm
A-11: Std High
A-12: Dec High
A-13: Dec Norm
A-14: Dec Low
A-15: Std Low
A-17: Std Norm
A-16: Inc Low
Figure 4: Behavior of the amount of insulin in the glucose-insulin model. Conventions are the same as in the previous gure.
A-19: High High
A-20: Norm High
A-21: Low High
A-26: Norm Norm A-22: Low Norm
A-18: High Norm
A-23: Low Low
A-24: Norm Low
A-25: High Low
Figure 5: Behaviors of the magnitudes of both glucose and insulin in the glucose-insulin model. The rst item after the state number is the qualitative magnigude of the amount of glucose and the second item is the qualitative magnitude of the amount of insulin. 5
insulin = low
insulin = norm
insulin = high
glucose = high
A-25
A-18
A-19
glucose = norm
A-24
A-26
A-20
glucose = low
A-23
A-22
A-21
Figure 6: Phase portrait of the magnitudes of both glucose and insulin in the glucose-insulin model, derived (manually) from the algorithm output in the previous gure. As we prove in the next section, our algorithm assures that each of these abstract graphs is faithful to the original behavior graph in the following sense: Every path through the abstract graph corresponds to at least one path through the original graph and each path through the original graph is represented by a path through the abstract graph. These behaviors are also far simpler than the behavior of the whole model shown in Figure 2. In particular, they are simple enough that there is room to present in the graph of states the information that characterizes each state | namely the qualitative value of the variable in that state, which comprises its qualitative magnitude and direction of change. From this information and the successor relations between states, an understanding of the behavior of each variable can be gleaned. We can see by inspection of Figure 3 that the amount of glucose starts in the initial state (state A-0 in Figure 3) above its equilibrium value (its magnitude in state A-0 is High), and returns to its equilibrium value (Norm) either directly (A-0 ! A-8) or after some number of half cycles of oscillation (A-0 ! A-1 ! A-2 ! A-3 ! A-4, during which it moves from high to low and back toward normal, and A-4 ! A-5 ! A-6 ! A-7 ! A-0, during which it moves from low to high and back toward normal). Similarly, Figure 4 shows that the amount of insulin departs from its equilibrium value, also as speci ed in the initial state, and then returns to it after some number of half cycles of oscillation. We can also see how the behaviors of these two variables are related. Figure 5 shows the behavior of the qualitative magnitudes of the amounts of glucose and insulin. We can see that they oscillate in tandem, with the amount of glucose leading the amount of insulin by less than half a cycle, and return to equilibrium at the same time. This information permits us to (manually) construct a phase portrait of these two amounts, which is shown in Figure 6.3 In each case, the amount of information required of the user is modest. For Figure 3, the program was instructed to label each state in the original simulation with the magnitude of the amount of glucose, in the terms shown in the gure (that is, whether it was above, at, or below its nal equilibrium value), and the direction of change of the amount of glucose. All adjacent states with the same label (magnitude and direction) could then be merged together into a single abstract state. What is primarily required of the user is focus | a point of view on what is important to glean from the simulation. We believe that users will typically have a view as to what variables and relationships are most important to understand in a complex simulation and thus will be able to de ne appropriate abstractions. Since abstractions are simple to specify and the resulting graphs are produced automatically, several abstractions may be run to get a proper overview of the simulation. See [Lee 93] for an extensive discussion of phase portraits and an algorithm for computing them automatically for certain classes of models. 3
6
These abstractions also provide the kind of overall view of a simulation that is required for the automatic generation of explanations. Our ultimate objective has been to provide natural language explanations of qualitative behaviors to users knowledgeable in the domain of the model but familiar only with the fundamentals of qualitative reasoning. One element of such explanations is the kind of high-level summaries that we gave above in the text, describing the conclusions that can be drawn from the behavior abstractions in Figures 3, 4, and 5. We believe that a good explanation will provide such summary descriptions of a simulation's behaviors, and providing the behavior abstractions on which such summaries can be based is an essential rst step. We discuss our research on explanation further in section 5. In summary, then, behavior abstraction employing user-speci ed criteria has permitted us to obtain an overview of the behavior of the system that has been di�cult to achieve with other tools on a behavior graph of this complexity. In the following section we will formalize the abstraction process, including what it means for an abstraction to be faithful to the original behaviors.
3 Details of the Abstraction Algorithm The algorithm requires labeling each state to re ect the distinctions of interest to the user and then grouping appropriate sets of adjacent states with the same label into abstract states, which are themselves linked with successor edges to form the abstract behavior. Labeling has been touched on above and will be formalized below, and nding abstract successors is straightforward. Only the matter of determining which states to collect in an abstract state is subtle. In the following, we will call the states produced by simulation the \base" states, to distinguish them from the abstract states. States are labeled using one or more methods supplied by the user. A classi cation method assigns a classi cation to each state in the simulation. By doing so, it de nes a set of distinctions among states | namely distinct classi cations | that are to be preserved in the abstraction process. The abstractions behind Figures 3, 4, and 5 each had two classi cation methods. For Figure 3, the rst method classi ed each state by the qualitative magnitude of the amount of glucose in that state, with a simpli cation of the magnitude to \high", \norm", or \low", depending on whether it was above, at, or below the nal equilibrium value. The second method classi ed each state by the qualitative direction of change of the amount of glucose. The two together classify each state by the qualitative value (magnitude and direction of change) of the amount of glucose, with a simpli cation of the magnitude. For Figure 4, the method was identical except that it referred to the amount of insulin in the state. For Figure 5, the rst method classi ed each state by the qualitative magnitude of the amount of glucose (as simpli ed above) and the second method by the qualitative magnitude of the amount of insulin. In general, given a set of labeling methods, the program nds each method's classi cation for each state and assigns the state a label which is an ordered list of those classi cations. All that is required of the user here is a set of routines that, given any base state, return the desired classi cations. Labeling is done only once during the abstraction process, so its time complexity does not interact with that of the abstraction algorithm.
3.1 Faithful abstraction An abstraction of the behavior graph will group appropriate sets of base states into abstract states and join two abstract states with a successor edge when there is a successor edge between two 7
of their respective base states. The question is, What groupings of base states are appropriate? Clearly all the base states in one abstract state should have the same label since we wish the abstraction to preserve di�erences re ected in di�erent labels. Beyond that, we propose that an abstract behavior graph should exhibit both of the following properties in order to be a faithful abstraction of the base graph:
Completeness. Any path in the base graph should correspond to some path in the abstract graph
(perhaps a single node). That is, the abstract graph should not imply the absence of any paths extant in the base graph. Soundness. Any path in the abstract graph should correspond to at least one path in the base graph. That is, the abstract graph should not imply the existence of paths absent from the base graph.
We will build our formalization of abstraction on these properties and return later to the notion of adjacency, roughly de ned above. We can build the abstract graph by starting with a copy of the base graph and its labels, which exhibits both properties, and applying transformations that preserve these properties. Completeness will be preserved by transformations that merge two abstract states while retaining all the successor edges except those between the merged states. Speci cally, a transformation will replace two states Si and Sj by a new state Sk , delete any edges between Si and Sj (Si ! Sj or Sj ! Si ), and replace Si or Sj with Sk as the head or tail of any other edges incoming to or outgoing from Si or Sj .
3.2 Preserving soundness The question then is how to preserve soundness. Since the graphs before and after merger of two states Si and Sj are identical except for the replacement of Si and Sj by Sk and the edge changes mentioned above, the issue is whether there is some path Sa ! Sk ! Sb in the merged graph with no corresponding path Sa ! Si ! Sb , Sa ! Sj ! Sb , Sa ! Si ! Sj ! Sb, or Sa ! Sj ! Si ! Sb in the unmerged graph. A merger is sound when for every such path Sa ! Sk ! Sb in the merged graph there is a corresponding path in the unmerged graph. The following theorem states the conditions under which the merger of two states is sound. Following the theorem we discuss how its conditions relate to the rough notion of adjacency that we have mentioned previously. Theorem 1. Given a directed graph of states and edges as above, the merger of two states Si and Sj into one state Sk is sound if and only if the following conditions hold. (succs(Si) and preds(Si) denote the sets of immediate successor and predecessor states of state Si , respectively, and `n' denotes set di�erence.) 1. If Si ! Sj , then at least one of the following conditions must hold (the case where Sj ! Si is analogous): (a) Sj ! Si, (b) succs(Si ) n fSj g � succs(Sj ), or (c) preds(Sj ) n fSig � preds(Si ) 2. If Si 6! Sj and Sj 6! Si , then at least one of the following conditions must hold: 8
(a) (b) (c) (d)
preds(Si) = preds(Sj ), succs(Si ) = succs(Sj ), preds(Si) � preds(Sj ) and succs(Si ) � succs(Sj ), or preds(Sj ) � preds(Si ) and succs(Sj ) � succs(Si ).
Proof. See Appendix A. The proof can be sketched brie y as follows. Each of the two cases is proved separately. The conditions for each are negated and the existence of a path in the merged states with no corresponding path in the unmerged states under these circumstances is demonstrated; this shows the necessity of the conditions. The su�ciency of each condition is then shown by assuming the existence of such a path and showing a contradiction with each condition.
3.3 Interpreting soundness Adjacency. The conditions in the theorem break down into two cases, depending on whether or
not there is a successor edge joining the two states. Each set has an intuitive interpretation. In case 1, when one state is the successor of the other, the states would seem to be candidates for merger because the simulation has not changed its state in terms of the distinctions of interest. The conditions in the theorem only exclude this merger if it is unsound. Case 2 is clearer if we start with a simpli cation. When two states share a predecessor, the two paths from the predecessor to one state or to the other do not di�er in terms of the distinctions we have speci ed. They may be thought of as parallel paths to the same abstract state and thus be represented by a single path to one merged state. Similar reasoning applies to a shared successor and to shared sets of predecessors and/or successors. The conditions in the theorem exclude such mergers only when they are unsound. We have used the term \adjacency" in previous sections as a rough summary for these two sets of conditions. Final states. The soundness property does not guarantee that if an abstract state is non- nal (i.e., it has successors), then all the base states abstracted into it are also non- nal. That is, a non- nal abstract state may group together both nal and non- nal base states. In this case, a path in the base graph entering a nal state has a corresponding path in the abstract graph | one that stops at the corresponding abstract state. Also, a path in the abstract graph passing through a state grouping both nal and non- nal base states has a corresponding path in the base states | it simply will not include any of the nal base states. An abstract state that groups both nal and non- nal base states may be confusing, as it is usually important to distinguish nal and non- nal states. However, this is easily remedied by including with other classi cation methods one that labels each base state with \ nal" or \non nal" as appropriate. Other distinctions may be included in this label, such as whether the state is quiescent or un nished (meaning that the simulation was terminated before nishing and the state's successors were not computed).
3.4 The algorithm The algorithm for constructing abstract graphs works as follows. It creates the initial abstract graph as a copy of the base graph and its labels and then repeatedly makes sound mergers in the behavior graph until no more opportunities for sound mergers can be found. Speci cally, it iterates over each state Si in the abstract graph doing the following: 9
� It examines each successor Sj of Si to determine whether the pair can be soundly merged
under the conditions in part 1 of theorem 1 and if so, performs the merger. � It examines each pair of successors of Si to determine whether they can be merged under the conditions in part 2 of theorem 1 and if so, performs the merger. � It examines each pair of predecessors of Si to determine whether they can be merged under the conditions in part 2 of theorem 1 and if so, performs the merger.
All the conditions to be checked in each of these steps are local to the states under consideration (they involve no search) so they are polynomial in the number of edges and states in the graph. The iteration itself could no doubt be more e�cient, but it is also polynomial in the number of states and edges in the graph. Finally, the iteration over all states is repeated, with no particular ordering of states, until no more mergers can be performed. Since each merger reduces the number of states in the graph, this outer iteration is bounded by the number of states in the base graph. For the glucose-insulin example, the algorithm runs in a very few seconds on a DEC Alpha.
4 Evaluation We have applied our behavior abstraction algorithm to a several Qsim simulations with behavior graphs ranging in complexity from a relatively modest graphs of 36 states and 10 behaviors to a very large graph that remained un nished at 3874 states and more than 1200 behaviors. See Table 1. Our algorithm was not designed for any of these simulations | they were selected after its design and implementation simply for having fairly or very large behavior graphs. In each case we constructed abstractions similar to those we presented above for the glucose-insulin model by abstracting the qualitative values of each variable whose derivative variable was also computed in the simulation, and by occasionally abstracting the qualitative magnitudes of pairs of such variables. In each case, the behavior graph was signi cantly simpli ed, as Table 1 shows. The reduction factor in the numbers of states and behaviors was larger for larger graphs, as might be expected. Of course, the number of states and behaviors can always be reduced further by abstracting further and retaining fewer distinctions among states, and thus presenting less information in the abstraction. In the limit, the behavior graph can be reduced to a single state which preserves little or no information. We have attempted to construct abstractions that presented the essential behaviors of the variables examined with a comprehensible amount of detail, preserving essential distinctions and ignoring others. Sometimes two or three trials were required before an appropriate abstraction for a particular variable was devised. But in all cases we were able with modest e�ort to construct abstract behavior graphs that appeared to present useful and comprehensible summaries of the behavior of the chosen variables. Much less e�ort was needed than might be required to examine each behavior in the original graph and determine a probable summary by hand, and the guarantee of faithfulness assures that no distinctions re ected in the abstraction classi cation methods have been missed. We therefore feel con dent in claiming that our method of behavior abstraction can be a useful tool in understanding large qualitative simulations.
5 Current and Future Research Our ultimate objective has been to provide natural language explanations of qualitative behaviors. One element of such explanations is the kind of high-level summaries that we gave above in the text, 10
Model Glucose-Insulin1 Controlled Tank2 RCS3 CSTR | Ti+4 CSTR | Cai+5
Base Graph Abstract Graphs States Behaviors Abstractions States Behaviors 188 63 3 9 3{5 101 49 2 7{12 2{5 53 33 4 5{7 3{5 36 10 4 4{13 1{4 3874 >1200 3 6{60 1{25
Table 1: Results of applying behavior abstraction to the behavior graphs of ve di�erent models. The \Abstractions" column shows the number of abstract graphs constructed. The \States" and \Behaviors" columns for abstract graphs show the range of the numbers of states and behaviors for these abstractions, respectively. a Discussed in the b An unpublished
text in section 2. model of the uid level in a controlled tank. The simulation was un nished due to memory requirements of Q2, a quantitative simulation technique that augments Qsim. c A model of the reaction control system for the space shuttle. See [Kay 92], simulation function rcs-two-legs-leaks-noheline-lopull. d A model of a continuously stirred chemical tank reactor simulating an increase in the temperature of a reactant entering the reactor. See [Dalle Molle 89], simulation function cstr-a->b-Ti+. e A model of a continuously stirred chemical tank reactor simulating an increase in the concentration in a reactant entering the reactor. See [Dalle Molle 89], simulation function cstr-a->b-cai+. The simulation was un nished due to memory requirements. In addition, not all of the model variables mentioned in the text were examined.
describing the conclusions that can be drawn from the behavior abstractions in the glucose-insulin example. To provide such summaries, we are developing a hierarchy of methods for describing and explaining qualitative behaviors. Behavior abstraction is the rst of these. Two others which build on it are described below. Automating abstraction. Our behavior abstraction algorithm requires a set of classi cation methods from the user. We are developing other methods to provide this information automatically in some cases. The rst problem is to select the variables of primary interest. From the perspective of qualitative models as sets of di�erential equations, the variables of primary interest are often those whose derivatives are computed in the model. If this is the case, then a useful summary may be achieved from abstractions of the qualitative values of each such variable, and additional abstractions of the qualitative magnitudes of pairs of such variables, as was done in analyzing all the examples presented above. In some cases, the variables of real interest may be functionally related to the variables whose derivatives are computed, and the identity of these variables might be determined with the help of information from the domain of the problem. Further abstracting behaviors. The classi cations applied in the glucose-insulin example pick out the various phases of what is an oscillation, but they do not recognize the oscillation itself. We are currently examining the recognition of sequences of classi cations so that phenomena such as oscillation or relaxation to equilibrium can be identi ed and reported as such to the user.
6 Conclusion We have not proved that this algorithm produces a minimal abstraction and in certain cases the abstraction can be shown not to be unique in minor ways. However, the algorithm has provided 11
apparently minimal results in several trials on models for which it was not designed. In all tests, the algorithm reduced the number of states and behaviors su�ciently to provide a useful overview of the behavior of variables of interest over the entire behavior graph. In the example, it enabled us to succinctly characterize the behaviors of the amounts of glucose and insulin and the relationship between their behaviors. The large reduction in the number of states, the selection by the user of a few salient classi cations, and the display of each state's classi cations in a graph of the abstract behaviors all contribute to achieving an overview of the behaviors. Other methods of summarizing behaviors, such as visually comparing all the behaviors of a single variable, or of several variables, leave it to the user to see the general picture which we have produced here in a few graphs.
A Proof of Theorem 1. Case 1. Si ! Sj . If all three conditions for case 1 in the theorem are false then | (a) Si is not the successor of Sj (i.e., Sj 6! Si ), and (b) Si has a successor Ss 6= Sj that is not a successor of Sj (i.e., 9Ss 6= Sj such that Si ! Ss and Sj 6! Ss), and (c) Sj has a predecessor Sp 6= Si that is not a predecessor of Si (i.e., 9Sp 6= Si such that Sp ! Sj and Sp 6! Si). In this case, merging Si and Sj into Sk will create a path Sp ! Sk ! Ss with no corresponding path in the unmerged states. Thus the disjunction of these conditions is necessary for soundness. To show that they are also su�cient, assume that there is some path Sa ! Sk ! Sb with no corresponding path in the unmerged states. Then Sa must be a predecessor of Si or Sj and Sb must be a successor of Si or Sj . There are four possible combinations of these edges; each leads to a contradiction of the assumption. 1. Sa ! Si and Si ! Sb . But then there is a corresponding path in the unmerged graph, Sa ! Si ! Sb, which contradicts the assumption. 2. Sa ! Sj and Sj ! Sb . This is similar to the previous case. 3. Sa ! Si and Sj ! Sb. But then the corresponding path is Sa ! Si ! Sj ! Sb . 4. Sa ! Sj and Si ! Sb. At least one of the three conditions in case 1 must be true: (a) Sj ! Si. But then the corresponding path is Sa ! Sj ! Si ! Sb . (b) All successors of Si except Sj are also successors of Sj . But then Si ! Sb implies Sj ! Sb and the corresponding path is Sa ! Sj ! Sb . (c) All predecessors of Sj except Si are predecessors of Si . But then Sa ! Sj implies Sa ! Si and the corresponding path is Sa ! Si ! Sb .
Case 2. Si 6! Sj and Sj 6! Si. If we negate the four conditions in the theorem for this case, we nd (after some manipulation) that there must exist some predecessor of Si that is not a predecessor of Sj and some successor of Sj that is not a successor of Si , or vice versa, interchanging Si and Sj . (It is easier to see this by negating this statement than the conditons in the theorem.) In either 12
case, there is a path Sa ! Sk ! Sb in the merged graph that has no corresponding path in the unmerged graph. Thus the disjunction of the theorem's conditions is necessary for soundness. To show that they are also su�cient, assume that there is some path Sa ! Sk ! Sb with no corresponding path in the unmerged states; Sa must be a predecessor of Si or Sj and Sb a successor of Si or Sj . Each of this case's four conditions contradicts the assumption. (a) If preds(Si) = preds(Sj ) then Sa is a predecessor of both Si and Sj , and since Sb is a successor of one of them there is a corresponding path in the unmerged graph Sa ! Si ! Sb or Sa ! Sj ! Sb . (b) If succs(Si ) = succs(Sj ) the reasoning is similar to the previous case. (c) If preds(Si ) � preds(Sj ) and succs(Si ) � succs(Sj ) then Sa must be a predecessor of Sj and Sb a successor of Sj , so the corresponding path is Sa ! Sj ! Sb. (d) If preds(Sj ) � preds(Si ) and succs(Sj ) � succs(Si ) then the reasoning is similar to the previous case. 2
References [Clancy 93] Daniel J. Clancy and Benjamin Kuipers. Behavior Abstraction for Tractable Simulation. QR-93 57{64. [Clancy 94] Daniel J. Clancy and Benjamin Kuipers. Model Decomposition and Simulation. QR-94 45{54 [Dalle Molle 89] David Dalle Molle. Qualitative Simulation of Dynamic Chemical Processes. Technical Report AI89{107, Arti cial Intelligence Laboratory, University of Texas at Austin, Austin, Texas 78712 (May 1989). [deKleer and Brown 84] J. de Kleer and J.S. Brown. A Qualitative Physics Based on Con uences. AI, 56:171{196 (1984). Also in [Weld and deKleer 90] 88{126. [Falkenhainer and Forbus 90] Brian Falkenhainer and Kenneth D. Forbus. Self-Explanatory Simulations: An Integration of Qualitative and Quantitative Knowledge. AAAI-90 380{387. [Falkenhainer and Forbus 92] Brian Falkenhainer and Kenneth D. Forbus. Self-Explanatory Simulations: Scaling up to Large Models. AAAI-92 685{690. Also in QR-92 22{35. [Farquhar 94] Adam Farquhar. A qualitative physics compiler. AAAI-94 1168{1174. [Forbus 84] Kenneth D. Forbus. Qualitative Process Theory. AI 24:85{168 (1984). Also in [Weld and deKleer 90] 178{219. [Fouche 91] Pierre Fouch�e and Benjamin Kuipers. Towards a Uni ed Framework for Qualitative Simulation. QR-91 295{301. [Ironi 94] Liliana Ironi and M. Stefanelli. A Framework for building qualitative models of compartmental systems. Computer Methods and Programs in Biomedicine 42, 233-254 (1994). [Kay 92] Herbert Kay. A Qualitative Model of the Space Shuttle Reaction Control System. Technical Report AI92{188, Arti cial Intelligence Laboratory, University of Texas at Austin, Austin, Texas 78712 (September 1992). 13
[Kuipers 86] Benjamin Kuipers. Qualitative simulation. AI, 29:289-338, September 1986. [Kuipers 94] Benjamin Kuipers. Qualitative Reasoning: Modeling and Simulation with Incomplete Knowledge. Cambridge, Mass.: MIT Press, 1994. [Lee 93] Wood W. Lee and Benjamin Kuipers. A Qualitative Method to Construct Phase Portraits. AAAI-93 614{619. [Lester 94] James Lester. Generating Natural Language Explanations from Large Scale Knowledge Bases. Ph.D. thesis, University of Texas at Austin, 1994. [Porter 88] Bruce W. Porter, J. Lester, K. Murray, K. Pittman, A. Souther, and T. Jones. AI research in the context of a multifunctional knowledge base: The knowledge base project. Technical Report AI88{88, Arti cial Intelligence Laboratory, University of Texas at Austin, Austin, Texas 78712 (1988). [Rickel 92] Je� Rickel and Bruce Porter. Automated modeling for answering prediction questions: Exploiting interaction paths. QR-92 82{95. [Rickel 94] Je� Rickel and Bruce Porter. Automated modeling for answering prediction questions: Selecting the time scale and system boundary. AAAI-94 1191{1198. [Weld and deKleer 90] Daniel S. Weld and Johan De Kleer, eds. Readings in Qualitative Reasoning About Physical Systems. Morgan Kaufmann, San Mateo CA, 1990. Abbreviations for titles of journals and proceedings: AAAI-90 Proceedings, Eighth National Conference on Arti cial Intelligence, Boston, Massachusetts (1990). AAAI-92 Proceedings, Tenth National Conference on Arti cial Intelligence, San Jose, California (1992). AAAI-93 Proceedings, Eleventh National Conference on Arti cial Intelligence, Washington, D.C. (1993). AAAI-94 Proceedings, Twelfth National Conference on Arti cial Intelligence, Seattle, Washington (1994). AI Arti cial Intelligence. QR-91 Working Papers, Fifth International Workshop on Qualitative Reasoning about Physical Systems, Austin, Texas (1991). QR-92 Working Papers, Sixth International Workshop on Qualitative Reasoning about Physical Systems, Edinburgh, Scotland (1992). QR-93 Proceedings of the Seventh International Workshop on Qualitative Reasoning about Physical Systems, Orcas Islands, Washington (1993). QR-94 Proceedings of the Eighth International Workshop on Qualitative Reasoning about Physical Systems, Nara, Japan, (1994).
14