architecture based on the principle of under-sampling (or bandpass sampling)
that ...... random pre-integrator and the proposed bandpass sampling architecture
.
1
Compressive Spectrum Sensing Using a Bandpass Sampling Architecture Linda Bai, Student Member, IEEE & Sumit Roy, Fellow, IEEE
Abstract—Fast and reliable detection of available channels (i.e., those temporarily unoccupied by primary users) is a fundamental problem in the context of emerging cognitive radio networks, without an adequate solution. The (mean) time to detect idle channels is governed by the front-end bandwidth to be searched for a given resolution bandwidth. Homodyne receiver architectures with a wideband RF front-end followed by suitable channelization and digital signal processing algorithms, are consistent with speedier detection, but also imply the need for very high speed analog-to-digital converters (ADCs) that are impractical and/or costly. On the other hand, traditional heterodyne receiver architectures consist of analog band-select filtering followed by down-conversion that require much lower rate ADCs, but at the expense of significant scanning operation steps that constitute a roadblock to lowering the scan duration. In summary, neither architecture provides a satisfactory solution to the goal of (near) real-time wideband spectrum sensing. In this work, we propose a new compressive spectrum sensing architecture based on the principle of under-sampling (or bandpass sampling) that provides a middle ground between the above choices, i.e., our approach requires modest ADC sampling rates and yet achieves fast spectrum scanning. Compared to other compressive spectrum sensing architectures, the proposed method does not require a high-speed Nyquist rate analog component. A performance model for the scanning duration is developed based on the mean time to detect all idle channels. Numerical results show that this scheme provides significantly faster idle channel detection than the conventional serial search scheme with a heterodyne architecture. Index Terms—Compressive Sensing, Cognitive Radio, Wideband Spectrum Sensing, Transceiver Architectures
I. I NTRODUCTION Continued proliferation of wireless services has led to renewed scrutiny of spectrum utilization. In particular, several licensed bands, e.g., land mobile and amateur radio, have been shown to be under-utilized with occupancy rates between 15% to 85% [1]. Cognitive radios - enabled by emerging software defined transceiver architectures - is an approach for enhanced spectrum utilization, by allowing unlicensed users to opportunistically access licensed bands, when the latter are unused. The unlicensed or secondary users must sense the spectrum to detect idle channels (free of incumbents or primary users) and are allowed to utilize the idle channels, provided they do The authors are with the Department of Electrical Engineering, University of Washington, Seattle, WA 98195, USA (e-mail:
[email protected];
[email protected]).This work was supported in part by the National Science Foundation Graduate Research Fellowship to the 1st author under Grant No. DGE-0718124. Copyright (c) 2012 IEEE. Personal use of this material is permitted. However, permission to use this material for any other purposes must be obtained from the IEEE by sending an email to
[email protected].
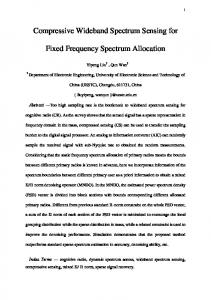
not interfere with the licensed users, i.e., vacate the channel when a primary user transmission is detected. Therefore, one of the primary requirements for cognitive radio is fast and effective detection of idle channels to exploit the available secondary network capacity [1]. Due to the large bandwidth (for example, up to 10 GHz) that needs to be sensed, speedy idle channel detection is a challenging task. Depending on the bandwidth needs required by the applications, secondary users may seek to detect one idle channel or all available idle channels. For detection of one idle channel, the receiver stops searching as soon as it detects the first idle channel, whereas in the latter, the receiver will search the status of all channels in the spectrum of interest. In this paper, we focus on the second scenario, consistent with the desire to maximize secondary throughput. Assume that the entire (one-sided) spectrum of bandwidth W = N Wc is channelized into an N -set of contiguous frequency domain channels of bandwidth Wc each. The choice of receiver architecture is a major factor that influences the mean detection time of all the idle channels among these N channels. The heterodyne architecture is the most popular legacy architecture due to its high selectivity and sensitivity [2]. Heterodyne receivers use analog bandpass filters for selecting a Wc -width channel as shown in Fig.1. The output is then down-converted to baseband and fed into an analog-todigital converter (ADC) [3]. The ADC samples at fs = Wc (to produce the complex baseband signal), at a rate which is much smaller than the total signal bandwidth N Wc . The receiver decides the status of the selected channel using one of several standard detection algorithms described in [4]. After the status of the selected channel is determined, the receiver switches to the next channel in sequence. A conventional serial search scheme (implying a sweep or step-through of the LO frequency) is used to determine the occupancy status of all the N channels. For the heterodyne receiver architecture, the time to detect idle channels has two components - a) the integration time Ti required by the detection algorithm once a channel has been selected for investigation; and b) the duration for switching to a new channel Tsw during scanning, that is largely determined by the design/operation of the LO [5]. Denote Ni as the number of samples required for meeting desired detection accuracy in each channel for a given detection algorithm, then Ti ≈ Ni /Wc . The mean detection time for the heterodyne receiver to determine status for all channels is thus Td,serial = N (Ti + Tsw ). For example, for Wc = 200 kHz, N = 1024, Ni = 1000, and Tsw ≈ 50µs as in [6], then Ti = 5 ms, and Td,serial ≈ 5.17 sec.
2
requiring a lower rate ADC. II. R ELATED W ORKS A. Brief Review of Compressive Sensing
Fig. 1. Block diagram of the heterodyne and homodyne receiver architectures
On the other hand, in homodyne receiver architectures such as that in Fig.1, the wideband RF received signal is sampled directly by an ADC, followed by subsequent digital signal processing for channelization and determination of channel status. For digital signal processing, the power spectrum is obtained by squared magnitude of the N -point FFT for the wideband signal. Each bin in the power spectrum represents the estimated power in the corresponding channel, and is compared with a power threshold to determine the status of the channel [7]. An estimate of the (mean) time to determine status of all N channels is obtained by noting that the total number of samples needed is N · Ni , when Ni samples are required for each channel. Since the sampling rate of the ADC for the complex baseband signal is N ·Wc , the acquisition time is (N ·Ni )/(N ·Wc ) = Ni /Wc . Note that signals in all the N channels are acquired in parallel and hence the analog circuit switching time Tsw is avoided, yielding an acquisition time that is independent of N . Denote Tdsp as the latency due to the subsequent signal processing operations such as the FFT in generating the spectrogram. Hence the time to determine status of all channels for such a homodyne architecture is Td,sdr = Ni /Wc +Tdsp . For the spectrum sensing task above, the detection time for all the idle channels with the software defined radio architecture (i.e., the homodyne architecture) is approximately 31 ms, with Tdsp = Ni · 26µs, where 26µs is the typical processing time for a 1024-point FFT [8]. Thus, software defined radio (SDR) based transceivers can potentially achieve faster detection by two orders of magnitude, at the expense of an ultra-fast (multi-GHz) ADC for Nyquist sampling of the wideband signal, that considerably increases the power consumption and IC complexity [9]. In this work, we unveil a new, compressive architecture based on sub-Nyquist 1 sampling ADCs. Our proposal thus treads a middle ground by combining the strengths of the two architectures, in terms of achieving fast detection, while 1 The sampling is sub-Nyquist relative to the rate required to sample the (bandpass) spectra treated as a low pass signal.
Compressive sensing (CS) is a well-known technique to reconstruct a sparse N -dimensional signal vector x from an M -dimensional representation y = ΦΨx ( M ≪ N ) [10], where the N × N matrix Ψ is the sparsifying basis. In the spectrum sensing scenario, Ψ is the Inverse Fourier Transform matrix, and x represents the amplitude spectra in the frequency domain. There exists a mature literature regarding appropriate choices of the observation matrix Φ, whose elements are typically i.i.d Gaussian or Bernoulli variables [10]. An appropriate choice of Φ must satisfy the Restricted Isometry Property (RIP), formally defined as follows [11], Definition 1: Restricted Isometry Property A matrix Φ satisfies RIP with parameter (k, δk ) if (1 − δk )∥x∥22 ≤ ∥Φx∥22 ≤ (1 + δk )∥x∥22
(1)
for all k-sparse vectors x, where k-sparsity means there are at most k non-zero elements in the vector x. √ Given Φ satisfies RIP with (2k, δ2k ) and 0 < δ2k < 2− 1, the k-sparse vector x is reconstructed using minimize ∥x∥1 subject to y = ΦΨx
(2)
Of late, applications of CS to spectrum estimation in cognitive radio has appeared in [12], [13], [14], and [15]. Most of the previous works focus on algorithm development for reconstruction, such as [12] and [14], while in this paper, we emphasize the architectural aspects of compressive detectors and its impact on performance. Therefore, for baseline, we compared our architecture performance with the preferred architectures in prior art. Various receiver architectures for spectrum sensing with sub-Nyquist sampling have been proposed based on compressive sensing theory. These architectures can be divided into two classes: non-uniform sampler and random pre-integrator [16]. Both receiver architectures consist of subNyquist sampling ADCs to obtain an observation matrix Φ that satisfies RIP. Nevertheless, these sub-Nyquist sampling approaches based on CS can provide accurate results only if most of the channels in the spectrum are idle, i.e., p¯ ≈ 1, where p¯ denotes the average probability of a channel being idle. If the number of occupied channels is close to the number of idle channels, i.e., p¯ ≈ 0.5, current CS-based reconstruction approaches fail to provide accurate channel status [16]. In addition, compressive detection incurs high computational complexity to solve (2), leading to extended signal processing time. Furthermore, although the sampler in the ADC operates at a sub-Nyquist rate, the detector actually requires Nyquist rate analog components as discussed in Sec. II-B [17]. For the non-uniform sampler, a Nyquist rate clock is required for the shifters; for the random pre-integrator, a Nyquist rate random generator is required.
3
sampling architecture, the complexity for solving (2) is O(M 2 N 1.5 ) [22]. In [23], as M ∼ O((N − p¯N )log(1/(1 − p¯))), Tl1 ∼ O(((1−p¯)N )3 ). When Ni spectrum snapshots are reconstructed and averaged to generate the power spectrum, the digital signal processing time is O(((1 − p¯)N )3 Ni ) for both the random pre-integrator and non-uniform sampling architectures. Note that (2) requires the sensing matrix ΦΨ to be stored on-chip, yielding a memory requirement of O(M N ). However, the storage required for the non-uniform sampler is O(M ). Since ΦΨ is a subset of the IDFT matrix, only the indices for the M chosen rows need to be stored, and ΦΨ can be reconstructed using only the indices. Fig. 2.
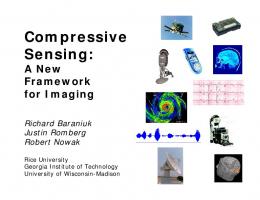
Architecture of a non-uniform sampler
Fig. 3.
Architecture of a random pre-integrator
C. Contributions
B. Non-uniform Sampling and Random Pre-integration: Compressive Detection Approaches The architecture of a non-uniform sampler is shown in Fig.2 [18][19] where the wideband input signal is sampled at a sub-Nyquist rate fs = T1s = N γWc by M branches, each with a different time shift misalignment ϕi , i = 1, ..., M , where γ > 1 is the sub-sampling factor. In terms of analog implementation, the non-uniform sampler operates at a subNyquist rate, but requires a Nyquist rate clock to synchronize the shifters on each branch. On the other hand, an example of a random pre-integrator architecture is shown in Fig. 3 [17]. In a random pre-integrator [20][21], a demodulator multiplies the received (analog) signal with a random chipping sequence; the resulting product is integrated over a symbol duration and sampled at a sub-Nyquist rate on each of the M branches. The chipping sequence generator is required to work at greater or equal to the Nyquist rate to produce a Φ with i.i.d. Bernoulli or Gaussian entries. Denote the signal processing time for (2) as Tl1 , then the mean detection time for the non-uniform sampler is Td,CS = (N · Ni )/(N · Wc ) + Ni Tl1 = Ni /Wc + Ni Tl1 (3) where Tl1 is determined by the computational complexity of the signal processing algorithms. Using the non-uniform
Fig. 4. Block diagram of a bandpass sampling architecture for direct downconversion
Our work is a synthesis of the notion of Compressive Sensing within a bandpass sampling architecture. The traditional bandpass sampling receiver chain is shown in Fig.4, where the complex baseband signal r(t) is sampled at a sub-Nyquist rate fs = T1s = N γWc to obtain y[n] = r(nTs ), where γ > 1 is the sub-sampling factor [24]. Note that for compactness, only the analytic signal that occupies the positive frequency spectrum, is shown. This architecture achieves frequency downconversion by undersampling r(t) (viewed as a wideband lowpass signal), where the sampling rate is determined by the bandwidth of the desired bandpass signal (i.e., conforming to the bandpass Nyquist sampling theorem) instead of the carrier frequency [25]. Owing to the reduction of the sampling rate, bandpass sampling simplifies the design of the local oscillator (LO), leading to better performance than a mixer for downconversion [3].
4
In Sec.III, a spectrum sensing scheme with a bandpass sampling architecture is proposed. Here, the entire spectrum (in principle) can be sensed simultaneously, reducing the need for LO scanning. The proposed architecture switches between different (sub-Nyquist) sampling rates to obtain an observation matrix that satisfies RIP; no Nyquist-rate analog component is needed. Instead of reconstructing each snapshot of the amplitude spectra, the power spectrum is reconstructed directly by l1 minimization, mitigating the delay of intense signal processing. In Sec.IV, the performance of the proposed architecture is analyzed. The mean detection time, the computational complexity, and the required memory for storing the observation matrix are compared with the non-uniform sampler and the random pre-integrator. In addition, the detection rate and the false alarm rate for the proposed scheme is analyzed. A low detection rate will cause interference to primary users, while a low false alarm rate is necessary for a high spectral utilization rate. Numerical results for the mean detection time are presented as a function of the number of channels to be sensed. Impact of Signal-to-Noise Ratio (SNR) and p¯ is explored. Finally, in Sec.V, the proposed scheme is validated using real-world spectrum measurements obtained in Aachen, Germany. III. S YSTEM D ESCRIPTION Fig. 5. 5Wc
A. System Model Assume that the band of interest consists of N equi-spaced channels; the central frequency of the ith channel is fi = i Wc − W2c , where Wc is the bandwidth for each channel. A binary variable, Oi is used to denote the status of the ith channel, where Oi = 0(1) means the channel is busy (idle). We invoke an independent Bernoulli model for channel status, that is supported by real-world data as described in [26], i.e., P r(Oi = 1) = pi , i = 1, ..., N
(4)
Thus, the average signal power P¯s,i in the ith channel is described as a Bernoulli variable, with P r(P¯s,i = 0) = pi and P r(P¯s,i = P¯r,i ) = 1 − pi , where pi is the probability of the ith channel being idle. P¯r,i is the signal power in the ith channel at the receiver when the channel is occupied by the primary user. The average idle∑channel probability over the N entire band is given by p¯ = N1 i=1 pi .
Sub-Nyquist rate sampling: a signal with 12 channels sampled at
5Wc . As shown in Fig.5, aliasing occurs in the spectra of the sampled signal due to the sub-Nyquist sampling rate; the sixth channel folds back onto the first channel, since 1 f6 − fs = 11 2 Wc − 5Wc = 2 Wc = f1 . Clearly, when a signal is sub-sampled with rate fs , all frequency components {fi ± kfs }, k = 0, 1, . . . present in the signal alias back onto the same frequency fi ∈ [0, fs ], where [0, fs ] is the first N Nyquist zone. Letting fs = N γ Wc , where γ is an integer, the N relationship between Yi , i = 1, ..., γ , (the Fourier coefficients of y[n] on the interval [0, fs ]) and Ri , i = 1, ..., N , (the Fourier coefficients of r[n] sampled at Nyquist rate N Wc on the interval [0, N Wc ]) is
Y1 R1 . 1 1 Y = .. = Φ ... = ΦR γ γ YN RN
B. Compressive sensing architecture
γ
Denote the received signal as r(t) whose bandwidth W = N Wc . The discrete-time Fourier transform Y (f ) of the signal y[n] sampled at the rate fs is related to R(f ), the Fourier transform of r(t), by the well-known result ∞ 1 ∑ Y (f ) = R(f − kfs ) Ts
(6)
(5)
k=−∞
An example is illustrated in Fig.5 where the complex baseband signal r(t), comprising of 12 channels each of bandwidth Wc , is sampled at a (sub-Nyquist) rate of fs =
where the
N γ
× N matrix
( Nγ −1)0′ s z }| { 1 0 0 ... 0 1 0 0 0 1 0 ... 0 0 1 0 Φ= 0 0 1 ... 0 0 0 1 0
0
0
... 1 0
0
0
... 0 1 0 0 ... 0 0 1 0 ... 0 0 0 1 .. .
... ... ...
... 1
... (7)
0
0
0
5
For example, let N = 10, and γ = 2. Then Y1
4 ∑
=
i=0 4 ∑
=
r(i/fs ) =
4 ∑
r(iγ/N Wc )
i=0
r(2i/N Wc )
(8)
i=0
Since
9 ∑
R1 =
r(i/N Wc )
(9)
i=0
and R5
=
9 ∑
r(i/N Wc )e
j2π 10 5i
i=0
=
4 ∑
r(2i/N Wc ) −
4 ∑
i=0
r((2i + 1)/N Wc ) (10)
i=0
c , followed by k th branch consists of an ADC sampling at NγW k a square-law device and an integrator. Note that instead of the multi-branch architecture, a single branch detector as in Fig.5 that sequentially switches between different sampling rates is also feasible. However, the resulting mean detection times are different. Clearly, the multi-branch architecture yields a reduced sensing duration due to the inherent parallelism, at the cost of chip complexity. Our analysis for mean detection time in Sec.IV is based on the single branch architecture. The measurement Yk,n for the k th sampling rate and the th n snapshot is used to create the spectrogram, denoted by a N 2 2 γk × 1 vector wk,n , where wk,n (i) = γk |Yk,n (i)| , n = 1, . . . , Ni , are i.i.d corresponding to different snapshots. Now P¯s,1 + P¯v,1 .. E(wk,n ) = Φk (14) . P¯s,N + P¯v,N
where Φk is constructed according to (7),
it follows that Y1 = 12 (R1 + R5 ). Therefore, each element in Y is the average of the amplitude spectra over a block of γ channels in R. Let R = S + V, where S = [S1 , . . . , SN ]T is the signal component and V = [V1 , . . . , VN ]T is the noise component, E(|Si |2 ) = P¯s,i , and E(|Vi |2 ) = P¯v,i , where P¯s,i (P¯v,i ) is the average signal (noise) power in the ith channel, respectively. Then (6) can be written as Y=
1 Φ(S + V) γ
V ar(wk,n (i)) E((wk,n (i))2 ) − (E(wk,n (i)))2 ∑γ ∑γ = E(| j ′k=1 Rj ′ |4 ) − ( j ′k=1 (P¯s,j ′ + P¯v,j ′ ))2 ∑γ = ( j ′k=1 (P¯s,j ′ + P¯v,j ′ ))2 =
For i1 ̸= i2 ,
(11)
The sequences Si , Vi are assumed to consist of independent variables (corresponding to different channels) that are mutually independent. It is natural that E(Vi ) = 0 and for symmetric signal constellations, E(Si ) = 0
1 ∑ E( 2 | Rj ′ |2 ) γ ′ γ
E(Ym Ym∗ )
=
=
=
1 E( γ2 1 γ2
j =1 γ ∑
|Rj ′ |2 +
j ′ =1
γ ∑
Cov(wk,n (i1 ), wk,n (i2 )) =
E((wk,n (i1 ))(wk,n (i2 ))) −(E(wk,n (i1 )))(E(wk,n (i2 ))) = 0
(12)
as well. Then Ri and Rj are independent, ∀ i ̸= j, and E(Ri ) = E(Si )+E(Vi ) = 0, E(|Ri |2 ) = P¯s,i + P¯v,i . Typically the time samples r[n] are complex Gaussian variables, whose Fourier coefficients Ri ∼ CN (0, (P¯s,i + P¯v,i )/2), i = 1, . . . , N [27]. The expectation of the power in the mth block is
∑ j1′ ̸=j2′
P¯s,j ′ + P¯v,j ′
Rj1′ Rj∗2′ ) (13)
j ′ =1
where P¯s,j ′ and P¯v,j ′ are the average signal power and noise power in the j ′th channel in the mth block, respectively. We propose to use the bandpass sampling architecture shown in Fig.5 to sense the spectrum K times, each for a different sub-Nyquist sampling rate, in order to obtain a Φ that satisfies the RIP. An equivalent architecture is shown in Fig.6 where the incoming signal is fed into K branches. The
(15)
(16)
The averaged power over Ni snapshots w ¯k =
Ni 1 ∑ wk,n Ni n=1
(17)
has a chi-square distribution with 2Ni degrees of freedom. When the number of samples Ni is large, we can use the Central Limit Theorem to approximate w ¯ k as Gaussian [7], i.e., w ¯ k ∼ N (E(wk,n ), Σk /Ni ), where the variance matrix Σk = diag(V ar(wk,n (1)), . . . , V ar(wk,n ( γNk ))). Therefore, for the K sampling rates, w ¯1 Φ1 P¯s,1 .. .. .. (18) . = . . + n w ¯K ΦK P¯s,N w ¯1 Φ1 Denote w ¯ CS = ... , ΦCS = ... , sCS = w ¯K P¯s,1 .. . , leading to the compact form P¯s,N
w ¯ CS = ΦCS sCS + n
ΦK
(19)
6
IV. P ERFORMANCE A NALYSIS In this section, the performance of the proposed compressive spectrum sensing architecture with bandpass sampling is analyzed. The mean detection time and the storage required for the observation matrix is compared with the non-uniform sampler and the random pre-integrator in Table I. A. Mean Detection Time and Computational Complexity
Fig. 6. Block diagram of the compressive detection scheme with bandpass sampling
where
ΦCS
1 1 0 .. = . 1 . .. 0 N γ0
2 0 1
3 0 0
4 0 0
5 0 0
0
0
0
0
0
0
0
0
... ... ... ... ...
n = 1, ..., N (n mod γN1 ) = 1 (n mod γN1 ) = 2 .. . (n mod γN2 ) = 1 .. . (n mod γNK ) = 0
(20) = 0, then Φ (i, j) = 1, if ∃ 0 ≤ l ≤ K − ∑l+1 N N N k=0 γk , and j mod γl+1 = i − γk < i ≤
The mean detection time for the proposed compressive sensing architecture consists of three parts: integration time, time for switching ADC sampling rates, and latency for computation of the spectrogram. Since Ni samples are used in determining status for each folded channel in w ¯ k , the total number of samples needed equals Ni N/γk . Hence, the total k integration time for the k th sampling rate is NγikN NγW = c Ni /Wc and for the entire sensing process is KNi /Wc . Denote the switching time between two different sampling rates as ¯ k for each sampling rate can be Tsw . The spectrogram w generated during the analog circuit switching time, because the FFT size for each sampling rate is γNk ≪ N, k = 1, . . . , K, and the signal processing time for FFT and averaging is negligible compared to Tsw . Therefore, the major component of the latency for computation of ˆs is the signal processing time Tl1 required by (21). Thus the mean detection time for the proposed sensing scheme is Td,bps = K(Ni /Wc + Tsw ) + Tl1
(22)
CS
Define ∑l 1, s.t. k=0 ∑l CS N (i, j) = 0. k=0 γk ; otherwise Φ
P¯v,1 The additive noise n ∼ N (ΦCS ... , ΣCS ). BeP¯v,N cause w ¯ k1 and w ¯ k2 are derived from samples from different time slots, ∀ k1 ̸= k2 , Cov(w ¯ k1 (i1 ), w ¯ k1 (i2 )) ≈ 0, ∀ i1 , i2 , yielding ΣCS ≈ N1i diag(Σ1 , . . . , ΣK ). Because P r(P¯s,i = 0) = pi , the average number of nonzero elements in sCS is (1 − p¯)N . It is proved in [28] that if (1 − p¯) ≪ 1, and γN1 , . . . , γNK are the first K ∼ O((N − p¯N )logN −pN ¯)N ≤ γN1 < ¯ N ) prime numbers with (1 − p CS N . . . < γK , then Φ satisfies RIP. Note that a lower bound for p¯ is required for choosing K, since ∀ 0 < plow < p < 1, if ΦCS satisfies RIP for (2(1 − plow )N, δ2N (1−plow ) ), it satisfies RIP for (2(1 − p)N, δ2N (1−plow ) ). Detection of the channel status O = [O1 , . . . , ON ]T in (4) is done by first solving for the signal powers from the following convex optimization problem
minimize ∥ˆ s∥1 CS subject to ∥w ¯ −Φ ˆ s∥2 ≤ ϵ CS
(21)
where P r(∥n∥2 ≤ ϵ) ≥ λ, λ ≈ 1. Then each element in ˆ s = [Pˆs,1 , . . . , Pˆs,N ]T is compared to a power threshold β to ˆi = determine if the channel is occupied, i.e., Pˆs,i > β ⇒ O 0.
The number of rows M of ΦCS in (20) is KCL , where CL is the average of the first K prime numbers no smaller than N (1 − p¯). In [28], it is proved that CL ∼ O((N (1 − p¯))(logN −pN ¯N )logN −pN ¯ N )ln((N − p ¯ N )). As K ∼ O((N − p¯N )logN −pN N ), M ∼ O(C (N − p ¯N )logN −pN ¯ L ¯ N ). l1 minimization is applied to compute the averaged power spectrum directly, instead of the individual amplitude spectra for each snapshot. Thus the computational complexity associated with (21) is O(M 2 N 1.5 ), independent of Ni , leading to shorter signal processing time compared to the non-uniform sampler and the random pre-integrator. Fig.7 illustrates the mean detection time for serial search with the heterodyne architecture, non-uniform sampler, random pre-integrator, and the proposed bandpass sampling architecture with Wc = 200 kHz, Tsw = 50µs, and Ni = 1000. As shown in [23], Tl1 ≈ ((1 − p¯)N )3 µs. p¯ is chosen to be 0.9 so that the spectrum satisfies the sparsity requirement of CS. The results show that the bandpass sampling architecture consistently outperforms the serial search scheme for heterodyne architecture, by reducing analog circuit switching steps. For the bandpass sampling architecture, as N increases, an increased number of sampling rates is required, leading to the increased mean detection time. For the non-uniform sampler and the random pre-integrator, as N increases, the digital signal processing time becomes the major component in mean detection time, where l1 minimization is applied to reconstruct the amplitude spectra and is executed Ni times. When the signal processing duration is longer than the circuit switching time in the bandpass sampling architecture, the mean
7
Non-uniform sampler Ni /Wc + Ni Tl1 Yes O((N − p¯N )log(1/(1 − p¯)))
Mean detection time Nyquist rate analog component Storage (projection matrix)
Random pre-integrator Ni /Wc + Ni Tl1 Yes O(N (N − p¯N )log(1/(1 − p¯)))
TABLE I C OMPARISON BETWEEN CS- BASED
detection time of the non-uniform sampler and the random preintegrator exceeds that of the bandpass sampling architecture, because K ≪ N . N =1000, p = 0.9, W = 200kHz i
4
c
10
3
Mean detection time (ms)
10
2
10
Serial search with heterodyne architecture Non−uniform sampler and random pre−integrator Bandpass sampling architecture
1
10
0
10 100
200
300
400 500 600 700 N (number of channels)
800
900
1000
Fig. 7. Mean detection time of the serial search, non-uniform sampler, random pre-integrator and the proposed bandpass sampling architecture
In terms of storage requirements, only the sub-sampling factors γk , k = 1, . . . , K need to be stored in memory, and the matrix ΦCS can be generated on-line according to (20). The storage required is smaller than the non-uniform sampler and the random pre-integrator. B. Detection performance and receiver operating characteristics The detection performance is influenced by the average SNR of all the channels. Assume a known signal is used for calibration, where the average SNR of the occupied channels is used for performance analysis. Denote the support of sCS as Λ = {i : P¯s,i > 0}. The input SNR is given by √∑ ( i∈Λ P¯s,i )2 ∥sCS ∥2 (23) ISN R = √ ∑ = C0 ϵ ( P¯ )2 i∈Λ
v,i
where C0 is determined by N and p¯. The postreconstruction SNR is given by RSN R =
∥sCS ∥2 ∥sCS − ˆ s∥2 CS
(24)
where ˆs is output from (21) and s consists of the actual signal powers. It is proved in [11] that with probability λ ∼ 1, √ 2δ2L ¯ 2α CS ∥ˆs − s ∥2 ≤ C1 ϵ, where C1 = 1−ρ , ρ = 1−δ ¯ , α = 2L √ 2 1+δ2L ¯ ¯ = (1 − p¯)N [11]. Denote C = C0 C1 . √ , and L 1−δ2L ¯
Therefore,
Bandpass sampling K(Ni /Wc + Tsw ) + Tl1 No O((N − p¯N )logN −pN ¯ N)
ARCHITECTURES
ISN R ≤ C × RSN R
(25)
The post-reconstruction SNR is C times worse than the input SNR. Denote Pd and Pf a as detection rate and false alarm rate, respectively. Since Pd -Pf a performance is proportional to RSNR and RSNR is bounded at least by a function of δ2L¯ and ISNR in (25), the detection rate Pd and the false alarm rate Pf a are determined by δ2L¯ and ISNR, where p) ¯ δ2L¯ ∼ O( 2N (1− log2N (1−p) ¯ N ) according to [28]. K To gain additional insight into the impact of δ2L¯ on the detection performance, the overall receiver operating characteristics for the bandpass sampling architecture are shown in Fig.8(a) and Fig.8(b), with p¯ = 0.95, N = 100, Ni = 1000, and pi = p¯, i = 1, . . . , N . For K = 3, the sampling rates used are 5Wc , 7Wc , 11Wc , and for K = 4, an additional sampling rate 13Wc is used, where all the sampling rates are smaller than the Nyquist rate 100Wc . P¯s,i are set to 10 and P¯v,i = 1, i = 1, . . . , N , so ISNR = 10dB. The numerical results of the estimated detection rate Pˆd and the estimated false alarm rate Pˆf a are averaged over 500 iterations. In each iteration, the locations of the occupied channels are different. As shown in Fig.8(a) and Fig.8(b), the performance for 4 sampling rates is better than 3 sampling rates, because δ2N (1−p) ¯ for K = 4 is smaller than for K = 3, yielding smaller C in (25). The impact of the ISNR = P¯s,i /P¯v,i on the Pd -Pf a performance is shown in Fig.9. As the ISNR decreases towards 9 dB, Pˆd with 4 sampling rates (5Wc , 7Wc , 11Wc , and 13Wc ) begins to decrease rapidly, because the spectrum of R is no longer sparse for ΦCS with the chosen sampling rates. In contrast, all the occupied channels are correctly detected for the 5 sampling rates (5Wc , 7Wc , 11Wc , 13Wc , and 17Wc ) over the 500 iterations for the SNR range shown in Fig. 9. Therefore, for a given ISNR, the detection performance of the proposed architecture can be improved by increasing the number of sampling rates, which imposes a trade-off between the detection performance and the detection time. The impact of the sparsity level of the spectrum is shown in Fig.10. For a smaller p¯, an increased number of sampling rates is required for ΦCS to satisfy the RIP requirement as discussed in Sec.III, leading to a longer detection time. V. E XPERIMENTAL R ESULTS We conducted a performance evaluation of our bandpass sampling scheme using the (publicly available) measurements of the power spectrum taken in a modern office building in Aachen, Germany, in 2007 [29]. The spectral band observed is 20MHz-1.64GHz (center frequency 770 MHz). The RF signal was amplified, down-converted to the base band, and
8
N = 100, N = 1000, ISNR = 10dB
SNR = 10dB, N = 1000, p = 0.95, N = 100, K = 4
i
i
1
1
0.99
0.8
Pfa for K=4 Pfa for K=5
Pd
Probability
0.98 0.97 0.96
Pd for K=4 Pd for K=5
0.4
0.2 −2
10
−1
Pfa
10
0 0.84
(a) K = 4 SNR = 10dB, Ni = 1000, p = 0.95, N = 100, K = 3 1
0.8
Pd
0.6
0.6
0.4
0.2 0.2
0.4
0.6 P 0.8 fa
1
(b) K = 3 Fig. 8. Receiver operating characteristics for the proposed bandpass sampling architecture with K sampling rates N = 100, Ni = 1000, p = 0.95 1 Pfa for K=5
0.8
Fig. 10.
0.86 0.88 0.9 0.92 0.94 Average probability of a channel being idle p
Impact of the sparsity level p¯ on the Pd -Pf a performance
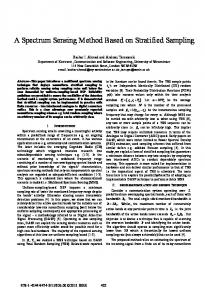
architecture, the 4 sampling rates used are 5Wc , 7Wc , 11Wc , and 13Wc , and for 5 sampling rates, 17Wc is added. To enhance signal sparsity, the average noise level of −116 dBm is removed from the original data, and then added back in the reconstructed power spectrum for comparison with the original spectrum. The proposed architecture with K = 4 achieves a Pˆd = 1 while Pˆf a = 0.01 for all the 5 time slots, with the same threshold of −111 dBm. With K = 4, the reconstructed power spectrum for 12 : 37am and 8 : 37am is shown in Fig.11(a) and Fig.11(b). Although the SNR of the reconstructed signal is worse than the original signal, both of the 2 occupied channels can be accurately identified, but a false alarm occurs in Fig.11(b). As shown in Fig. 11(c), with K = 5, no false alarm occurs for 8 : 37am , because the reconstructed SNR is improved according to Section IV.
Probability
Pfa for K=4 Pd for K=5
0.6
VI. C ONCLUSION
Pd for K=4
0.4
0.2
0
Fig. 9.
6
8
10 12 ISNR (dB)
14
16
Impact of the SNR on the Pd -Pf a performance
processed by an Agilent E4440A spectrum analyzer. The analyzer produces a 8192-point FFT on the signal, where each FFT bin represents a 200 kHz resolution width. The magnitude squared FFT value represents the instantaneous spectrogram (power spectrum) over a channel. A full scan of the 8192 channels requires about 1.8 second. The average noise level of the receiver chain is −169 dBm at 1 Hz resolution bandwidth, which is −116 dBm for the 200kHz channel. The band plan for spectrum usage in Germany was not available, so the channel status is first estimated by thresholding the original data at −111 dBm, corresponding to constant false alarm rate of 10−5 . The data from the final 100 channels at 12 : 37am, 2 : 37am, 4 : 37am, 6 : 37am, and 8 : 37am on Jan.27th, is used as input for the bandpass sampling architecture. Among the 100 channels, two channels are occupied as shown in Fig.11(a) and Fig.11(b). For the bandpass sampling
A compressive spectrum sensing architecture with bandpass sampling is proposed to detect idle channels in cognitive radio. The bandpass sampling technique enables sub-Nyquist ADCs and simplifies the receiver circuits design. Compared to other compressive sensing architecture, the proposed architecture does not have any Nyquist rate analog circuit components. Numerical results show that the proposed algorithm achieves lower mean detection time compared to the serial search scheme when the channel occupancy rate is low and is a promising alternative when Nyquist rate ADC is not feasible. R EFERENCES [1] J. Ma, G.Y. Li, and B. H. Juang. Signal processing in cognitive radio. Proceedings of the IEEE, 97(5):805 –823, May 2009. [2] A.A. Abidi. Direct-conversion radio transceivers for digital communications. Solid-State Circuits, IEEE Journal of, 30(12):1399 –1410, Dec. 1995. [3] B. Razavi. RF microelectronics. Prentice Hall communications engineering and emerging technologies series. Prentice Hall PTR, 1998. [4] S. J. Shellhammer. Spectrum sensing in ieee 802.22. IAPR Wksp. Cognitive Info. Processing, Jun. 2008. [5] L. Luo, N.M. Neihart, S. Roy, and D.J. Allstot. A two-stage sensing technique for dynamic spectrum access. Wireless Communications, IEEE Transactions on, 8(6):3028 –3037, Jun. 2009. [6] S. Pollin, L. Hollevoet, P. Van Wesemael, M. Desmet, A. Bourdoux, E. Lopez, F. Naessens, P. Raghavan, V. Derudder, S. Dupont, and A. Dejonghe. An integrated reconfigurable engine for multi-purpose sensing up to 6 ghz. In New Frontiers in Dynamic Spectrum Access Networks (DySPAN), 2011 IEEE Symposium on, pages 656 –657, May 2011.
9
[7] D. Cabric, A. Tkachenko, and R. W. Brodersen. Experimental study of spectrum sensing based on energy detection and network cooperation. In Proceedings of the first international workshop on Technology and policy for accessing spectrum, TAPAS ’06, New York, NY, USA, 2006. [8] Z.H. Derafshi, J. Frounchi, and H. Taghipour. A high speed fpga implementation of a 1024-point complex fft processor. In Computer and Network Technology (ICCNT), 2010 Second International Conference on, pages 312 –315, april 2010. [9] I. F. Akyildiz, W. Lee, M. C. Vuran, and S. Mohanty. Next generation/dynamic spectrum access/cognitive radio wireless networks: A survey. Computer Networks, 50(13):2127 – 2159, 2006. [10] D.L. Donoho. Compressed sensing. Information Theory, IEEE Transactions on, 52(4):1289 –1306, Apr. 2006. [11] E. J. Candes. The restricted isometry property and its implications for compressed sensing. Comptes Rendus Mathematique, 346(9-10):589 – 592, 2008. [12] Z. Tian. Compressed wideband sensing in cooperative cognitive radio networks. In Global Telecommunications Conference, IEEE, pages 1 –5, Dec. 2008. [13] M. Mishali and Y.C. Eldar. Wideband spectrum sensing at subnyquist rates [applications corner]. Signal Processing Magazine, IEEE, 28(4):102 –135, July 2011. [14] J. Meng, W. Yin, H. Li, E. Hossain, and Z. Han. Collaborative spectrum sensing from sparse observations in cognitive radio networks. Selected Areas in Communications, IEEE Journal on, 29(2):327 –337, february 2011. [15] J. P. Elsner, M. Braun, H. Jakel, and F. K. Jondral. Compressed spectrum estimation for cognitive radios. Proceedings of 19th Virginia Tech Symposium on Wireless Communications, pages 1–4, June 2009. [16] E. J. Candes and M. B. Wakin. People hearing without listening: an introduction to compressive sampling. IEEE Signal Processing Magazine, 25(2):21 –30, march 2008. [17] M. Mishali, Y.C. Eldar, O. Dounaevsky, and E. Shoshan. Xampling: Analog to digital at sub-nyquist rates. Circuits, Devices Systems, IET, 5(1):8 –20, Jan. 2011. [18] J. Laska, S. Kirolos, Y. Massoud, R. Baraniuk, A. Gilbert, M. Iwen, and M. Strauss. Random sampling for analog-to-information conversion of wideband signals. In Design, Applications, Integration and Software, 2006 IEEE Dallas/CAS Workshop on, pages 119 –122, Oct. 2006. [19] M. Mishali and Y.C. Eldar. Blind multiband signal reconstruction: Compressed sensing for analog signals. Signal Processing, IEEE Transactions on, 57(3):993 –1009, Mar. 2009. [20] Q. Hui and Y. Lun. Bandpass sampling for multiband signal on exponent demodulation function. In Mobile Congress (GMC), 2010 Global, pages 1 –4, Oct. 2010. [21] J.A. Tropp, J.N. Laska, M.F. Duarte, J.K. Romberg, and R.G. Baraniuk. Beyond nyquist: Efficient sampling of sparse bandlimited signals. Information Theory, IEEE Transactions on, 56(1):520 –544, Jan. 2010. [22] A. Y. Yang, A. Ganesh, Z. Zhou, S. Sastry, and Y. Ma. A review of fast l1-minimization algorithms for robust face recognition. CoRR, abs/1007.3753, 2010. [23] I. Loris. On the performance of algorithms for the minimization of l 1 -penalized functionals. Inverse Problems, 25(3):035008, 2009. [24] R.H. Walden. Analog-to-digital converter survey and analysis. Selected Areas in Communications, IEEE Journal on, 17(4):539 –550, Apr. 1999. [25] D.M. Akos, M. Stockmaster, J.B.Y. Tsui, and J. Caschera. Direct bandpass sampling of multiple distinct rf signals. Communications, IEEE Transactions on, 47(7):983 –988, Jul. 1999. [26] C. Ghosh, S. Roy, M. B. Rao, and D. P. Agrawal. Spectrum occupancy validation and modeling using real-time measurements. In Proceedings of the 2010 ACM workshop on Cognitive radio networks, CoRoNet ’10, pages 25–30, New York, NY, USA, 2010. [27] M. Abramowitz and I. A. Stegun. Handbook of Mathematical Functions with Formulas, Graphs, and Mathematical Tables. Dover, New York, ninth dover printing, tenth gpo printing edition, 1964. [28] M.A. Iwen. Simple deterministically constructible rip matrices with sublinear fourier sampling requirements. In Information Sciences and Systems, 43rd Annual Conference on, pages 870 –875, Mar. 2009. [29] M. Wellens and P. Mahonen. Lessons learned from an extensive spectrum occupancy measurement campaign and a stochastic duty cycle model. Mobile Networks and Applications, 15:461–474, 2010.
(a) The detection / estimation performance on 12:37am data with K=4
(b) The detection / estimation performance on 8:37am data with K=4
(c) The detection / estimation performance on 8:37am data with K=5 Fig. 11. Performance of the bandpass sampling architecture on final 100 channels of the Aachen dataset on Jan.27th