Missing Data Interpolation using Compressive Sensing: An Application for Sales Data Gathering Spoorthy.S1 , Sandhyasree Thaskani2 , Adithya Sood3 , M. Girish Chandra1 , and Balamuralidhar.P1 1
TCS Innovation Labs, Bangalore 560 066, India, Email: {s.spoorthy,m.gchandra,balamurali.p}@tcs.com 2 TRDDC, Pune, India, Email:
[email protected] 3 Indian Institute of Management, Indore, M.P., India, E-mail:
[email protected]
Abstract—Tasks like survey analysis involve collection of large amounts of data from different sources. However, there are several situations where exhaustive data collection could be quite cumbersome or infeasible. In this paper, we propose a novel Compressive Sensing (CS)-based framework to recover the original data from less number of collected data points in the case of market or survey research. We utilize the historical data to establish sparsity of the data, and further introduce the concept of logical proximity for better recovery results. Additionally, we also present a conceptual idea towards adaptive sampling by using data stream sketching, which suggests whether the collected data measurements are sufficient or not. The proposed CS-based methodology is tested with toy-sized examples and the results are presented to demonstrate its utility.
I.
I NTRODUCTION
Analysis of data for a particular trend or feature requires collection of huge volumes of data from different sources. In domains like survey research and market research, data collection plays an important role in further data analysis. Often exhaustive data collection in these domains is hindered by the inability to collect data from all possible sources, due to reasons like nonavailability of man-power or difficulty in reaching out to all the sources. As data from all possible sources is necessary for subsequent analysis in such domains, it is necessary to obtain the details of the missing data either through estimation or interpolation. Statistical methods like Maximum Likelihood (ML) estimation and Bayesian Multiple Imputation (MI) are popularly used methods for the estimation of missing data. ML estimation using Expectation Maximization (EM) algorithm has been widely used to estimate unobservable quantities from the collected data (latent data analysis) while imputation methods were alternatives to the ML estimates in filling in the missing data. These
methods have performed well in a range of survey analysis tasks [1], [2]. In this paper, we focus on the problem of obtaining details of uncollected data from a set of collected measurements. We present an alternative novel dataindependent generic framework based on the Compressive Sensing (CS) paradigm. Compressive Sensing (or Compressed Sensing) (CS) is a sampling theory which recovers the original signal with the help of few nonadaptive linear measurements of the signal. The theory states that a few linear measurements obtained from data with a sparse or compressible representation in its native domain or in any transform, using a random sensing matrix are sufficient to recover the original data using basis pursuit or other greedy algorithms [8]. The CS framework was used in imaging and communications theory applications to collect, retrieve and transmit huge amounts of discrete data using fewer compressive sensing measurements. It demonstrated reasonable success in areas ranging from hyperspectral image recovery [7] to reliable data transmission [4]. The Compressive Sensing flavour helped in providing an altogether different perspective, be it for data collection or for data transmission. In this paper, we use the CS paradigm to recover missing data in a survey or market research. For this, we articulate the problem as follows: Let us assume that the original data consists of data from all data sources of interest. The collected or available data is assumed to be a sub-set of this original data obtained through randomized selection process. By this, we mean that the collected data is treated as compressive sensing measurements obtained from the original data through a randomized sampling procedure. We demonstrate that the original data of interest can be obtained to a good accuracy subjecting the collected data to l1 minimization algorithm. By exploiting the linearity of
the CS framework, we suggest how to achieve uniform random sampling, which is essential for good reconstruction accuracy. The design of the randomized sampling matrix is the pivot upon which the Compressive Sensing paradigm is established as data recovery procedure for missing data problems. We also place an additional and crucial premise of logical proximity on top of the data sparsity concept of CS theory to improve the sparseness of the data in the transform domain. By this concept, we imply that data sources with logical data patterns can be grouped together to introduce greater sparsity in the sparse domain. In the whole process, we visualize the sales data of a particular product as an image frame (2D matrix) and the data for different products as a group of frames. We also cross check the sufficiency of the number of measurements by utilizing data-stream sketch; if the number of measurements happens to be less, then additional data can be collected in an “adaptive” way. To further aid the analysis, we visualize the data collected from every source at regular periods as a 2-D matrix. This paper, being based on our earlier patent [10], spell out the aforementioned aspects, which to the best of our knowledge are novel. The rest of the paper is organised as follows: In section II, a brief desciption of CS theory is provided. In section III, Compressive Sensing framework for survey or market research is described. We further describe the concepts of exploiting historical data for sparsity and logical proximity in the section IV and subsection IV-A. Later, we focus on sketching methods to find out the sufficiency of measurements required for efficient data recovery in V. Some discussion and results are provided in VI and VII. The conclusions are provided in the last section. II.
C OMPRESSIVE S ENSING
Consider a real signal x such that x ∈ RN and let us assume it is k -sparse (or k -compressible) in a known domain Ψ, so that it is represented by the following equation x = Ψs
According to CS theory, a few linear non-adaptive measurements, y obtained from the native signal x using a random sensing matrix Φ as y = Φx = ΦΨs
(2)
are sufficient to recover the original signal with nearoptimal accuracy. Gaussian random or the Bernoulli random matrices are popularly used random sensing matrices in the CS literature. These random sensing matrices need to satisfy ‘Incoherence’ property and ‘Restricted Isometry Property (RIP)’ for successful recovery of the original signal x from the collected measurements y . With these random measurements, the factor A = ΦΨ also satisfy the above mentioned properties. When the above conditions are satisfied, the original signal x can then be recovered by subjecting the measurements y to basis pursuit or any other pursuit algorithm, together with the appropriate basis. III.
C OMPRESSIVE S ENSING FOR S URVEYING
We assume that for a certain survey or market research, data needs to be collected from N sources, say, N shops for a given product. This data can be straighforwardly arranged in an N × 1 vector, represented by x. Let us now suppose that a small number of these sources have been visited for data collection due to geographical or man-power constraints. We arrange these sources in an M 0 × 1 vector, represented by y 0 . We can suppose that the measurement vector y is obtained from x due to semi-random sampling. This can be written as y 0 = ϕx
(3)
It is to be noted we are using different ϕ in equation (3) compared to (2) to signify the fact that due to practical limitations and nature of the problem we are considering, this matrix need not be random in the sense of providing uniform random samples. By exploiting the linearity framework of the CS we can obtain improvised random samples by operating y 0 with a random matrix of dimension M × M 0 to arrive at the “final” measurement vector,
(1) y = Θ (ϕ) .x = ΦΨs
The domain Ψ can be the signal’s native domain or some transform domain. Here, s is the representation of x in the domain Ψ. This means, x can be represented using k coefficients (or k largest coefficients, in case of compressible signals) of s in Ψ domain.
(4)
It is important to note that this operation by Θ on is being carried out at the reconstruction end, before feeding it to a pursuit algorithm. This process is really useful since more “effective” randomness in the measurements at the reconstruction side lead to better results. y0
A. Logical Proximity for efficient data recovery With the historical data available, one can try grouping the data with similar sales patterns as nearby pixels in the image frame, rather than lexicographical arrangement. This results in better intra-frame correlation and hence better sparsity. This can be either exploited to give better reconstruction accuracy for a given number of measurements or reduced number of measurements for a given accuracy. A combination trade off is also possible. V.
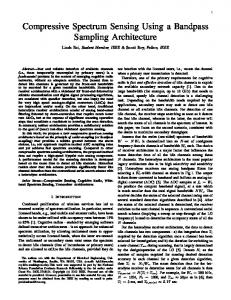
T HOUGHTS ON OBTAINING REQUISITE
MEASUREMENTS USING DATA STREAM SKETCHING
Fig. 1: Sketching method
This obviously implies having more measurements to start with; however, keeping with the practicality of data collection mechanism, this still provides a neat way of utilizing the CS framework. With the mapping to the CS framework being spelt out before applying the CS techniques, we reiterate that it is convenient to visualize and handle the data as image and sequences of images. In this context, we can visualize the data vector x in terms of a data matrix of size L × L, where N = L2 . This facilitates arriving at the sparsifying basis with ease and also to work out the “logical proximity”, which is elaborated in the next section. Further, when we consider the data for different products, we can treat the data for each product as a frame and collectively consider the “Group of Images”, to exploit the correlation among the sales of the products, to finally reduce the amount of data collected. Operating the image matrix with the CS model can also be carried out as suggested in [3], [4]. The reader is referred to VI for additional details. IV.
SPARSITY BASIS AND LOGICAL PROXIMITY
Once the measurement (data) is collected, we can randomize it by Θ and feed it to CS reconstruction algorithms. These algorithms also require the basis in which the data is sparse to carry out the reconstruction. Since we have data model as images, we can try Discrete Cosine Transform (DCT) or Discrete Wavelet Transform (DWT) matrices. Of course, if some historical or similar data is available, one can also establish the appropriate sparsifying basis, by analyzing that data as well.
With the historical data suggesting a guidance on logical proximity and sparsity, we can arrive at the number of measurements using the CS theory. But, it is to be noted that the sales data gathering scenario is dynamic, which can disturb the sparsity over time. One can not be sure that the number of measurements sufficient previously are enough now also, or if it is required to collect more data in the changed circumstance. In order to arrive at the latter decision, it is required to compare the CS reconstructed results with the “correct” results. In the large-scale scenario, which is typical of sales data gathering, let us hypothesize that we can create a summary of the entire sales data and have access to that summary alone. One way to create this summary is through data-stream sketching. The reader is referred to [5], [6]. The analyst or firm interested in validating the data gathering through CS can download the sketch, and compare the requisite number of query results with CS reconstruction results as depicted in Fig 1. If there is considerable discrepancy, one can collect more data, leading to adaptive sampling within our scenario. Further, sketches and the associated results can also guide us in reworking the logical proximity in an “evolutionary” fashion. VI.
D ISCUSSION
A. Extension of the case to multiple products In sections III and IV, we proposed CS model for data recovery for a single product for a large set of shops, given data from few shops. In this section we extend the logic to sales data recovery in the case that data corresponds to the sales of multiple products. In such a case, as was mentioned earlier, we propose to visualize the data corresponding to different products from the shops of interest as a set of frames, akin to
VII.
R ESULTS
We substantiate the working of the proposed model in III, with the help of toy-sized simulation results for the sales data recovery. In this paper, we present the results for sales data recovery in the case of a single product. We present the results of two cases: 1)
Fig. 2: Data Recovery using Randomised sensing matrix ϕ according to equation (4)
2) Fig. 3: Data Recovery using random sensing matrix
the concept of image sequences in a video. That is to say, each product’s sales are arranged in a 2-D matrix, and therefore, if the total number of products are S , then S such images are obtained. Now, we try to exploit the correlation between the sales of different products as thus: the purchase of product A, may be related to the purchase of product B since product B may complement the purchase of A. Exploiting the correlation or interframe redundancy as thus, we observe that collecting sales data from a few shops can help in relating to the sales of other products too. If M measurements are needed to recover a particular class of data, then S products would ideally result in the collection of S × M measurements per shop. However exploiting correlation between the purchase of products results in ˜