COMPUTATION OF A COLLISION PROBABILITY BASED ON A GAUSSIAN MIXTURE MODEL OF THE TLE ACCURACY Romain Garmier(1), Bruno Revelin(1), Paul Legendre(2), Stéphanie Delavault(3), Bruno Vidal(3) , Laurence Lorda(3) (1) Communication & Système, Parc de la Plaine, 5 Rue Brindejonc des Moulinais BP 15872 - 31 506 Toulouse Cedex 5 - France (+33) 5 61 17 64 28,
[email protected],
[email protected] (2) Senior Expert Consultant,
[email protected] (3) CNES, 18, av. Edouard Belin - 31401 Toulouse - France (+33) 5.61.28.33.49,
[email protected],
[email protected],
[email protected] ABSTRACT The TLE catalog distributed by the USSTRATCOM is the largest orbital position catalog for the on orbit objects. The trajectories of the objects are described by the Two Line Element (TLE). These data contain no information about their accuracy. In the framework of the collision risk assessment led by CNES, an estimation of the TLE accuracy has been developed to allow the computation of collision probability required in the conjunction analysis process. We are not able to compute the accuracy of each independent TLE but rather, through a statistical analysis, to derive from a TLE set a density probability function. The density probability function is represented by a Gaussian mixture computed in the conjunction plane and depending on the propagation duration. The mean of each Gaussian function is linearly dependent on the propagation duration whereas the covariance presents a log-linear form. The estimation of the mixture parameters involves 3 methods: the Expectation Maximization algorithm, the Fisher’s score method and the copula method. Then this accuracy model has been used to compute collision probabilities for real conjunction situations. This algorithm is valid for short term encounters. This paper presents the method and analyzes some results in term of variability of the probability. 1. CONTEXT OF THE RESEARCH The spectacular collision between “COSMOS 2251” and “Iridium 33” in early February 2009 illustrates the necessity for space operators to assess this risk in the frame of the monitoring of their satellites. CNES provides a continuous assessment of collision risk between the LEO satellites under its control and the catalogued orbital debris. This assessment relies on the Two-Lines Elements (TLE) database provided by USSTRATCOM [1] and CNES close approach analysis software suite [2]. The validity of the results are obviously strongly dependent on the accuracy of satellite and debris ephemeris used in close approaches determination. CNES knows the ephemeris accuracy of its own satellites but does not know the precision of the orbital parameters derived from the TLE. Moreover the SGP4 extrapolation model used with the TLE is also an additional source of inaccuracy [3]. Since 2005, CNES has been studying a method [5, 6, 7] to determine the TLE accuracy (cf. section 2). We used the following terminology: the primary object is the satellite operated by CNES when the secondary object is the space object, debris or satellite, coming close to the primary object. The close approach geometries may be divided in two categories: the short and long term encounters. In a short term encounter [4], the relative velocity between the two objects is important: the two objects spend only a fraction of second to a few seconds in the encounter region. For the long term case [4], on the other hand, the time spent by the two objects in the encounter region is of the order of the orbital period.
2
C
2
C
1
Each kind of geometry implies a specific method to estimate the collision risk. The following method is only valid for short encounter geometry, very common for LEO encounters. A similar study still needs to be performed for the long term encounter. For the short term encounter, we assume that the relative motion between the two objects is rectilinear. This is obviously wrong for the long term encounter .
Relative Velocity
unc Conj
e Plan tion
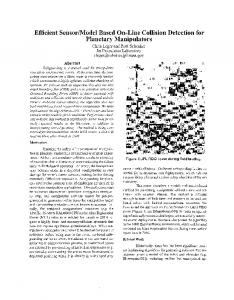
Fig. 1: conjunction plane Given this assumption, the risk evaluation of a close approach between a satellite and a space object may be represented without loss of generality in the conjunction plane [4]. The conjunction plane and its associated frame are defined as follows (fig. 1): • It is the plane orthogonal to the relative velocity of the objects and centered at the primary object position, • The C2 axis is collinear to the vector product of the velocities of both objects: C2 =Vprimary ∧Vsecondary . Practically, this axis is often along the radial direction (depending on the eccentricity of both objects), which is also the best known direction. This definition thus allows a good separation of the error distribution components. • The C1 axis completes the direct orthogonal frame. At CNES, there currently exists two types of methods to evaluate the collision risk [2]: 1. A geometrical method: the safety criterion is an exclusion surface defined in the conjunction plane. 2. A probabilistic method: the criterion is a probability function taking into account the trajectory uncertainties of both objects in terms of Probability Density Function (PDF). Pc =∫∫p(x,y)dxdy,
(1)
S
Where • Pc denotes the collision probability, • (x,y) is the relative position of the primary object with respect to the secondary object in the conjunction plane (C1, C2), • S is the disk of radius R=Rp+Rs , Rp and Rs being respectively the radius of the shortest sphere enclosing the primary and secondary object, • The p function is a PDF taking into account the position uncertainties of the primary and secondary objects.
3
With TLE orbital parameters, the geometric approach may be easily implemented. On the other hand, the probabilistic method requires some additional information, unavailable in TLE: the position accuracy. The present paper focuses on this probabilistic approach. Section 2 focuses on a method to derive the position uncertainties from the TLE. In section 3 and 4, we present two methods to compute Eq. 1. And in the last section, we present some examples of collision probability computation. 2. TLE ERROR ESTIMATION FOR THE SECONDARY OBJECT 2.1 Principle of the method For each catalogued space object, we have a temporal sequence of TLE. The TLE is a specific format containing Keplerian positions and some other information. They are generated by the NORAD on an unknown process using the SGP4 propagation model [3]. No a priori accuracy is given with these TLE, and moreover the SGP4 extrapolation model to be used with is also an additional source of inaccuracy. So we developed a method to estimate this TLE accuracy, called TLE error. The basic idea of the accuracy evaluation is to select, for a given object, a pair of TLE separated by a given duration Δt, typically a few days (corresponding to the delay between the time of closest approach (TCA) and the epoch of the TLE used in the collision assessment tool). This is possible because TLE samples are produced quite regularly. Let the quantities X TLE ( t − ∆t ) and X TLE ( t ) denote the two selected TLE orbital positions. We then propagate the first TLE X TLE ( t − ∆t ) to the date of the second one (fig. 2), using NORAD extrapolation models SGP4. We finally compute the difference from the propagated TLE to the second one: ∆XTLE( t,∆t ) =Xpropagated(t −∆t,t)−XTLE( t )
.
(2)
We consider this difference as an evaluation of the TLE accuracy that we call “TLE error”. We compute these TLE errors in an orbital local reference frame with a first component along the velocity vector, the second one along the radial axis and the third one along the kinetic momentum of the local orbit. Note that the TLE error component along the second axis (fig. 3) is biased and is dependent on the TLE error component along the first axis. This is due to the deviation of the trajectory with respect to the satellite velocity. The bias is increasing with the distance between the TLE. It introduces a distortion in the TLE error distribution. We then correct the second TLE error component by adding a correction coefficient [5, 6] while keeping a Cartesian coordinate representation centered on the local orbital frame. Practically, we also introduce an additional delay δt corresponding to the on-orbit position (or argument of latitude (AOL)): indeed the time of close approach is directly related to a specific AOL of the object, and it has been noted that the TLE error can be strongly dependent on this parameter, due to the orbital perturbations (effect of the eccentricity, atmospheric drag, …) and also to the orbit determination process (location of the tracking data along the orbit). We repeat this process for all admissible pairs of TLE of an object and thus we obtain an error distribution consistent with a given propagation duration. We finally filter the TLE distribution to eventually remove inconsistent points and we project the TLE errors from the local orbital frame to the conjunction plane. For the rest of the paper, we simplify the notation, by writing the ith TLE error vector Xi rather than ΔXi. This vector is expressed in the conjunction frame.
4 Osculator circle at the trajectory
AOL of TCA ∆X > 0
TLEref
δ 0
TLE 1
t
r ∆Y + δ
∆XTLE (∆t, AOL)
TLE 2
TLE
time t1
t2 ∆t (TCA)
t3
δt (AOL)
Fig. 2: sketch of the TLE error estimation
Fig. 3: curvature correction. The X component is along the velocity direction t and the Y along the radial axis r.
2.2 Some examples of TLE errors We exhibit two examples of TLE error distributions computed from a one year sequence of TLE. On Fig. 4 are shown TLE errors with a propagation duration of 3±0.4 days, component C 2 with respect to C1. Fig. 4a is a typical case: the distribution cloud presents an ellipse pattern. The C1 extremes are 10 times more important than the C2 extremes. Fig. 4b presents an atypical but not so rare pattern. On fig. 5, we represent the variation of TLE errors components with respect to the propagation duration. The sampling rate of TLE is interested. For a typical case (fig. 5a), the sampling is very regular but for some propagation durations, there is less TLE errors than for others and the TLE errors distribution with respect to the propagation duration takes a sinusoidal modulation shape. Fig. 5b presents an atypical case characterized by a rather irregular sampling and the absence of TLE errors at some propagation duration.
(a) typical case
(b) atypical case
Fig. 4: TLE errors along axis C2 with respect to TLE error along axis C1 with a propagation duration fixed to 3±0.4 days.
5
(a) typical case
(b) atypical case
Fig. 5: TLE errors with respect to the propagation duration (axis C1 on the top and axis C2 bottom) for a typical and atypical case. 3. TLE errors approximation by a Gaussian Mixture Model (GMM) independent of the propagation duration 3.1
Standard collision probability formula
As stated in introduction, the probability may be computed in the conjunction frame. The origin of this frame coincides with the primary object. Let Xobs be the observed position vector of the secondary object with respect to the primary object position in this frame. Its norm is the close approach distance. The observed position includes the error δp on the primary object position (i.e. the origin of the frame is shifted from -δp) and the error δs on the second object position. The real position of the secondary object with respect to the primary one should be: X real =Xobs −( δs −δp ) .
(3)
Usually, we choose to represent the position uncertainties by a normal law g(Mp, Σp) of mean Mp and covariance matrix Σp for the primary object and the equivalent normal law g(Ms,Σs) for the secondary object. Using Eq. 3 and combining both normal laws, we obtain the collision probability integral:
(
)
t −1 1 Pc=∫∫ exp −1 ( X −(Xobs −Ms +M p) )⋅( Σp +Σs ) ⋅( X −(Xobs −Ms +M p) ) dX. 2 S 2π det( Σp +Σs )
(4)
This integral may be conveniently approximated by:
(
)(
) (
)
S Pc≈ exp −1 t Xobs −Ms +M p ⋅ Σp +Σs −1⋅ X obs −Ms +M p . 2 2π det Σp +Σs
(
)
(5)
A close examination of the error distribution reveals that the fit of the distribution by a single normal law is poor (obvious with fig. 4b): the central peak of the distribution is badly represented by a Gaussian function and the very likely consequence is a wrong estimation of the probability collision. Instead of using a single Gaussian function, we propose to use a weighted summation of Gaussian functions, called Gaussian Mixture Model (GMM). First, mathematically speaking, any continuous
6
function may be represented by a Gaussian series, the main problem being to find the efficient number of Gaussian functions and to estimate the associated modeling parameters. Second, the approximation used to compute Eq. 5 with a single Gaussian function may be easily generalized to a GMM. 3.2 Collision probability with a Gaussian Mixture Model independent of the propagation duration The GMM is defined by: (6)
G α d(X j)= ∑ αig(X j,Μi,∑i)+ 0 , V i=1 • Xj a TLE error vector of Cartesian components (components along C1 and C2 axes). • d(Xj ) is the probability density generating Xj. • G is the number of Gaussian functions in the mixture • • •
The coefficients αi are the weights of the Gaussian functions so that
G
∑α =1 (see below for i
i =0
the definition of α0 coefficients). g denotes a normal law with mean vector Mi and covariance matrix Σi. 0 The last term α V is a uniform law with weight α0 and a constant V. The constant V is the volume of the smallest parallelepiped enclosing the whole set of data.
The purpose of the uniform law is to deal with TLE errors points that do not fit well into the Gaussian functions. This law will be removed from the GMM for the collision probability computation. Moreover, as the uniform law does not depend on Xj, it will dwarf the tails of the Gaussian functions for very large values of Xj. With such a GMM, the collision probability would be: G
Pc≈S∑αi ⋅g( 0,Xobs −Mi +M p,( Σi +Σp ) )
(7)
i =1
As the uniform law is removed from the collision probability formula, the weights of the Gaussian functions are renormalized to ensure a summation equal to one. To simplify the notation, we use the same αi notation than the one of Eq. 6, but the reader should keep in mind that this coefficient was renormalized. The principal difficulty of the GMM lies in the estimation of the modeling coefficients, which are: the weights, means and covariance matrices for the different Gaussian functions of the mixture. They may be estimated from the TLE error distribution by using the Stochastic Expectation Maximization (SEM) algorithm [7, 10]. The SEM Algorithm is an iterative way to estimate the TLE error probability density by maximizing the log-likelihood of the GMM. Its aim is to find a good combination of variables {α 0, (αi,, Mi, Σi), i=1,…,G}, giving the most appropriate GMM representing the set of data. Its initialization is crucial because the estimated solution is not necessarily a global optimum. To avoid to be trapped into a local maximum of the likelihood function, the SEM algorithm is using a
7
stochastic shooting. As a consequence if we estimate several times a GMM from the same TLE errors set, we obtain different results. The variability of the results will be studied in section 5. This GMM formulation was used on a large number of cases. We determined that we did not need to use more than a 4 Gaussian functions mixture [5]. Moreover, for a constant number of TLE errors, to increase the number of terms in the GMM decreases the quality of the GMM parameters estimation. So for each object, we estimate the 2, 3 and 4 terms GMM. We choose the best mixture as the one maximizing the Bayesian Information Criterion: BIC= 2LogV – Nlog(q),
(8)
Where: • V is the likelihood of the considered mixture, • N is the number of free parameters of the system (for a 2D GMM with G Gaussian functions, N=6G), • q is the number of TLE error used in by the SEM algorithm. The BIC, a classical criterion in model selection, makes a compromise between the goodness of fit through the logarithm of the likelihood and the number of parameters to estimate (the number of modeling parameters increases with the number of Gaussian functions of the GMM). The whole implementation of the SEM algorithm may be found in [5, 6] and [10]. Unfortunately, this GMM formulation is subject to two serious drawbacks: First, by setting the value of the propagation duration, we limit the amount of TLE errors obtained, thus reducing the quality of the estimated parameters (i.e. we do not use all the available information contained in the data). Second, as illustrated in Fig. 5b (a rare case though, as usually the sampling rate is more important), some objects present a rather strictly regular TLE sampling in time, thus producing too few TLE errors for certain specific duration propagation. The next step consists in introducing a propagation duration dependency in the GMM. For the GMM with a fixed propagation duration, a passable parameter estimation requires between 300 and 500 TLE errors. For most space debris, with a propagation duration fixed to 3±0.4 days, this amount of TLE errors is obtained from 1 year of TLE. In comparison, if we select the TLE errors with a propagation duration between 0.5 and 6 days, we obtain between 2000 and 4000 TLE errors. The parameters estimation quality should rise accordingly! Instead of including a propagation duration within the GMM, the first idea is to increase the length of the TLE selection. For LEO object, we worked with a complete solar cycle set of TLE but this appeared to be inappropriate: the SGP4 models are known to be very poor for the atmospheric drag modeling. A solar cycle is a too long period. For example during this period a satellite may be operated with altitude corrections. The accuracy of its position changes. Some debris are also decaying and, thus the atmospheric drag is increasing with time. We logically observed that the position uncertainties of debris are more important for low altitudes. Moreover, when we want to estimate a collision risk, we are more interested in the recent trajectory uncertainties than that of some years ago, especially if the secondary object has experienced different physical environments! So we limited the TLE sequence to one year. This limitation is also very positive for the computation time. 4) COLLISION PROBABILITY WITH A GAUSSIAN MIXTURE MODEL DEPENDING OF THE PROPAGATION DURATION
8
The introduction of the propagation duration in the GMM is mathematically difficult, especially because of the two dimensions GMM (2D-GMM) parameters estimations. So we restricted the problem in two 1D-GMM (i.e. one dimension per axis of the conjunction plan) depending on the propagation duration (Eq. 9)
d(X j,∆t j)=∑αi g(X j,µi (∆t j),σi(∆t j))+ α0 . i =1 V G
(9)
In Eq. 9, Xj is a TLE error component along axis C1 or C2. The function g is now a 1D Gaussian with mean μi and standard error σi. As we are in one dimension, V is a segment instead of a surface. According to Eq. 1, we need a two 2D-PDF to compute a collision probability. We propose to reconstruct the 2D problem from the two 1D-GMM by using the copula method. 4.1 1D-GMM depending on the propagation duration We first choose an evolution model of the mean and the covariance with respect to the propagation duration. After analyzing several cases, it is natural to propose: • a mean with a linear dependency with respect to the propagation duration µi(∆t j)=β0,i +β1,i∆t j ,
(10)
Where β0,i and β1,i are the modeling coefficients to estimate. •
a standard error with a log-linear dependency with respect to the propagation duration : σi2(∆t j)=exp(γ0,i +γ1,i ∆t j) ,
(11)
γ0,i and γ1,i are also modeling coefficients. To estimate the modeling coefficients {αi, β0,i, β1,i , γ0,i, γ1,i} we modify the previous SEM algorithm into a special algorithm called “Stochastic Fisher’s Score Expectation Maximization algorithm” (SFSEM). It is mixing two algorithms: • The Stochastic Expectation Maximization (SEM) algorithm, • The Fisher Score’s method (FS) [7, 9]. The SEM algorithm is distributing the Xj TLE errors among the different Gaussian functions (i.e. estimating the αi weights) while the Fisher’s Score method is evaluating the mean and standard error for each Gaussian function. The comments of section 3 are still valid. We continue to estimate mixtures with 2, 3 and 4 terms and to choose the best one with the Bayesian Information Criterion. On fig. 6a, we show an example of TLE errors along the C 1 axis (colored points) with respect to the propagation duration. We estimate the parameters of a 2 terms Gaussian mixture. The colors indicates the membership to one of the 2 Gaussian functions. The vertical lines represent three times the standard error of each Gaussian function and the inclined lines represent the means. An important step is to check the validity of ours hypotheses about the mean and standard errors evolution with respect to the propagation duration dependency (Eqs. 10, 11). As each TLE error belongs to a single Gaussian function, we correct them by removing the propagation dependency. A reduced TLE error is then defined by: ~ X j −µi(∆t j) X j= σi(∆t j) .
(12)
9
If the hypotheses are right, the distribution of the reduced TLE errors is a normal law of mean 0 and standard error 1. As seen on fig. 5b, the fit between the reduced TLE error distribution and the normal law is very good. We checked it successfully on different kinds of objects (satellites, space debris, rocket bodies…).
(a)
(b)
Fig. 6 : NORAD 147. (a) TLE errors along C1 axis with respect to the propagation duration. The colors show the repartition of the TLE errors between the two Gaussian functions. The black lines represent the mean and standard error variation of each Gaussian function of the mixture. (b) histogram of the reduced TLE error derived from fig. 6a. The red line represents the normal law with mean 0 and standard error 1. 4.2 Reconstruction of a 2D probability by the copula method We now present the reconstruction method of a 2D-PDF from two 1D-PDF also called marginal laws. The used method is known as the copula method and is based on the Sklar’s theorem [11] stated that if D(X≥x, Y≥y) is a 2 dimensions distribution with two continuous marginal laws, then there exists a unique function C, called copula function with the following property: D( X,Y )=C( F( X ),G( Y )) ,
X ,Y are reals
(13)
D is the 2D distribution and is defined from d, a 2D-PDF (in our case a 2D-PDF depending on the propagation duration) by: (14)
X Y
D( X,Y ) = ∫ ∫d(x, y)dxdy . −∞ −∞
We do not explicitly define this function here as we will not need its analytical formulation. The 1D marginal laws are defined by: X
F(X)=Ylim D( X,Y ) = ∫f(x)dx , →+∞ −∞
Y
D( X,Y ) = ∫g(y)dy . and G(Y)=Xlim →+∞ −∞
(15)
10
where f and g are the 1D-GMM defined in Eq. 9. The F and G functions are the cumulative distribution function (CDF) (they fulfills 0≤F(X)≤1 and 0≤G(Y)≤1). As a matter of fact, the copula function is a kind of 2D repartition function and is then linking the X coordinates to the Y coordinates. For the collision probability, we do not need a distribution function D but the PDF d, which is the derivative of the distribution D with respect to X and Y:
d( X,Y ) =c( F( X ),G( Y ) )⋅f ( X )⋅g( Y ) , with c( u,v) =
∂2C( u,v) . ∂u∂v
(16) (17)
where u, v are the coordinates change (u,v)=(F(X), G(Y)). The function c is called copula density [11]. When the function d, f and g are analytically defined, we may deduce from Eq. 13 the formula of c. In our case, we do not know the d function and we have to use a numerical estimation of copula density c presented later in the section. If u and v were totally uncorrelated, the copula density would equal to one. The pattern of the distribution would be homogeneous in the plane [0 1]x[0 1]. As u and v are indeed correlated, the pattern depends on the correlation type. We now apply the formula 16 to collision probability computation:
Pc ≈π( R d +R s ) ⋅c( F(0),G( 0) )⋅f ( 0)⋅g( 0) , 2
(18 )
Where:
f ( 0) =∑α′k g( 0,δ1 +µ'k,σ'k ) , G
k =1
g( 0) =∑α′k′g( 0,δ2 +µ'k' ,σ'k' ) G
(19)
k =1
The quantities (δ1, δ2) are the coordinates of the secondary object in the conjunction plane reference frame. The parameters { α'k,µ'k,σ'k } and { α'k' ,µ'k' ,σ'k' } are the Gaussian parameters describing the 1D Gaussian mixtures along the two axes C1 and C2. Up to now, we do not explicit the analytical formula of the copula or its density but we just stated that such a function should exist. We propose to estimate its value at the point (F(0),G(0)) by a very simple numerical process: we consider all the points (u,v)=(F(X), G(Y)), (X, Y) being the TLE error components in the conjunction plane. The copula density may change with the propagation duration, so we determine the copula density for the (u,v) points with a quasi-fixed propagation duration (for example between 2.6 and 3.4 days). Then the density copula is estimated by:
11
c( F( 0),G( 0) ) = NNuv Nu Nv
(20)
where • • • •
N is the total number of TLE errors. Nuv is the number of points with: u ∈ [F(0)-Δ, F (0)+Δ], v ∈ [G(0)-Δ, G(0)+Δ]. Nu is the number of points with: u ∈ [F(0)-Δ, F(0)+Δ]. Nv is the number of points with: v ∈ [G(0)-Δ, G(0)+Δ].
The half-bandwidth Δ is adjusted with respect to the number of points with the help of the Friedman Diaconis formula: (21)
−1
∆=N 3 IQR(X) The IQR function is the Interquartile Range.
In fig. 7a, we show an example of TLE errors projected in the conjunction plane. The primary object is located at the origin. Fig. 7b represents the same TLE errors represented with the (u,v) coordinates. The corresponding estimated copula density is 1.5. For any space object, the density copula is generally between 0.5 and 2. Copula density smaller than 0.5 are considered abnormal, probably due to a lack of TLE errors in the area of computations. For this example, the density copula is denser over the diagonal area. It means, that very often, u and v present quiet close values. As u and v actually are repartition values, it means that the repartition of C1 components is close to the one of C2 components. For example, a large value of C1 is associated to a large value of C2. Other kinds of patterns (uniform repartition, X repartition…) were observed. We also observed a few exotic patterns that may be explained by the overall orbital behavior of the satellite during its life time (for example an important change of altitude).
(a) TLE errors projected in the conjunction plane. The primary object is located in (0,0).
(b) (u,v) representation
Fig. 7 : NORAD 14814. (a) TLE errors projected in the conjunction plane. (b) (u,v) transformation of the TLE errors. The red star is the place where is computed the copula density (here c=1.5). The red lines encompass the area used in copula density estimation. 4.3 Example of probability reconstruction
12
We validate the reconstruction method in the 2D case, without considering the propagation duration: our aim is just to evaluate the performance of the probability reconstruction. So the 2D probability and 2D reconstructed probability are computed from the same TLE errors set. We take real close approach geometry and a 2D mixture with two components obtained from a space debris (i.e. with realistic parameters). The mixture is considered as a test mixture and is used to generate a thousand simulated TLE errors. We then estimate a 2D Gaussian mixture and the two 1D Gaussian mixtures and derive the three following collision probabilities: • The 2D theoretical probability from the test mixture, • The 2D probability from the 2D estimated mixture, • The 2D reconstructed probability from the two 1D mixtures. This process enables a comparison between both estimated probability (2D and reconstructed), which is a way to quantify the quality of the GMM estimation. We generally obtained a correct accordance between the probabilities. As an example, we show some comparisons of iso-probabilities curves: we compute maps of collision probabilities in the conjunction plane for all three kinds of probabilities and extracted the iso-probabilities curves (values 10-5.5, 10-6 and 10-6.5). We represented these iso-curves on a same plot (fig. 8). The agreement between probabilities is relatively good. Of course, the 2D reconstructed probability presents fluctuation while the two others look like ellipses. This behavior is due to the copula density estimation: as we used points counting, the copula density presents discrete values.
Fig. 8 : iso-probabilities curves in the conjunction plane. The back dotted lines corresponds to the theoretical probability, the green lines to the 2D probability and the blue lines to the 2D reconstructed probability. The value of the iso-probability are the log10 of the probability. Not presented here are other studies concerning the number of TLE errors to use, the variability of the results. It appears, very logically, that if we increase the number of TLE errors, the fit between the three probabilities is better. A correct agreement between probabilities seems to be obtained with a minimum of 500 TLE errors. We also notice that for large distances between the primary and secondary object, the 2D and 2D reconstructed probabilities differ significantly from the theoretical probability. This behavior is predictable: we represent correctly the TLE errors distribution peak but the GMM are less accurate for the distribution tails where the number of TLE errors is very small! This is not problematic as the obtained collision probabilities are very low anyway, posing no collision threat.
13
The validation realized here shows that when using the same number of TLE errors, the 2D reconstruction probability is not too far from the 2D probability. We should not forget that we have introduced the 2D reconstruction in order to increase the number of TLE errors used in the GMM estimation. So in a real case, the 2D reconstruction probability should be better than the 2D one. 5.
ANALYSIS OF THREE CASES OF COLLISION PROBABILITY
We present now three examples of probability computation by the reconstruction method. As stated in section 3, the GMM estimation algorithm includes a stochastic shooting: computing several times the GMM parameters estimation gives different results. Of course the GMM are quiet close but we now want to quantify this effect on the probability computation. For each close approach cases, we compute 50 times the 2D reconstructed collision probability (fig. 9). For the conjunction between NORAD 20436 and NORAD 29103, the mean probability is 1.8 10-5 with a maximum of 2.5 10-5 and a minimum of 1.5 10-5. The variability is small. On the next conjunction (NORAD 20436 – NORAD 4133) the mean probability is 2.9 10-9 with boundaries [5.6 10-10 8.9 10-8]. On the last case, this variability is catastrophic with a probability range between [1013 10-8]! To understand the origin of this variability, for each conjunction plane axis, the value of the GMM (consistent with the 1D collision probability) is charted with respect to the close approach distance (fig. 10 and 11) for the conjunction 20436-29103 and 20436-25158. The colored lines represent the GMM. The colors indicate the number of Gaussian functions of the considered GMM (red for two Gaussian functions and green for 3. There is no case here with 4 Gaussian functions). The red dotted line represents the real close approach used to compute fig. 9.
Fig. 9: 2D reconstructed probabilities computed 50 times for 3 conjunctions The SEM and SFSEM algorithm are known to provide a good GMM estimation for the peak of the distribution but are rather inaccurate at the distribution tails simply because the TLE errors there are, by definition, not numerous. So from an estimation to the other one, the tail estimation is bad. To illustrate this, we compute for each 1D-GMM, the domain containing 99% of the GMM (we compute the CDF of 1D-GMM and search the distance boundaries containing 99% of the domain. These boundaries are centered on the distance given CDF=0.5). We represent these boundaries by the blue points on fig. 10 and 11. The GMM outside these boundaries represent less than 1% of the distribution. We easily see that the variability begins to be important outside this domain but is limited inside. It is now clear that the conjunction 20436-29103 presents a low variability because the close approach distance is within the domain for both conjunction axes. On the contrary, with conjunction 25260-25158 both close approach distances are outside the domain D. The case 284944133 is an intermediary case (not presented here) with the close approach distance along C 1 inside the domain and the component along C2 outside. It would have been satisfying to be able to provide a collision probability with a known uncertainty. The uncertainties may not be derived because of the SFSEM algorithm complexity. Another option consists to realize multiple shooting but this has a cost in term of computation time that is not fully
14
compatible with an operational use (large number of conjunctions to process). On the other hand, the computation of the domain in which the GMM are well defined is costless and comparison of the boundaries position with respect to the close approach distance component is useful.
Fig. 10: conjunction 20436 – 29103. 1D collision probabilities with respect to the close approach distance components for axis C1 and C2. The curves are computed for 50 shooting.
Fig. 11: conjunction 25260 – 25158. 1D collision probabilities with respect to the close approach distance components for axis C1 and C2. The curves are computed for 50 shooting. 6.
CONCLUSION
We presented a method to compute a collision probability in the conjunction plane from a sequence of Two Line Elements. This method is valid for the short encounter geometry. We represent the position uncertainties along C1 and C2 axis by a 1D-GMM depending on the propagation duration. We compute a one dimension probability collision along each conjunction plane axis and then we reconstruct a 2D collision probability by a method known as Copula method. The GMM representation ensures a better fitting of the TLE error distribution than a single Gaussian function. The propagation duration dependency maximizes the number of used TLE errors. The drawback of the method is the impossibility to compute a 2D-GMM so we have to reconstruct the 2D problem from the 1D-GMM. We are able to do it without degrading too much the accuracy. We are not able to derive a probability uncertainty but at least, we know how to compute a close approach distance domain in which the quality of the GMM parameters estimation is good. So for this close approach domain, we are sure that the collision probability is accurate.
15
The proposed method needs to be applied to a large number of close approaches so the time efficiency for a collision probability computation is important. On a standard PC, we are able to compute the probability with one year of TLE errors in 45 seconds. This time is acceptable. This paper deals with the probability collision. In the future, we also have to determine the detection probability in order to determine the alarm threshold. Complementary studies of detection performance will be realized in 2010 to qualify the method for an operational used. If a probability is larger than this threshold, the encounter is considered potentially dangerous and requires action (more study, or radar observation of the debris). Another important axis of work is to develop an equivalent approach for the long term encounter. 7. REFERENCE [1] Space Track , The Source For Space Surveillance, http://www.space-track.org/ [2] Laporte F., Sasot E., “Operational management of collision risks for LEO satellites at CNES”, SpaceOps 2008, held May 12-16, 2008, Heidelberg, Germany, paper AIAA-2008-3409 [3] Hoots, F. R., Roehrich, R. L.., “Spacetrack Report N°3 – Models for Propagation of NORAD Element Sets”, December 1980, Package Compiled by Kelso, T. S, 31 December 1988. [4] Chan F.K. “Spacecraft Collision Probability”, AIAA book, the aerospace press 2007 [5] Legendre P., et al., “Two Line Element accuracy assessment based on a mixture of Gaussian functions”, AIAA/AAS Astrodynamic Specialist Conference, held August 21-24, 2006, Keystone, Colorado, USA, paper AIAA2006-6518 [6] Legendre P. et al., “Improvement of the Two Line Element accuracy assessment based on a mixture of Gaussian functions”, AAS/AIAA Astrodynamic Specialist Conference, held August 1923, 2007, Mackinac Island, Michigan, USA, paper AAS07-390 [7] Garmier R. et al. “Improvement of the TLE accuracy model based on a Gaussian mixture depending on the propagation duration” AAS/AIAA Astrodynamic Specialist Conference, held August 19-23, 2008, Hawai, USA, paper AAS08-6772 [8] Patera R.P, “General Method for Calculating Satellite Collision Probability”, Journal of Guidance, Control and Dynamics, Volume 24, Number 4, pages 716-722 [9] A.P. Verbyla, “Modelling Variance Heterogeneity : Residual Maximum Likelihood and diagnostics”, J.R. statis. Soc 55, p493-508, 1993 [10] G. G. Celeux and J. Diebolt, “The SEM algorithm: a probabilistic teacher algorithm derived from the EM algorithm for the mixture problem”, Comput. Statist. Quater. 2, pp. 73-82, 1985. [11] R.B. Nelsen , “An introduction to copula”, book, springer-verlag, 2006.
BACK TO SESSION DETAILED CONTENTS
BACK TO HIGHER LEVEL CONTENTS