Int. J. Naval Archit. Ocean Eng. (2013) 5:188~198 http://dx.doi.org/10.3744/JNAOE.2013.5.2.188
ⓒSNAK, 2013
A method of inferring collision ratio based on maneuverability of own ship under critical collision conditions Youngjun You1, Key-Pyo Rhee2 and Kyoungsoo Ahn3 1
Ship & Ocean R&D Institute, Daewoo Shipbuilding & Marine Engineering, Seoul, Korea Dept. of Naval Architecture and Ocean Engineering, Seoul National University, Seoul, Korea 3 Hyundai Maritime Research Institute, Hyundai Heavy Industries, Ulsan, Korea
2
ABSTRACT: In constructing a collision avoidance system, it is important to determine the time for starting collision avoidance maneuver. Many researchers have attempted to formulate various indices by applying a range of techniques. Among these indices, collision risk obtained by combining Distance to the Closest Point of Approach (DCPA) and Time to the Closest Point of Approach (TCPA) information with fuzzy theory is mostly used. However, the collision risk has a limit, in that membership functions of DCPA and TCPA are empirically determined. In addition, the collision risk is not able to consider several critical collision conditions where the target ship fails to take appropriate actions. It is therefore necessary to design a new concept based on logical approaches. In this paper, a collision ratio is proposed, which is the expected ratio of unavoidable paths to total paths under suitably characterized operation conditions. Total paths are determined by considering categories such as action space and methodology of avoidance. The International Regulations for Preventing Collisions at Sea (1972) and collision avoidance rules (2001) are considered to solve the slower ship’s dilemma. Different methods which are based on a constant speed model and simulated speed model are used to calculate the relative positions between own ship and target ship. In the simulated speed model, fuzzy control is applied to determination of command rudder angle. At various encounter situations, the time histories of the collision ratio based on the simulated speed model are compared with those based on the constant speed model. KEY WORDS: Collision avoidance system; Collision risk; Collision ratio; Critical collision; Slower ship’s dilemma; Maneuverability.
NOMENCLATURE AIS ARPA B DCPA IMO Lpp NB NM NS
Automatic Identification System Automatic Radar Plotting Aids Breadth (m) Distance to the Closest Point of Approach International Maritime Organization Length between Perpendiculars (m) Negative and Big membership function Negative and Medium membership function Negative and Small membership function
Corresponding author: Youngjun You e-mail:
[email protected]
PB PM PMB PMS PS T TCPA V m
Positive and Big membership function Positive and Medium membership function Positive and Medium Big membership function Positive and Medium Small membership function Positive and Small membership function Draught (m) Time to the Closest Point of Approach Velocity (knots) Mass of ship
Int. J. Naval Archit. Ocean Eng. (2013) 5:188~198
I zz U
δ η
u u&
v
Inertia of ship about z axis Linear velocity of origin of body axes relative to fluid Rudder angle Ratio of u / U Component U in direction of the x-axis Time rate of change of u Component U in direction of the y-axis
189
v&
r
r& xG X Y N
Time rate of change of v Angular velocity component of the z-axis Angular acceleration component of the z-axis Distance of center of gravity from origin of body axes Force component along x-axis (longitudinal force) Force component along y-axis (lateral force) Yawing moment
INTRODUCTION The number of elements which should be considered by a navigator to avoid ship collisions is increasing, due to the increasing diversity of vessel types, sailing of high speed vessels, and increasing number of ships. As a result, the incidence of collision accidents due to wrong decisions by navigators has steadily increased. When collision accidents of a ship occur, the loss of human life and property and the damage due to environmental pollution are potentially large. Because there is a high risk of collision accidents between ships, it is necessary to develop a collision avoidance system, in order to assist navigators in ensuring sailing safety. Many kinds of collision avoidance algorithms which are based on the ship domain concept proposed by Fujii and Tanaka (1971), fuzzy reasoning model proposed by Iwasaki and Hara (1986) and differential game method proposed by Miloh (1974) have been developed. Briefly, they can be divided into four categories. Firstly, the indices to determine the time for starting the collision avoidance maneuver are defined, and methods to infer the indices are proposed. Collision risk, which is based on DCPA and TCPA information, was proposed by Iwasaki and Hara (1986). Collision risk refers to the subjective judgment on the degree of risk by the watch officer in the encounter situation. Secondly, simulations to obtain collision avoidance trajectories have been performed by considering ship dynamics, where the inferred indices are used to judge the time for starting the collision avoidance maneuver. Fuzzy control, which is based on human control characteristics, has been proposed by Hasegawa (1987). Thirdly, optimizations of the avoidance paths have been performed. Lee and Rhee (2001) applied an A* search algorithm for finding an optimal path. Fourthly, an intrinsic problem in the existing collision avoidance algorithms is recognized by some researchers when the own ship encounters the burdened target ship which is faster than own ship and uncontrollable. Miloh and Sharma (1975) defined this problem as the slower ship’s dilemma. At sea, to ensure safety of own ship, her course needs to be changed, if burdened target ship cannot change her course. These emergency cases are known as critical collision conditions. The slower ship’s dilemma occurs under the critical collision conditions when the target ship is faster than own ship. To solve the dilemma, Miloh and Sharma (1975) proposed the longer barrier, which is used for determining the time to start the collision avoidance maneuver, in these critical collision conditions. Since then, the slower ship’s dilemma is also perceived by Perera et al. (2011). Simulations have been performed at different encounter situations with various speed conditions, to improve the reliability of the collision avoidance algorithm proposed by Lee and Rhee (2001). The results show that the collision risk according to Lee and Rhee’s (2001) inference method is not able to consider the slower ship’s dilemma under critical collision conditions, because it is not possible to consider an uncontrollable target ship by using a combination of DCPA and TCPA. It is necessary to fix the fault in the collision avoidance algorithm. In this paper, the concept of a new index, based on numerical simulation by considering own ship’s maneuverability, is proposed to fix the intrinsic fault of the collision avoidance algorithm (2001). The new index is objectively obtained to avoid using the empirical method. The time at which the collision avoidance maneuver should be started is inferred and determined by considering the various encounter situations, maneuverability and speed loss. The new index is called the collision ratio, which refers to the expected ratio of unavoidable paths to total paths under suitably characterized operational conditions. Total paths are determined by considering action categories, such as action space and methodology of avoidance. The International Regulations for Preventing Collisions at Sea (1972) and Cockcroft and Lameijer (2001) are considered to determine the action categories. When own ship follows each avoidance path, we ascertain whether or not a collision accident actually occurred, by calculating the relative positions of the own ship and the target ship. A constant speed model denotes that the position of the
190
Int. J. Naval Archit. Ocean Eng. (2013) 5:188~198
own ship is determined by multiplying the initial speed of own ship and time interval △t without considering the own ship’s dynamics. In a simulated speed model, however, the position of the own ship is determined by solving maneuvering equations of motion, and fuzzy control is applied to determine the command rudder angle to follow the avoidance path. The speed loss of the own ship can be considered in the simulated speed model. Time histories of the collision ratio based on the simulated speed model are compared with those based on the constant speed model at different encounter situations. Time histories of the collision ratio according to the methodology of avoidance are analyzed. Finally, the time histories of the collision ratio are compared at different encounter situations for different speed conditions. From these results, the concept of a new index, which can overcome the slower ship’s dilemma and different encounter situations, is proposed.
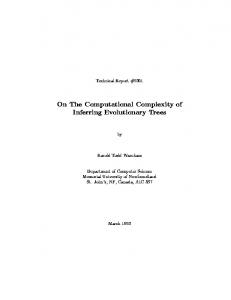
COLLISION RISK BASED ON FUZZY INFERENCE METHOD Fig. 1 shows coordinate systems used in this study. Simulations are performed to identify the limitations of the inferred collision risk based on the fuzzy inference method of Lee and Rhee (2001). This is calculated at different encounter situations such as head-on, crossing (own ship is the give-way vessel) and crossing (own ship is the stand-on vessel) situation. The target ship is assumed to be a cruise ship similar to the own ship, and has the same length (Lpp), breadth (B) and velocity (V) as the own ship. Fig. 2 shows the designed initial conditions. The own ship always moves from (-5000,0) to (5000,0) at 23.5 knots as shown in Fig. 2. The speeds of the target ship are 11.75, 23.5 and 35.25 knots respectively. And the target ship goes straight because the target ship is assumed to be uncontrollable. Table 1 shows the initial positions of the target ship according to encounter situations and the target ship’s speeds. In these initial conditions, DCPA and non-dimensional DCPA are always zero because the center of own ship and that of the target ship intersect at (0,0) when both ships do not change their course. Also, time histories of TCPA and non-dimensional TCPA are identical even though encounter situations and encounter speeds are different. From these conditions, whether or not the collision risk can consider the slower ship’s dilemma can be analyzed. The target ship is assumed to be an uncontrollable ship in order to consider the critical collision condition. The collision risk is calculated every 0.5 second interval.
Fig. 1 Coordinate systems.
Fig. 2 Designed initial conditions.
Table 1 Initial positions of the target ship. Encounter situation
11.75 knots
23.5 knots
35.32 knots
Head-on
(2500, 0)
(5000, 0)
(7500, 0)
Crossing (give-way)
(0, 2500)
(0, 5000)
(0, 7500)
Crossing (stand-on)
(0, -2500)
(0, -5000)
(0, -7500)
Int. J. Naval Archit. Ocean Eng. (2013) 5:188~198
191
Table 2 Reasoning rules for the collision risk. TCPA/(L/V)
DCPA/L
NB
NM
NS
PS
PMS
PM
PMB
PB
PS
0.0
0.0
0.0
1.0
0.8
0.6
0.4
0.2
PMS
0.0
0.0
0.0
0.8
0.6
0.4
0.2
0.2
PM
0.0
0.0
0.0
0.6
0.4
0.2
0.2
0.2
PMB
0.0
0.0
0.0
0.4
0.2
0.2
0.2
0.2
PB
0.0
0.0
0.0
0.2
0.2
0.2
0.2
0.2
Non-dimensional DCPA and TCPA membership functions proposed by Lee and Rhee (2001) are used to infer the collision risk. However, all negative values in the reasoning rules are set to zero, as shown in Table 2. If TCPA is less than zero, it is judged that own ship never collides with the target ship using the fuzzy inference method. According to Table 2, the collision risk is inferred from 0.0 to 1.0. Fig. 3 shows the time histories of the collision risk at head-on situations with different target ship speeds. It can be seen that all of the time histories of the collision risk at head-on situations are the same. Fig. 4 shows the time histories of the collision risk at crossing situations with different target ship speeds. “Give-way” is the status of the own ship. In this encounter situation, according to the collision avoidance rules (2001) own ship should avoid the target ship. It can be seen that all of the time histories of the collision risk at crossing (give-way) situations are the same. Fig. 5 shows the time histories of the collision risk at crossing situations with different target ship speeds. “Stand-on” is the status of the own ship. In this encounter situation, according
Fig. 3 Time histories of collision risk at head-on situations for different speed conditions.
Fig. 4 Time histories of collision risk at crossing (give-way) situations for different speed conditions.
Fig. 5 Time histories of collision risk at crossing (stand-on) situations for different speed conditions.
192
Int. J. Naval Archit. Ocean Eng. (2013) 5:188~198
to the collision avoidance rules, the target ship should avoid own ship. It can be known that all the time histories of the collision risk at crossing (stand-on) situations are the same. And Figs. 3, 4 and 5 show identical time histories of the collision risk because the collision risk is inferred from the combination of DCPA and TCPA. Consequently, it can be concluded that collision risk based on the fuzzy inference method is not able to consider critical collision conditions. So, it is impossible to overcome the slower ship’s dilemma.
DEFINITION OF THE COLLISION RATIO AND INFERENCE PROCEDURE Definition of the collision ratio The collision ratio is defined as the expected ratio of unavoidable paths to total paths under suitably characterized operational conditions. The action space is regulated according to the collision avoidance rules (2001). The number of total paths is 90. And each path is from current heading angle to ±90 degrees in the action space by 1 degree interval. The unavoidable path can be found by calculating the relative positions of own ship and the target ship when the own ship follows the avoidance path based on the simulated speed model. Consequently, the collision ratio is expressed as a number from 0.0 to 1.0. As the number of unavoidable paths increases, the collision ratio closes to 1.0. The inferring procedure of the collision ratio will be explained in detail in the following section. Inference procedure of the collision ratio Five stages are involved in inferring the collision ratio as shown in Fig. 6. In Stage 1, the information of the target ship is acquired from an Automatic Identification System (AIS) or Automatic Radar Plotting Aids (ARPA) device. It is assumed that the position, speed and heading angle of the target ship are deterministic values. In Stage 2, action categories such as action space and methodology of avoidance are determined, according to the encounter situation. Firstly, encounter situations are classified based on the expert system used in the research of Lee and Rhee (2001). This classification is developed from the categories of encounter situation proposed by Koyama and Yan (1987). Table 3 shows the action categories according to encounter situations. The action space in Table 3 means avoidable direction of own ship according to the International Regulations for Preventing Collisions at Sea (1972) and the collision avoidance rules (2001). At head-on and crossing (give-way) situations, own ship is burdened. Accordingly, her course should be changed to the starboard side. On the other hand, own ship is not burdened at crossing (stand-on) and overtaking situations. Nevertheless, the course of own ship needs to change to ensure its safety, if the course of the burdened target ship cannot be changed. According to the collision avoidance rules (2001), at a crossing (stand-on) situation, the course of the own ship should not be changed to her port side. The own ship should change her course to the starboard side. However, the course of the own ship can be allowed to change to the port side, in an overtaking situation under critical collision condition. The paths range from current heading angle to ±90 degrees in the action space, because own ship always tries to move forward based on the original path.
Fig. 6 The procedure of inferring the collision ratio.
Int. J. Naval Archit. Ocean Eng. (2013) 5:188~198
193
Table 3 Action categories according to encounter situations. Action categories
Encounter situations
Action space
Head-on
STARBOARD
Crossing (give-way)
STARBOARD
Crossing (stand-on)
STARBOARD
Overtaking (give-way)
STARBOARD
Overtaking (stand-on)
PORT
Methodology of avoidance
Change of heading angle Or Change of speed and heading angle
The methodology of avoidance refers to how to avoid the target ship, of which there are two methods. The first method involves only changing the heading angle. The second method involves changing both the speed and heading angle of the own ship. At sea however, many navigators would prefer to avoid target ships by only changing their heading angle. The effect of the methodology of avoidance on the collision ratio will be shown in this paper, and the reason why navigators try to avoid target ships by only changing the heading angle will be explained as shown in Figs.12 to 14. The number of total paths is 90. And each path is from current heading angle to ±90 degrees in the action space by 1 degree interval. In Stage 3, only one path is chosen among the total paths at a corresponding encounter situation. In Stage 4, we ascertain whether or not a collision accident actually occurred, by calculating the relative positions of the own ship and the target ship when the own ship follows the avoidance path based on the simulated speed model. Stages 3 and 4 are repeated to obtain the number of unavoidable paths among the total paths. In Stage 5, the collision ratio is calculated from the ratio of unavoidable paths to total paths.
MODEL SHIP AND MANEUVERING EQUATIONS OF MOTION A model cruise ship is used to estimate the maneuverability of the own ship, as shown in Fig. 7. The principal properties and design speed of the cruise ship are shown in Table 4. The scale ratio of the model ship is 1/28. The maneuvering equations of motion for the model cruise ship are shown in Eq. (1).
Fig. 7 Model cruise ship. Table 4 Principal properties of cruise ship. Properties (Units)
Lpp (m)
B (m)
T (m)
V (knots)
Scale ratio
243.0
36.0
8.4
23.5
1/28
194
Int. J. Naval Archit. Ocean Eng. (2013) 5:188~198
m(u& − vr − x r 2 ) = X G m(v& + ur + x r&) = Y G I r& + mx (v& + ur ) = N zz G
(1)
3-Degree of Freedom (D.O.F.) maneuvering equations for surge, sway and yaw are used. Each hydrodynamic derivative at 23.5 and 11.0 knots is obtained from experimental results performed at Hyundai Heavy Industries. The experiments are conducted for 11.0, 23.5 knots. X, Y and N equations are shown in Eq. (2). X ' = X 'η (1 − η ) + X 'ηη (1 − η ) 2 + X 'ηηη (1 − η )3 + X 'vv v '2 + ( X 'rr + m ' xG ') r '2 + X 'δδ δ POD 2 + ( X 'vr + m ')v ' r '+ X 'vvη v '2 (1 − η ) + X 'δδη δ POD 2 (1 − η ) Y ' = Y '0 + Y 'v v '+ Y 'vvv v '3 + Y 'vrr v ' r '2 + (Y 'r − m ')r '+ Y 'rrr r '3 + Y 'rvv r ' v '2 + Y 'δ δ POD + Y 'δδδ δ POD 3 + Y 'η (1 − η )
(2)
+ Y 'ηη (1 − η ) 2 + Y 'δη δ POD (1 − η ) + Y 'δηη δ POD (1 − η ) 2 N ' = N '0 + N 'v v '+ N 'vvv v '3 + N 'vrr v ' r '2 + ( N 'r − m ' xG ')r '+ N 'rrr r '3 + N 'vvr v '2 r ' + N 'δ δ POD + N 'δδδ δ POD 3 + N 'η (1 − η ) + N 'ηη (1 − η ) 2 + N 'δη δ POD (1 − η ) + N 'δηη δ POD (1 − η ) 2
Maneuvering simulation results at different speeds by using Eqs. (1) and (2) are shown in Table 5. In addition, maneuvering simulation results at the design speed are compared with International Maritime Organization (IMO) maneuvering standards. The maneuverability of the own ship meets all the IMO maneuvering standards at the design speed, and the model cruise ship has very high maneuverability. Table 5 shows that small differences exist according to speeds. In this study, it is assumed that the maneuverability of the own ship is the same as that at the design speed, even if there is a speed loss when the course of the own ship is changed. Table 5 Maneuvering simulation results of the model ship and IMO maneuvering standards. PORT/STBD
IMO standards
Speed (knots)
23.5
11.0
23.5
Initial track reach (Lpp)
1.29
1.29
2.5
Advance (Lpp)
2.53
2.49
4.5
Transfer (Lpp)
0.98
1.03
-
Tactical diameter (Lpp)
2.31
2.39
5.0
1st overshoot angle (10°/10°) (Degree)
9.52
6.8
15.05
2nd overshoot angle (10°/10°) (Degree)
14.68
13.2
30.05
1st overshoot angle (20°/20°) (Degree)
18.24
12.9
25.00
Int. J. Naval Archit. Ocean Eng. (2013) 5:188~198
195
SIMULATION RESULTS Effect of constant speed model and simulated speed model on the collision ratio Simulations are performed to calculate the effect of the constant speed model and simulated speed model on the collision ratio at different encounter situations such as head-on, crossing (give-way) and crossing (stand-on) situations. The own ship always moves from (-5000,0) to (5000,0) at 23.5 knots, while the speed of the target ship is 23.5 knots, too. The initial positions of the center of the target ship are also shown in Table 1. The target ship is assumed to be an uncontrollable ship to consider the critical collision condition. The collision ratio is calculated every 0.5 second interval. Figs. 8, 9 and 10 show the time histories of the collision ratio at head-on, crossing (give-way) and crossing (stand-on) situations respectively, when both the constant speed model and simulated speed model are used. A collision ratio of 1.0 means that the own ship cannot avoid the target ship, even if own ship follows any path from 0 degree to 90 degrees. When calculation of the collision ratio commences, the collision ratio is not zero; this derives from the initial condition for making a collision accident if neither ship changes its course. By analyzing Figs. 8, 9 and 10, two common characteristics can be described. Firstly, the collision ratio rapidly increases as the own ship closely approaches the target ship. This means that the number of safe avoidance paths is rapidly reduced when the own ship closely approaches the target ship. This has a relation with the slow dynamic characteristics of the ships. In other words, when the rudder angle of own ship is changed, its heading angle cannot be changed simultaneously. Secondly, the collision ratio based on the simulated speed model becomes 1.0 earlier than when the collision ratio is based on the constant speed model. For the head-on situation, the collision ratio of 1.0 is reached at 334 seconds for the simulated speed model, but at 399.5 seconds for the constant speed model. For the crossing (give-way) situation, the collision ratio of 1.0 is reached at 325.5 seconds for the simulated speed model but at 393.5 seconds for the constant speed model. For the crossing (stand-on) situation, the collision ratio of 1.0 is reached at 314 seconds for the simulated speed model, but at 393.5 seconds for the constant speed model.
Fig. 8 Time histories of collision ratio at head-on situations.
Fig. 9 Time histories of collision ratio at crossing (give-way) situations.
Fig. 10 Time histories of collision ratio at crossing (stand-on) situations.
Fig. 11 Time histories of collision ratio at head-on, crossing (give-way) and crossing (stand-on) situations, based on the simulated speed model.
196
Int. J. Naval Archit. Ocean Eng. (2013) 5:188~198
These are derived from the assumption of the constant speed model: because the own ship is assumed as a vector without considering its dynamics, it can immediately follow the avoidance path in the constant speed model with constant speed. In reality, it takes more time to follow the path, and own ship’s speed is dropped when own ship changes her course. Consequently, it should be necessary to consider the own ship’s dynamics to consider the maneuvering characteristics such as speed loss. Fig. 11 shows the time histories of collision ratio at head-on, crossing (give-way) and crossing (stand-on) situations, based on the simulated speed model. The collision ratios based on the constant speed model only are slightly different according to encounter situations. On the other hand, the collision ratios based on simulated speed model are 1.0 at 334 seconds, 325.5 seconds and 314 seconds at head-on, crossing (give-way) and crossing (stand-on) situations, respectively. The collision ratios based on the simulated speed model are slightly different according to encounter situations. This means that encounter situations and the effect of speed loss can be potentially considered in the collision ratio. All of the following collision ratios are calculated with the simulated speed model. Effect of methodology of avoidance on the collision ratio Simulations are performed to calculate the collision ratio according to the methodology of avoidance at different encounter situations. In methodology 1, only the heading angle of the own ship is only changed. In methodology 2, both the heading angle and speed are changed. The own ship always moves from (-5000,0) to (5000,0) at 23.5 knots. And the speed of target ship is 23.5 knots. The initial positions of the center of the target ship are also shown in Table 1. To consider the effect of speed reduction on the collision ratio, it is necessary to determine the command speed of the own ship. The command speed of own ship is determined as 4.7 knots for speed reduction, which is 20% of the design speed. In this paper, speed reduction involves that the navigator attempts to decrease the speed of a ship by intentionally controlling the propeller RPM. Therefore, the speed reduction is different to the speed loss. Because large ships are generally towed by tug boats under 6 knots in a restricted area, 4.7 knots is assumed as the minimum speed controlled by navigators.
Fig. 12 Time histories of collision ratio at head-on situations according to the methodology of avoidance.
Fig. 13 Time histories of collision ratio at crossing (give-way) situations according to the methodology of avoidance.
Fig. 14 Time histories of collision ratio at crossing (stand-on) situations according to the methodology of avoidance.
Int. J. Naval Archit. Ocean Eng. (2013) 5:188~198
197
Figs. 12, 13 and 14 show the time histories of the collision ratio at head-on, crossing (give-way) and crossing (stand-on) situations respectively according to the methodology of avoidance. For head-on situations, the own ship becomes slightly dangerous because more time is needed to escape from the target ship’s path since own ship’s speed has slowed. For two crossing situations, the collision ratios are significantly different to that for a head-on situation. When the own ship is remote from the target ship, reducing own ship’s speed is a more convenient way to keep a safe distance, so the collision ratio is zero at an early stage. In reality however, it can cause a wrong decision, rendering a late collision avoidance maneuver. When the own ship closely approaches the target ship, the collision ratio rapidly increases. This reduces the ability for the own ship to avoid the target ship, because the own ship cannot easily escape from the target ship’s path. Consequently, because of these problems, speed reduction is not considered in determining the time to start the collision avoidance maneuver. Effect of the encounter situations on the collision ratio Simulations are performed to calculate the collision ratio at different encounter situations such as head-on, crossing (giveway) and crossing (stand-on) situations, for different speed conditions. The own ship always moves from (-5000,0) to (5000,0) at 23.5 knots. The speeds of the target ship are 11.75, 23.5 and 35.25 knots, respectively. And the target ship goes straight because the target ship is assumed to be uncontrollable. The initial positions of the target ship’s center are set to cross the own ship’s center at (0,0). Table 1 shows the initial positions of the target ship according to encounter situations and the target ship’s speeds. From these initial conditions, a comparison can be made to determine whether the collision ratio is changed according to the encounter situations. Further, the characteristics of the collision ratio can be compared with those of collision risk. The collision ratio is calculated every 0.5 second interval.
Fig. 15 Time histories of collision ratio at head-on situations for different speed conditions.
Fig. 16 Time histories of collision ratio at crossing (give-way) situations for different speed conditions.
Fig. 17 Time histories of collision ratio at crossing (stand-on) situations for different speed conditions. Figs. 15, 16 and 17 show the time histories of the collision ratio at head-on, crossing (give-way) and crossing (stand-on) situations respectively, for different speed conditions. For head-on and crossing (give-way) situations, the collision ratio is almost the same, where these results show that the collision ratio is not advantageous if the own ship is burdened. No significant diffe-
198
Int. J. Naval Archit. Ocean Eng. (2013) 5:188~198
rences are shown. For crossing (stand-on) situations, the collision ratio is different significantly as the target ship’s speed is increased. Ratios of 11.75, 23.5 and 35.25 knots at target speed are 1.0 at 333.5 seconds, 314 seconds and 260 seconds, respecttively. These results match well with those of the research proposed by Miloh and Sharma (1975). From these characteristics of the collision ratio, it is possible to overcome the slower ship’s dilemma.
CONCLUSION A new index, termed as the collision ratio, is proposed based on the consideration of ship dynamics, while results which are based on both the constant speed model and the simulated speed model are analyzed. The collision ratio according to the methodology of avoidance is also analyzed. The collision ratio at various encounter situations for different speed conditions is also obtained and analyzed. In this study, three conclusions are found. Firstly, it is necessary to use the simulated speed model to consider the maneuvering characteristics such as maneuverability and speed loss. The constant speed model is advantageous to decrease calculation time, but it cannot consider the speed loss of the own ship when the course of own ship is changed. In real sailing, this can result in a late decision to avoid the target ship because the ability of the own ship to avoid the target ship can be overestimated. Secondly, the collision avoidance by reducing own ship’s speed is disadvantageous. When the own ship closely approaches the target ship, the collision ratio rapidly increases. It also causes the late collision avoidance maneuver. The consideration of speed reduction is not considered in determining the time to start collision avoidance maneuver. Thirdly, the collision ratio can overcome the slower ship’s dilemma and the different encounter situations. In addition, empirical functions are not necessary to consider the slower ship’s dilemma.
ACKNOWLEDGEMENTS The authors would like to thank the Research Institute of Marine System Engineering, Brain Korea 21 project, and the Korea Shipbuilding Research Association for their support in preparing the materials in this study.
REFERENCES Cockcroft, A.N. and Lameijer, J.N.H., 2001. A guide to the collision avoidance rules. 6th ed. Elsevier. Fujii, Y. and Tanaka, K., 1971. Traffic capacity. Journal of Navigation, 24(4), pp.543-552. Hasegawa, K. and Kouzuki, A., 1987. Automatic collision avoidance system for ships using fuzzy control. Journal of the Kansai Society of Naval Architects, 205, pp.1-10. Iwasaki, H. and Hara, K., 1986. A fuzzy reasoning model to decide the collision avoidance action (in Japanese). The Journal Japan institute of Navigation, 75, pp.69-77. Koyama, T. and Yan, J. 1987. An expert system approach to collision avoidance. Proceedings 8th Ship Control System Symposium. Hague, Netherlands 6-9 October 1987. Lee, H.J. and Rhee, K.P., 2001. Development of collision avoidance system by using expert system and search algorithm. International Shipbuilding Progress, 48(3), pp.197-212. Miloh, T., 1974. Determination of critical maneuvers for collision avoidance using the theory of differential games. Institut für Schiffbau der Universität Hamburg, Bericht, Nr.319. Miloh, T. and Sharma, S.D., 1975. Maritime collision avoidance as a differential game. Institut filr Schiffbau der Universitltt Hamburg, Bericht, Nr.329. Perera, L.P., Carvalho, J.P. and Guedes Soares, C., 2011. Fuzzy logic based decision making system for collision avoidance of ocean navigation under critical collision conditions. Journal of Marine Science and Technology, 16(1), pp.84-99.