ductor ignored in the theoretical computation, and this explanation has been confirmed quantitatively by measuring the sheet resistivity of the experimental strips ...
299
PROCEEDINGS LElTERS
ACKNOWLEDCMEM The authors wish to thank the technical staffs of the Nippon Electric Co., Ltd., IC Division, for useful discussions andfor providing the experimental samples.
HIDEKIHASEGAWA’ MIEKOFURUKAWA HISAYOSHI YANAI Dep. of Electron. Eng. University of Tokyo Tokyo, Japan
t
REFIXENCEB [I] H. Guckel, P. A. Brennan,and I. Pakk-z, “A parallel-platewaveguideapproach to microminiaturized planar transmission lines for integrated circuits,’’ IEEE Truns. Microwuoe-TheoryTech., vol. m - 1 5 , Aug. 1%7, pp. 468476. [2] I. T. Ho and S. K. Mullick, “Analysis of transnission lines on integratedcircuitchip,” IEEEJ. Solid-State circuits, vol. SC-2, D e c . 1967, pp. 20-208. [3] M. V. Schneider, “Microstrip lines for microwave integratedcircuits,” Bell Syst. Tech. 1..vol. 4 8 , May 1969, pp. 1421-1444. [4] A. R. von Hippel, Dielecrrics and Wanes. New York: Wiley, 1954, p. 228.
10’
‘ Presently with Dep. of El=.
Eng., Hokkaido University, Sapporo, Japan
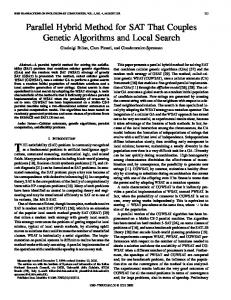
Fig. 4. Slowing factor versus width-to-height ratio o/b.Open circles: experimental values. Solid lines: theoretical values. Dashed lines: slowing factor in the infinitely wide strip case. 1: delay data in 121.
quantity is also equal to the ratio of the propagationvelocity to the light velocity in vacuum. As Seen from the figure, the propagation velocity is constant and very slow in the lower frequency region. Let this region be defined as the slow mode region.In the figure,the propagationvelocity in the slow mode region is from approximately 1/15 to 1/20 of the light velocity, and is essentially smallerthan thatof TEM propagation through the SiO, of the Si layer. While the values of thecharacteristicimpedance and propagation velocity appear to be almost independent of the substrate resistivity in this region, the upper frequency limit of the region lo-’ R.cm clearlydependsupon it, and becomesmaximumforthe sample, extending into the low-gigaherz region. Outside the slow mode region, the characteristic impedance increases with frequency for higher resistivity and decreases for lowerresistivity. Further, the attenuation constant in the mid-frequency range increases approximately in proportion to the square of the frequency, and is minimum for the lo-’ Q.cm sample. All these features are qualitatively in good agreement with the numerical result [I 1. Disagreement inthe attenuation constantin the lowfrequency regioncan be explained by the finite resistanceof the strip conductor ignored in the theoretical computation, and this explanation has been confirmed quantitatively by measuring the sheet resistivity of the experimental strips. Further, the slow wave propagation velocity was measured varying the strip width, and the result is plotted in Fig. 4 in terms of the slowing factor defined by &,/leversus the width-to-height ratio a/b.The thickness ratio b,/bz is held nearlyconstant forall the samples withinthe range from 4x to 5 x Thepropagation delay data in [2] are alsoincluded in the figure. Solid lines give the theoretical values based on the quasistatic approach using theformulaformicrostrip fringingfields 131. Agreement betweenthe theory and the experiment is generally good, both indicating a decrease in the slowing factor due to the fringing effect with a decreasing width-to-heightratio. In conclusion, the slow wave mode does propagate along the microstrip line on Si-SiO, systems, with its upper frequency limit depending on the substrate resistivity. This mode of propagation seems to be of great importance to the current monolithic IC‘s, judging from the values of resistivity and frequency usually employed. The physical mechanism of slow wave propagation can be attributed to thelargeeffectivedielectric constantdue to thestrong interfacial polarization (Maxwell-Wagner mechanism [4]), from which there results a slow surface-wave-like propagation. A detailed theoretical and experimental analysis of t h i s type of line, including the slow mode mechanism and the behavior ofother fundamentalmodes, will be presented in a forthcoming paper.
Computation of Spectra with Unequal Resolution Using the Fast Fourier Transform Abstract-The discrete Fourier transform of a sequence, which can be computed using the fast Fourier transform algorithm, represents samples of the ztransform equally spaced around the unit circle. In this letter, a technique discussed is and illustrated for transforming a sequence to a new sequence whose discrete Fourier transform is equal to samples of the z transform of the original sequence at unequally spaced angles around the unit circle.
In manyapplicationswe are concerned withthe problem of computing samples of the z transform of a sequence on the unit circle. To obtain samples equuZly spaced around the unitcircle, the most efficient procedure is to compute thediscrete Fourier transform( D m using the fast Fourier transform (FFT) algorithm.’ If we are interested in obtaining samples equally spaced within a particular region of the unit circle, then one efficient procedure consists of using the chirp z-transform algorithm.2 Often we would like to obtain samples that are unequally spaced-correspondthe original sequence. ing, for example, to a constantQ spectral analysis of An algorithm for accomplishing this with an efficiency similar to that achievable with the FFT algorithm is not known. One procedure sometimes used is to evaluate thesamples explicitlyat the desired frequencies. Another procedure used is to add equally spaced frequency samples in bands. A related alternative procedure corresponds to implementing a spectral analysis of the sequence with a recursive or nonrecursive 6lter bank. This letter is directed toward a procedure that perhaps is slightly more efficientthan the alternative just mentioned, and mayalso have some advantages when considering hardware implementation of a spectral analysis with nonuniformresolution. The procedureconsists of transforming theoriginal sequenceto a new sequence havingthe property that its DFT is equal tosamples of the z transform of the original sequenceat unequally spaced anglesaround the unit Manuscript reoeived June1 I , 1970; revisedJuly 30,1970. A.Oppenheim andD. Johnson were supported in partby the Joint Services Electronics Programs under Contract DA-28043-AMC4253W) and by the U.S. Air Force Cambridge Research Laboratories, Oflice of Aerospace Researcb, under Contract F1%28-69€-0044. K. Steiglitz was supported in part by the U.S. Army Research Oflice, Durham, N. C., under Contract DAHCW-69C0012. ’ J. W. Cooley and I. W. Tukey, “An algorithm for the machine calculationof compkx Fourier series,” Murh. Cornput., vol. 19, pp. 297-301, April 1965. L. Rabiner, R. Schafer,and C. Rader, “The chirpr-transformalgorithmand its applications,” Bell Sysr. Tech. J., vol. 48, pp. 124S1292, May-June 1969.
’
PROCEEDINGS OF THE IEEE,FEBRUARY
300
1971
~ i r c l e Lettingf(n) .~ represent the original sequence, and g(k) represent the transformed sequence, we consider linear transformations between f ( n ) and g(k) corresponding to expandingf(n)in terms of a set of linearly independent sequences $k(n) so that
The basic property thatwe would like this transformation to have is that the transform of the sequence f(n) and the z transform of the sequence g(k) are related by a change of variables, so that on the unit circle,if
712
+m
G(ejm) =
g(k)e-jmL k=-m
and
I
C
0
HI2
I 7
0
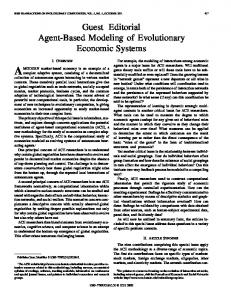
Fig. 1. Distortion offrequency for several values of a.
then
so that (2)
G(eiec")) = F ( 6 .
Consequently,what is requiredthat is the Fourier transform of f(n) and the Fourier transformof g(k)be related by a distortionof the frequency axis. It can be shown that the requirement placed on the set of functions $ k ( n ) such that (2) is satisfied is that
(3) where
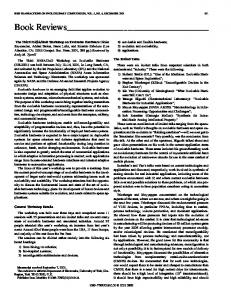
Fig. 2. All-pass network used to impkment a distortion offrequency the
axis.
frequency variableCk Since a computationof the DFT of the new sequence q ( k ) corresponds to sampling uniformly in o,the frequency samples ob' tained will correspond to nonuniform sampling in the ori-1 frequency variable R Fig. 1shows the functione(R) for several valuesof the parameter a. For the remainder of the discussion, we will assume that f(n) and g(k) are both zero for n