Zhang C, Zheng G, Xu SF et al. Computational challenges in characterization of bacteria and bacteria-host interactions based on genomic data. JOURNAL OF COMPUTER SCIENCE AND TECHNOLOGY 27(2): 225–239 Mar. 2012. DOI 10.1007/s11390-012-1219-y
Computational Challenges in Characterization of Bacteria and Bacteria-Host Interactions Based on Genomic Data Chao Zhang1 (张 潮), Member, ACM, IEEE, Guolu Zheng2 (郑国铝), Shun-Fu Xu3 (徐顺福) and Dong Xu1,∗ (许 东), Member, IEEE 1
Department of Computer Science, Christopher S. Bond Life Sciences Center, University of Missouri, Columbia MO 65201, U.S.A.
2
Department of Agriculture and Environmental Science, Lincoln University, Jefferson City, MO 65101, U.S.A.
3
Department of Gastroenterology, The First Affiliated Hospital of Nanjing Medical University, Jiangsu 210029, China
E-mail:
[email protected];
[email protected];
[email protected];
[email protected] Received September 20, 2011; revised December 3, 2011. Abstract With the rapid development of next-generation sequencing technologies, bacterial identification becomes a very important and essential step in processing genomic data, especially for metagenomic data. Many computational methods have been developed and some of them are widely used to address the problems in bacterial identification. In this article we review the algorithms of these methods, discuss their drawbacks, and propose future computational methods that use genomic data to characterize bacteria. In addition, we tackle two specific computational problems in bacterial identification, namely, the detection of host-specific bacteria and the detection of disease-associated bacteria, by offering potential solutions as a starting point for those who are interested in the area. Keywords bacteria, bacteria-host interaction, metagenomics, 16S rRNA gene, Faecalibacterium, Helicobacter pylori, combinatorial entropy
1
Introduction
As the largest domain of all living organisms on earth, bacteria are estimated to have more than five nonillion (1030 ) individuals worldwide[1] , which are far more than previous estimations of the total number of bacteria[2] . These single-cell organisms can be found everywhere, e.g., deep sea, hot springs, human gut, and even in radioactive waste[3] . Due to close connections between bacteria and human life, we cannot live without them and actually benefit from the microorganisms in many cases, e.g., food production, human health[4] , environmental sciences[5] , and chemical industry[6-7] . On the other hand, pathogenic bacteria are one of the most serious threats to human life. For example, tuberculosis, the most common fatal bacterial disease, kills about 2 million people every year[8] . Since 1676, when Antonie van Leeuwenhoek first observed bacteria, scientists have never stopped exploring the micro-world. The task of identification and classification of bacteria
remains challenging because bacteria are invisible to naked eyes and cannot be easily differentiated morphologically. During the past two decades, DNA sequencing technologies have become a powerful tool for scientists to take up the challenge. In 1995, when John Craig Venter just started to sequence the first bacterial genome — Haemophilus influenza[9] , DNA sequencing was extremely difficult and time consuming. The common thought at the time was that it would be sufficient to build a gene pool of the whole microbial community from just a few dozen representative genomes. Today, thanks to new sequencing technologies, more than 1 600 microbial whole genome sequences have been released and many more bacterial genome-sequencing projects are ongoing[10] . With the accumulation of bacterial genomic data, the focus of microbial genomics (study of genomes of microorganisms including archaea, bacteria and fungi) is shifting from single genome to pan-genome (gene pool of a particular species) and meta-genome (environmental
Survey This work was partially supported by the National Institute of Health of USA under Grant No. R21/R33 GM078601, USDA NIFA’s Evans-Allen Grant (Project NO: MOX-Zheng) under Grant No. 0223248, and International Exchange and Cooperation Office of Nanjing Medical University of China. ∗ Corresponding Author ©2012 Springer Science + Business Media, LLC & Science Press, China
226
J. Comput. Sci. & Technol., Mar. 2012, Vol.27, No.2
gene/species pool). However, the explosion of data has not answered all the questions of researchers in this field. It becomes evident that these data just revealed a tip of the iceberg for the bacterial world. In-depth analysis of these data is needed to help better understand the genome diversity and dynamics of bacteria, interactions between bacteria and their hosts/environments, and the pathogenicity of pathogens. Meanwhile, the unprecedented amount of genome data also poses major challenges for computational analysis, which is an essential tool for microbial genomics. In fact, computational methods for massive genomic sequence analysis have become a bottleneck of microbial genomics. In this review, we will focus on computational methods for bacterial characterization (i.e., identification and classification), based on sequencing data with consideration of bacteria’s hosts and environments. While this topic has been brought up in recent publications[11-16] , no in-depth review has been presented. Bacterial identification through detecting variations of genome sequences across different species/genus is a very important and essential step of analyzing genomic data, especially for metagenomic data. First, we will discuss existing computational tools and their limitations for bacterial identification. As bacteria evolve rapidly in response to the environments, bacterial adaptations to different environments/hosts will reflect in their genome sequences. Many bacteria, even belonging to the same species, still show extensive genomic plasticity and diverse pathogenicity. For example, three different E. coli strains, laboratory strains E. coli MG1655, enterohemorrhagic E. coli EDL933, and an uropathogenic strain E. coli CFT073, share only 39.2% common genes[17] . Thus, in the second part of this review, we will assess the practical computational methods for detecting the sequence variations of bacteria in different environments for a given species. Finally, we will dissect the evolutionary dynamics of bacterial virulence and review the methods for identification of genetic markers in bacterial DNA sequences that are associated with a disease or host. 2 2.1
Bacterial Identification Background
In the past, analysis of microbial communities was a complicated task due to their high diversity and inaccessibility via culturing. The emerging next-generation sequencing technologies provide a potential way for doing this analysis on a routine basis[12] . The Human Microbiome Project[18] , which began in May 2007, aimed to survey the microbial communities that colonize the human body. Currently, over 100 similar metagenomic projects are ongoing, covering microbial communities of
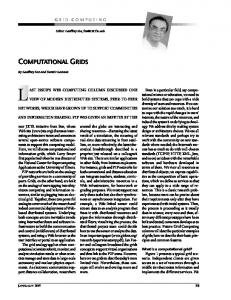
skin and several tracts, including gastrointestine, genitourinary tract, oral cavity, nasopharynx, and respiratory tract[12] . These studies will undoubtedly provide new insight into many aspects of complex microbial communities, such as metabolic capabilities of microorganisms, co-evolution of bacteria and host, communication of microbial cells and so on[16] . Although metagenomics is still in its early stage, this emerging field has already discovered many surprises in microbial genomics and microbiology[16] . Among the extensive genomic sequencing data of microbial communities generated by various metagenomic projects, approximately 62% of the bacteria that can be identified from the human intestine were previously unknown and 80% of them are not cultivatable[19] . Due to the explosion of metagenomic data, DNA sequence-based identification and classification are becoming more and more important in exploring microbial diversity. In the 1970s, DNA-DNA hybridization was introduced to differentiate bacterial species. Any two bacterial strains with more than 70% DNA-DNA hybridization were considered to be the same species. Later, with the development of new sequencing techniques, Carl Woese pioneered other criteria for bacterial identification[20] . For example, the 16S ribosomal RNA (rRNA) gene is highly conserved in bacteria and archaea, and was used for identification and discovery of pathogens starting from 1990[21] . Nowadays, 16S rRNA gene is also widely used for phylogenetic studies[22] . However, due to the limitations of 16S rRNA gene, other genetic markers have been employed for bacterial identification, e.g., multilocus sequence typing (MLST)[23] . Recently, whole genomebased methods have been developed for bacterial identification. Despite these advances, complete genome sequence is not easily obtained[24-25] . The 16S rRNA gene, a molecular clock, has a relatively slow evolutionary rate of 1% sequence divergence per 50 million years. It is around 1 500 nucleotides in length and contains 9 hypervariable regions[26] (Fig.1) as well as conserved regions interspersed with the variable ones. In terms of similarity of 16S rRNA gene sequences, bacteria within the same genus and species usually share about 95% and 97% pairwise sequence identities, respectively[27] . Because of the consistency of sequences in bacteria, 16S rRNA gene sequencing has become the gold standard for characterization of bacterial communities. 2.2
Common Factors Affecting Bacterial Identification and Classification
Bacterial identification is based on a specific taxonomic scheme. There are several taxonomic schemes
Chao Zhang et al.: Bacterial Characterization Based on Genomic Data
227
Fig.1. Secondary structures of 16S rRNA gene of Escherichia coli generated by using XRNA[28] with 9 hypervariable regions circled.
proposed by independent curators, e.g., the Ribosomal Database Project (RDP) (Bergey’s)[29] , Norman Pace[30] , Wolfgang Ludwig[31] , Phil Hugenholtz[32] , and the National Center for Biotechnology Information (NCBI). All major rRNA sequence databases, such as RDP[33-34] , Greengenes[35-36] , and ARB-SILVA[37-38] were designed based on different taxonomic schemes. The variations among different taxonomic schemes have a direct impact on the identification results. For example, there are 31 phyla in the RDP database, 50 in Ludwig’s taxonomy, 68 in NCBI and 88 in the system proposed by Pace and Hugenholtz. Within each phylum, the number of sub-groupings also varies. After 2005, the oldest and most traditional bacterial classification system – Bergey’s taxonomy – started to build taxonomy based on analyses of nucleotide sequences of ribosomal small subunit RNA rather than on phenotypic data[29] . Nevertheless, most classification systems are still based on structural and functional attributes of bacteria. Thus, 16S rRNA gene-based identification
results may never match those taxonomies exactly. Sequence alignment is a necessary step in 16S rRNA gene-based identification. Besides the multiple sequence alignment programs such as ClustalW[39] , MEGA[40] , NAST[41] and MUSCLE[42] , some databases also include alignment programs, such as RDP II, Greengenes, and ARB-SILVA. It is shown that alignment quality has a significant impact on sequence classification[43] . Incorporating the well-determined secondary structures of 16S rRNA gene with the pairwise or multiple sequence alignment will improve alignment quality[33] , but the extra information will also significantly increase the computational complexity. Another recent research reveals that the longest totally conserved segment in 16S rRNA gene across all bacteria is only 11 bp and in most regions the longest absolutely conserved stretches are only 4 bp[12,44] . This stark reality is a challenge for developing effective and accurate alignment algorithms, especially for those 16S rRNA gene fragments with less than half of their full lengths.
228
J. Comput. Sci. & Technol., Mar. 2012, Vol.27, No.2
Different hypervariable (V) regions show different efficacies in identifying species, and no single hypervariable region can differentiate bacterial species among all bacteria. At the genus level, using 2-region set for identifications has become a standard approach, and about 90% of bacterial strains successfully identified by this approach cannot be identified through biochemical (phenotype) methods[45] . Chakravorty et al. proposed that the V2 and V3 regions were most suitable for universal genus identification of pathogenic bacteria[46] . The V5-V6 region set was reported to be the most useful in study of human oral microbiome[47-48] . It is suggested that analyzing three different 2-region sets (V2-V3, V4-V5, and V6-V8) in parallel was effective in determining the bacterial consortia in maize rhizospheres[49] . Some studies also revealed that the V6-V9 set[50] , especially the V6 region[51-52] , represented an outlier and might not be suitable to use directly for taxonomic assignment. Therefore, the choice of hypervariable regions is critical for bacterial identification[45] . There is room for further computational algorithm development in designing an optimal hypervariable set for bacterial identification. Due to their highly conserved nature, 16S rRNA gene sequences might not be a good genetic marker to distinguish the sub-populations within a species. Even different species within the same genus, such as Bacillus cereus, B. thuringiensis and B. anthracis[53] , have only a few bases different in their 16S rRNA gene sequences. No matter what computational methods are used, there will be a theoretical upper limit of the average accuracy for species identification across all species. 2.3
Major Computational Methods and Their Limitations
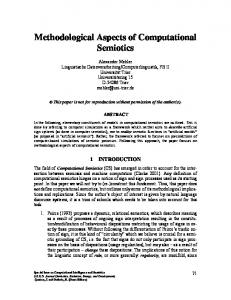
Generally speaking, computational methods for bacterial identification can be divided into two major categories: homology- and composition-based[54-55] as summarized in Fig.2. Homology-based approaches use traditional sequence alignment algorithms to compare sequences similarity. According to the techniques of alignment, it can be further divided into two subgroups, i.e., sequence search (especially using Basic Local Alignment Search Tool (BLAST)[56] ) and phylogeny. Composition-based methods build models based on the different features extracted from sequences, e.g., GC content[57] , codon usage, and frequencies of motifs. The typical classifiers used in composition-based methods are na¨ıve Bayes classifier, Markov model, and support vector machine (SVM). BLAST. BLAST is one of the most popular bioinformatics programs. It is most often used for comparing biological sequences, such as searching a query
sequence against
Fig.2. Major algorithms used in bacterial identification.
a sequence library. Thus, it naturally became the first choice of metagenomic studies in the early stage and has been shown to be effective in many studies[58-60] . Due to the limitation of its algorithm, the closest BLAST hit may not be the nearest neighbor[61] and this approach can reach a high-accuracy level only when the query reads have significant similarities to the matches in the sequence library[13] . Since the lengths of reads generated by next-generation sequencing technologies are still not long enough, short-reads are generally not unique and often cause ambiguous identification results. Recently, some researchers started to evaluate the performance of BLAST for analyzing metagenomic data[62-63] . For some metagenomics datasets, the significant BLAST hits only accounted for 35% of the reads in the sample[58] . With the improvement of sequencing techniques, the length of reads are getting longer, and the reference genome libraries are becoming more comprehensive[18] . Extremely expensive computational complexity is another common drawback of alignment-based identification techniques. While BLAST is an efficient software tool, its capacity in handling of metagenomic data can barely satisfy the needs of current analyses. With the explosive increase of metagenomic data, further reducing the computational complexity becomes an important challenge of alignment-based identification methods. Phylogeny. Because a significant proportion of short
Chao Zhang et al.: Bacterial Characterization Based on Genomic Data
query reads hit more than one species with significant E-value in the BLAST, a simple algorithm, the Lowest Common Ancestor (LCA), has been employed to assign the ambiguous reads to the right taxa[51,64] . Instead of choosing the nearest neighbor, LCA assigns each reads to the ancestor taxa by computing means of the least common taxonomic ancestor of a suitable set of hits, and it can also reflect the level of conservation of the sequence. While this approach is more sophisticated than BLAST, it has two drawbacks[54,65] : first, LCA has a relatively low coverage, because for some reads with very few numbers of hits on the reference taxonomy, the least common taxon cannot be computed; second, many reads have been assigned to non-informative high taxonomic ranks. The first issue has been addressed by a modified method — multiple taxonomic ranks (MTR)[54] . Traditionally, LCA only uses local taxonomic information for matching reference sequences and treats each read independently. MTR proposes a two-step method to use global type of information: 1) clustering reads with the same taxon; and 2) selecting the “best” subset of each cluster with a combinatorial optimization algorithm for LCA. The results of MTR experiments show a significant increase in coverage compared to the traditional LCA. The second drawback of LCA has been tackled by Clemente et al.[66] . By evaluating the number of mismatches between the read and the reference taxonomy to balance the relevance of precision and recall in the assignment, Clemente’s method assigns each read to the inner nodes (a rank lower or equal) of the taxon selected by the standard LCA. Na¨ıve Bayes Classifier. In order to avoid the heavy computational expense, some composition-based methods have been proposed as alternatives to classic alignment for sequence comparison[67] . A typical method is na¨ıve Bayes classifier (NBC)[55,68] . In 1997, Wang et al.[68] developed an NBC (RDP Classifier) with 8-mers (8 consecutive nucleotides) for using 16S rRNA gene sequences to classify bacteria into new taxonomy which has become one of the most popular classifiers in microbiology. As an extremely conserved gene, 16S rRNA gene has a much slower evolutional rate than other genes, and partial 16S rRNA gene sequence has a different k-mer distribution to full-length 16S rRNA gene sequence. With incomplete 16S rRNA gene sequence, the accuracy of bacterial identification may drop dramatically. Due to the limitations of the method, RDP classifier only can provide taxonomic assignments from domain to the genus level, and it also needs users to provide full length of 16s rRNA gene sequence to obtain high classification accuracy. It does not work at either species level or sub-species level. One study[55] suggests that NBC works better on whole genome sequences
229
than 16S rRNA gene sequence. The same study also tried to increase the length k to 15 to achieve better performance on short reads. When k equals 15, there are about 1 billion possible words and the longest bacterial genome is only around 26 million nucleotides; so an increase of k to 15 might cause the counting statistics insignificant. Furthermore, computational and storage expenses can be a concern. Other Models. Signal processing and machinelearning approaches are widely used to solve problems with the background noise, clutter, and jamming signals, and they also have been applied for bacterial identification. Phymm[69] , a classifier based on interpolated Markov model (IMM), has been trained on 539 curated genomes. It constructs probability distributions representing observed patterns of nucleotides on chromosomes or plasmids. Phymm shows good performance at ranks Class and Phylum levels on metagenomic datasets with relatively long reads (800 bp and 1 000 bp), but low accuracy for short reads (100 bp)[54] . Recently, an extensible Markov model (EMM)[70] was proposed to use a time-varying Markov chain model for bacterial identification. The sequence data can be considered as states representing clusters of similar sequence segments and inter-state transition probabilities representing the implicit order within the sequences. This model outperformed the RDP classifier, but still did not show satisfactory accuracy at rank Species. PhyloPythia[71] , a multiclass SVM based approach, examines oligonucleotide composition to characterize taxonomic groups. This method is effective for genomic fragments of 3 000 bp and longer, but for 1 000 bp sequences, its sensitivity drops drastically. 2.4
Challenges and Future Work
As an indispensable step, most bacterial identification tools have been integrated into the metagenomic analysis systems. The drawbacks of the current metagenomic analysis systems are also the drawbacks of bacterial identification tools. Near half of the current metagenomic analysis software tools (Table 1) uses a ‘pipeline’ approach. Within a pipeline, a set of applications is connected in a sequential order and the output of one application becomes the input of the next application. As a double-edged sword, pipeline methods can significantly reduce the cost of time and labor of development process by using existing, stable and well-established applications. However, the pipeline approach usually does not have an efficient structure for a system to handle large datasets, which is the case for metagenomic data. Furthermore, at each step of the pipeline, some analysis results and resources are subject to re-computation and re-allocation. This redundancy
230
J. Comput. Sci. & Technol., Mar. 2012, Vol.27, No.2
definitely affects the efficacy of using computational resources, hence decreasing the performance of the system. Another common problem of the pipeline approach is that the input/output within the pipeline could be time-consuming and error-prone. Thus, a cohesive public open-source development platform, such as Cytoscape[72] , is in dire need of construction. Such a platform will not only significantly save the development time of individual researchers, but also speed up the potentially revolutionary improvement of this field. A similar open-source framework is necessary for bacterial identification and it will help this research area to rapidly improve. A rapid growth in high-performance computing power is timely for analyzing dramatic rise in data volume. Different models of parallel computing, such as distributed computing, general-purpose computing on graphics processing units (GPUs), and cloud computing, can be applied as bioinformatics tools to analyze these data. Open-source new bioinformatics software tools are being developed by exploiting webbased services to increase computing power provided by academic and commercial “cloud computing networks”. Some resources are already available, e.g., Science Clouds[73] , which allows researchers to have full control over using a leasing model. MG-RASTCLOUD[74] is a metagenomics analysis server with capability of handling data from Gigabytes to Terabytes. CloudBurst[75] is a highly sensitive genome sequence mapping tool by using cloud computing. Soon, access to the Internet plus a pad or smart phone will be the only requirements for large-scale bioinformatics analysis. High-performance computing also makes it possible to implement algorithms with high computational
complexities. Due to the size of large data, current bacterial identification systems tend to use simple algorithms with low computational complexity. Some of the computationally expensive algorithms are explored with high-performance computing. Supervised and unsupervised learning methods, e.g., language models, linear classifiers, and advanced Bayesian techniques are promising for bacterial identification with high accuracies. Another promising approach to improving identification accuracy is using mixed models or a metaanalysis technique to combine the identification results from different methods. For example, PhymmBL[69] , a hybrid classifier, outperforms both BLAST and Phymm on the same dataset. Although it is still in the early stage, metagenomics analysis has already been used in many research areas, e.g., clinical microbiology[76-78] , bacteriaenvironment symbioses[79-80] , and host-microbial interactions[59,81-82] . Most of those applications are still using the two most traditional identification approaches — BLAST and the RDP classifier, since the newly developed methods still have some limitations and cannot significantly outperform them. Although all new algorithms are trying to overcome the common drawbacks, some issues remain unsolved. Generally, homology-based approaches work well for long reads (> 800 bp), while composition-based approaches can handle relatively short reads and partial gene sequence (down to 100 bp for some datasets). No single algorithm can dominate the identification results across both cases and the performance will significantly drop with the decrease of the read length. Therefore, improving performance on bacterial identification with short reads (less than 400 bp) is still an open problem.
Table 1. Metagenomic Analysis Software Name and Reference OTUbase[113]
Type
Algorithm
URL
R package
Open Source Yes
BLAST
Webserver Pipeline/web Pipeline/web Pipeline Pipeline Webserver Pipeline Pipeline Pipeline Pipeline Executables Perl script Webserver Pipeline Executables Executables Webserver
No Yes Yes Yes Yes No Yes Yes No No Yes Yes No No Yes Yes No
BLAST BLAST BLAST BLAST BLAST BLAST BLAST/NBC BLAST LCA LCA LCA LCA NBC NBC Markov Markov SVM
http://www.bioconductor.org/packages/release/bioc/ html/OTUbase.html http://camera.calit2.net http://metagenomics.anl.gov/ http://webcarma.cebitec.uni-bielefeld.de http://pangea-16s.sourceforge.net http://bergelson.uchicago.edu/software/marta http://umr5558-sud-str1.univ-lyon1.fr/lebibi/lebibi.cgi http://qiime.sourceforge.net/ http://bobcat.genomecenter.ucdavis.edu/STAP/ http://ab.inf.uni-tuebingen.de/software/megan/ http://galaxy.psu.edu/ http://www.cs.ru.nl/∼gori/software/MTR.tar.gz http://www.lsi.upc.edu/∼valiente/tango/ http://nbc.ece.drexel.edu/ http://rdp.cme.msu.edu/ http://www.cbcb.umd.edu/software/phymm/ http://lyle.smu.edu/IDA/EMM/ http://cbcsrv.watson.ibm.com/phylopythia.html
CAMERA[114] MG-RAST[115] WebCARMA[116] PANGEA[117] MARTA[118] BIBI[119] QIIME[120] STAP[121] MEGAN[64] Galaxy[122] MTR[54] TANGO[65] NBC[123] RDP[33] Phymm[69] EMM[70] PhyloPythia[71]
Last Update 2011 2011 2011 2011 2011 2010 2010 2010 2008 2011 2011 2010 2010 2011 2011 2011 2010 2007
Chao Zhang et al.: Bacterial Characterization Based on Genomic Data
Because of its unique characteristics, 16S rRNA gene remains as the most commonly used genetic marker[83] . However, using partial 16S rRNA gene sequence for bacterial identification is more difficult than using whole genome sequence or some other genetic markers, since the correlation of the sequence patterns between different hypervariable regions of 16S rRNA gene is relatively low and the variations of different hypervariableregions are species-specific. Thus, selection of hypervariableregions with a specific underlying database is tricky in bacterial identification and classification as it can significantly affect the identification results. To date, no matter what computational method is used, highly confident bacterial identification can only be achieved at rank of Genus, but many microbiology issues require higher resolution approaches to differentiate bacteria at the species level or even at subspecies level. For such a differentiation, whole genome sequence-based and MLST[23] methods are the two approaches currently available. MLST is based on the partial sequences of 7 housekeeping genes with around 450 bp each, but its resolution power is still limited by the little sequence variation among some bacterial species. Another possible approach is the use of singlenucleotide polymorphisms (SNPs) as genetic markers. This approach was originally developed for diagnosis of human genetic diseases, and now it has been used for the analyses of bacterial genomes[84-85] . When multiple potential markers are available, selecting sequence markers for a classifier is even more challenging than developing a general classifier with a given marker. Until now there is no universal protocol for solving this problem. In Sections 3 and 4 we will briefly introduce possible solutions using our new methodologies with examples. 3
Identification of Host-Specific Bacteria
Bacteria can mutate and adapt to the changing environments. Studies on bacteria-host/environment interactions not only provide an opportunity to dissect the genetic basis of adaptive evolution, but also can be very useful on infectious disease prevention and environment-quality monitoring. Host- or host groupspecific bacterial identification is an important step in studying bacteria-host interactions[86] . Unlike the general bacterial identification methods that we discussed in Section 2, high identification accuracy at the species or sub-species level is necessary for this type of identification. Here, we use identification of fecal source in aquatic environments as an example to introduce a practical application of computational methods in identification of host-specific bacteria.
231
Microbiological quality of water poses a risk to human health. During 2005∼2006, 78 waterbornedisease outbreaks were reported, which caused the sickness of 4 412 people, 116 hospitalizations, and 5 deaths in the United States[87] . Animal manures are the major cause for the impaired water quality. Animal gastrointestinal (G.I.) tract maintains a rich microbial community with specific mutualistic associations with different hosts[88] . Thus, the bacterial community in the G.I. system not only is used to model the evolutionary relationships between hosts and bacteria, but also provides a reliable indicator in identification of the fecal pollution source in aquatic environments. Current microbiological water quality monitoring and regulations are based on the amount of the fecal indicator bacteria (FIB), Escherichia coli or enterococci[89] . The presence of FIB is indicative of a fecal pollution in water, but it does not identify the contamination source(s). So, microbial source tracking (MST) methods have been developed and used for the identification. It is essential to identify the sources of fecal pollution before best management practices can be applied to eliminate or mitigate the pollution sources. A variety of alternative fecal indicator microorganisms have been proposed and used in MST with varying degrees of success. Bacteria such as Bacteroides-Prevotella spp.[90] , Bifidobacterium spp.[91] , Clostridium perfringens[92] , Lactobacillus spp.[93] , Methanogens spp.[94] , and Faecalibacterium[95] have been proposed and used for MST. We and other researchers found Faecalibacterium to be among the dominant bacteria in the intestinal tract of major animals that are often found to be the sources of fecal pollution in water, which makes this bacterium a candidate as an alternative fecal indicator. Faecalibacterium is the newly established genus[96] , composed of a single species Faecalibacterium prausnitzii[29] with the type strain being F. prausnitzii ATCC27768. F. prausnitzii, previously Fusobacterium prausnitzii, is phylogenetically distinct from known Fusobacterium species, based on the 16S rDNA sequence and G+C content[96] . Faecalibacterium is the dominating fecal bacterium in humans[95,97] , cattle[98] , swine[99] , and poultry[100] . A collection of 7 458 Faecalibacterium 16S rDNA sequences of intestinal and fecal samples from different animal species were obtained from the RDP. These include human (6 407 sequences), cattle (811 sequences), turkey (132 sequences), chicken (88 sequences), pig (16 sequences), dog (3 sequence) and sheep (1 sequence). A multiple sequence alignment was performed with all the sequences by using MUSCLE version 3.8[42] , and the aligned sequences were then divided according to
232
J. Comput. Sci. & Technol., Mar. 2012, Vol.27, No.2
their hosts. For the sequences of any two host species, both combinatorial entropy (1)[101] and background entropy (2) were calculated for each site of the sequences and described as follows: X Nk ! Si = ln Q , (1) α=1...4 Nα,i,k ! k
where Nk represents the number of sequences in group k; Nα,i,k denotes the number of nucleotides of type α in the column i of group k; Nα,i is the number of nucleotides of type α in the column i; N represents the total number of sequences in alignment. Sei =
X k
ln Q
Nk ! , eα,i,k ! N
(2)
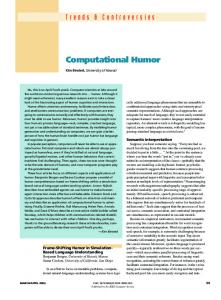
we chose entropy difference as a feature to differentiate the two groups. The entropy differences of selected positions are used as the feature entropy in the identification step for distinguishing the host groups with the same species of bacteria. We have analyzed the polymorphism of Faecalibacterium 16S rDNA sequences by using the entropy calculation and have identified that the V1 region of these sequences has the highest variations, suggesting that V1 is the region where signature sequences of a particular host may be found. In fact, there is a significant difference in the nucleotide distributions in V1 between species with poultry (including chicken and turkey) and others as hosts (Fig.4). No significant difference has
α=1...4
eα,i,k = Nk Nα,i /N . where N Then the entropy difference of any two host-group sequences was measured as previously reported[102] . Three extreme cases are defined as in Fig.3. In case P1, the nucleotides are “randomly and uniformly distributed” over all groups and there is no significantly conserved pattern for this position. Case P2 represents a “globally conserved” pattern and all the nucleotides are the same across both groups. In case P3, some specific nucleotides are only conserved in particular groups, and different groups have different nucleotides. We call this case “locally conserved”. According to the calculation results of the entropy difference for the three cases, the entropy difference is 0, 0 and the minimum value for the “randomly and uniformly distributed” case, “globally conserved” case, and “locally conserved” case, respectively. Hence, the entropy difference is a proper measurement for detecting a “locally conserved” sequence pattern. According to the above illustration,
Fig.3. Example to present the different cases for the entropy calculation.
Fig.4. Sequence logos of the 16S rRNA gene V1 regions of Faecalibacterium from chicken, turkey and other host species. The overall height of the stack indicates the sequence conservation at that position, while the height of symbols within the stack indicates the relative frequency of each nucleic acid at that position.
Chao Zhang et al.: Bacterial Characterization Based on Genomic Data
been found for all other variable regions between chicken and turkey hosts, and in any variable region among all the other hosts, including human, cattle, pig, dog, and sheep. We trimmed the V1 region in all 7 458 sequences by splitting them into three groups according to the different hosts, “chicken”, “turkey” and “others”. First, the average sequence similarity within each group was calculated and the pairwise sequence similarity defined as follows: identity= [(number of identical nucleotides)/(length of the alignment)]%. Within the same host group of “chicken”, “turkey” or “others”, the V1 regions share 65.2%, 60.7% and 76.7% average pairwise sequence identities, respectively. Then we compared the average sequence identities between all groups. The “chicken” group and the “others” group only share 30.8% average identity, which is very close to the 30.2% identity between “turkey” and “others”, while the “chicken” group and “turkey” group are very similar with 62.4% average identity. Based on the MUSCLE multiple alignments, a phylogenetic tree was derived from a maximum likelihood analysis by using PhyML[103] , as shown in Fig.5. The topology of the poultry host branch is highly conserved, and the sequences from poultry host have higher similarity than those sequences from any other animal species, which is in agreement with the result of polymorphism analysis based on our entropy calculation. The polymorphism of poultry vs non-poultry Faecalibacterium 16S rDNA sequences, including the significant difference in V1 nucleotide distribution, has provided a foundation for design and development of a poultry feces-specific polymerase chain reaction (PCR) assay for the rapid determination of poultry fecal pollution in water (Zheng and Xu, unpublished data). 4
Identification of Disease-Associated Bacteria
Immediately after birth, humans undergo a life-long process of colonization by foreign microorganisms. Although we benefit from some host-bacterial associations, bacterial pathogens have long been known to play important roles in the development of different
233
diseases[104] including cancer[105] . The host-bacteria interactions include many complicated mechanisms, such as co-evolution, the response of the host immune system[106] , the adaption of bacteria to the host and so on. There are challenges in discovering associations between bacteria and diseases. For example, given the same host and same bacterial species, why will different subspecies or strains cause different diseases and how can one differentiate the virulence by bacterial sequences? Although many publications have discussed the roles of bacterial pathogens in the development of diseases, a standard computational method for detecting disease-related sequence markers and identifying virulent strains is still lacking. Genus Helicobacter is a well-studied model for its relationship between bacterial infection and cancer[107] . Here, we are using Helicobacter pylori (H. pylori) as an example to introduce a method for identification of disease-specific bacteria. H. pylori is a Gram-negative helix-shaped bacterium inhabiting the human stomach and is associated with gastroduodenal diseases, including duodenal ulcers[108] , gastric ulcers[109] , chronic gastritis and gastric cancer[110] . Cytotoxin-associated gene A (cagA) of H. pylori has been revealed to be the major virulence factor causing gastroduodenal diseases. The relationships between the polymorphism of CagA and clinical diseases become a very interesting research problem. However, the molecular mechanisms that underlie different gastroduodenal diseases caused by cagApositive H. pylori infection remain unclear. Until now, most studies are still limited to the discovery or evaluation of the correlation between diseases and the number of Glu-Pro-Ile-Tyr-Ala (EPIYA) motifs in the CagA strain[111] . To further understand the relationship between CagA sequence and its virulence to gastric cancer, we developed a systematic approach to identify the cancer-related residues of CagA and employed a supervised machine learning method for diseases-related strain identification. Based on the significant sequence patterns, the East Asian subtype and the Western subtype were treated as two independent groups and analyzed within each
Fig.5. Phylogenetic tree for Faecalibacterium 16S rRNA gene sequences. The number n before the name of each node presents the number of sequences under this node. Strain ATCC 27768 is used as the standard sequence and the number after the name of node is the distance between this node and strain ATCC 27768.
234
group individually. CagA sequences of each subtype were put into the corresponding disease groups, and then the multiple sequence alignments were applied for each group individually by using Clustal X version 2.0.3[39] . Based on the aligned sequences, for each column of multiple alignments, we computed the background entropy and the combinatorial entropy based on the disease groups. The entropy difference between the combinatorial entropy and the background entropy was calculated as feature values. The feature values were then fed into an SVM-based classifier with the Radial Basis Function (RBF) kernel, and two parameters were tuned to obtain the optimal F value by using grid search. Two other popular sequence classification methods, BLAST and HMMER (based on hidden Markov models), were also applied to the same data for comparison. A leave-one-out crossvalidation procedure was performed for all methods to avoid over fitting, and several measures were used to evaluate the classification results: accuracy (Acc), sensitivity (Sn), specificity (Sp), Matthews correlation coefficient (MCC) and F value. The training/identification procedure has been implemented based on the workflow shown in Fig.6, before generating training/test data, all identical strains have been removed. • Select one strain as the test strain. • Apply a bootstrap procedure to the rest of the strains to get the training strains. • Calculate the feature entropy for the test strain based on training strains and save it as the test data. • Calculate the feature entropy for each strain in the training strain set based on training strains and save them as the training data. • Generate classification model by using the training data. • Classify the test data according to the classification model. • Repeat this procedure five times, and then calculate the average as the final result. In total, 287 East Asian subtype strains and 248 Western subtype strains were collected and verified from different data sources. Among them, 47 strains are related to gastric cancer in the East Asian subtype group and 37 strains in the Western subtype group. Two popular identification methods, BLAST and HMMER[112] , were selected as the representative methods for comparison. For the identification procedure of both BLAST and HMMER, we used the default parameters of the tools, applied the LOO crossvalidation as our method, and used the same evaluation formulas. Our entropy-based method achieved 76% and 71% classification accuracy for Western and East Asian subtypes, respectively, which performed significantly
J. Comput. Sci. & Technol., Mar. 2012, Vol.27, No.2
better than BLAST and HMMER (Table 2). Although research indicates that there are sequence markers to differentiate between a cancer group and a non-cancer group, the major profiles of those two groups are too similar to distinguish by using traditional methods. Therefore, we focused on identifying the informative residues, quantifying information of these selected residues, and then using it to design a classifier that can predict whether a new sequence belongs to the cancer group or the non-cancer group[102] . This method not only sheds light on the relations between CagA sequences and gastric cancer, but also may provide a useful tool for gastric cancer diagnosis or prognosis.
Fig.6. Workflow of training/identification procedure for a specific CagA sequence.
Chao Zhang et al.: Bacterial Characterization Based on Genomic Data
235
Table 2. Comparison of Classification Performance Subtype Western
No. Cancer Cases 37
No. Non-Cancer Cases 211
Method Entropy-SVM BLAST HMMER
Sn 0.86 0.22 0.94
Sp 0.740 0.770 0.005
Accuracy 0.76 0.69 0.14
F Value 0.800 0.340 0.009
MCC 0.45 −0.01 −0.16
47
240
Entropy-SVM BLAST HMMER
0.74 0.17 1.00
0.710 0.750 0.003
0.71 0.65 0.19
0.730 0.280 0.050
0.35 −0.07 0.06
East Asian
5
Conclusions
In this review, we have discussed the most widely used bacterial identification algorithms, e.g., sequence search, phylogeny, frequencies of length-N motifs, na¨ıve Bayes classifier, Markov model and SVM. With the improvement of new tools, the accuracy is increasing. The significant drop of identification performance with the decrease of the read length and the lacking of accuracy on species-level identification are the two common drawbacks for all current algorithms. Therefore, it is crucial to improve the performance in using short reads for bacterial identification on the species or sub-species level. Furthermore, we have addressed two specific bacterial identification problems, detections of host-specific and disease-associated bacteria. While current algorithms cannot solve these two problems, we provided promising examples of our effort for tackling these issues, which may point a helpful direction to pursue for future studies. In both cases, we used entropy difference to detect feature sites on biological sequence and then applied these sites in for SVM-based classifications. Identification of host-specific bacteria, described in Section 3, is not only a special issue of bacterial identification, but also a way to discover bacteria-host interaction. Detection of disease-associated sequence markers in pathogenic bacteria, discussed in Section 4, requires an even higher differentiation power than in identification of host-specific bacteria. The clinical importance of differentiating disease-associated strains from the nonpathogenic ones calls for more computer scientists to develop new computational methods, inference algorithms, and standard tools to solve these challenging problems. References [1] Whitman W B, Coleman D C, Wiebe W J. Prokaryotes: The unseen majority. Proc. Natl. Acad. Sci. U.S.A., 1998, 95(12): 6578-6583. [2] Curtis T P, Sloan W T, Scannell J W. Estimating prokaryotic diversity and its limits. Proc. Natl. Acad. Sci. U.S.A., 2002, 99(16): 10494-10499. [3] Fredrickson J K, Zachara J M, Balkwill D L, Kennedy D, Li S M, Kostandarithes H M, Daly M J, Romine M F, Brockman F J. Geomicrobiology of high-level nuclear wastecontaminated vadose sediments at the hanford site, Washington State. Appl. Environ. Microbiol., 2004, 70(7): 42304241.
[4] Turnbaugh P J, Hamady M, Yatsunenko T, Cantarel B L, Duncan A, Ley R E, Sogin M L, Jones W J, Roe B A, Affourtit J P, Egholm M, Henrissat B, Heath A C, Knight R, Gordon J I. A core gut microbiome in obese and lean twins. Nature, 2009, 457(7228): 480-484. [5] Dinsdale E A, Pantos O, Smriga S, Edwards R A, Angly F, Wegley L, Hatay M, Hall D, Brown E, Haynes M, Krause L, Sala E, Sandin S A, Thurber R V, Willis B L, Azam F, Knowlton N, Rohwer F. Microbial ecology of four coral atolls in the Northern Line Islands. PLoS One, 2008, 3(2): e1584. [6] Lorenz P, Eck J. Metagenomics and industrial applications. Nat. Rev. Microbiol., 2005, 3(6): 510-516. [7] Ishige T, Honda K, Shimizu S. Whole organism biocatalysis. Curr. Opin. Chem. Biol., 2005, 9(2): 174-180. [8] Andries K, Verhasselt P, Guillemont J, Gohlmann H W, Neefs J M, Winkler H, Van Gestel J, Timmerman P, Zhu M, Lee E, Williams P, de Chaffoy D, Huitric E, Hoffner S, Cambau E, Truffot-Pernot C, Lounis N, Jarlier V. A diarylquinoline drug active on the ATP synthase of Mycobacterium tuberculosis. Science, 2005, 307(5707): 223-227. [9] Fleischmann R D, Adams M D, White O, Clayton R A, Kirkness E F, Kerlavage A R, Bult C J, Tomb J F, Dougherty B A, Merrick J M et al. Whole-genome random sequencing and assembly of Haemophilus influenzae Rd. Science, 1995, 269(5223): 496-512. [10] Nishida H, Kondo S, Nojiri H, Noma K, Oshima K. Evolutionary mechanisms of microbial genomes. Int. J. Evol. Biol., 2011: 319479. [11] Schloss P D, Handelsman J. Status of the microbial census. Microbiol. Mol. Biol. Rev., 2004, 68(4): 686-691. [12] Petrosino J F, Highlander S, Luna R A, Gibbs R A, Versalovic J. Metagenomic pyrosequencing and microbial identification. Clin. Chem., 2009, 55(5): 856-866. [13] Wooley J C, Ye Y. Metagenomics: Facts and artifacts, and computational challenges. J. Comput. Sci. Technol., 2009, 25(1): 71-81. [14] Pallen M J and Wren B W. Bacterial pathogenomics. Nature, 2007, 449(7164): 835-842. [15] Fricke W F, Rasko D A, Ravel J. The role of genomics in the identification, prediction, and prevention of biological threats. PLoS Biol., 2009, 7(10): e1000217. [16] Medini D, Serruto D, Parkhill J, Relman D A, Donati C, Moxon R, Falkow S, Rappuoli R. Microbiology in the postgenomic era. Nat. Rev. Microbiol., 2008, 6(6): 419-430. [17] Welch R A, Burland V, Plunkett G, Redford P, Roesch P, Rasko D, Buckles E L, Liou S R, Boutin A, Hackett J, Stroud D, Mayhew G F, Rose D J, Zhou S, Schwartz D C, Perna N T, Mobley H L, Donnenberg M S, Blattner F R. Extensive mosaic structure revealed by the complete genome sequence of uropathogenic Escherichia coli. Proc. Natl. Acad. Sci. U.S.A., 2002, 99(26): 17020-17024. [18] Turnbaugh P J, Ley R E, Hamady M, Fraser-Liggett C M, Knight R, Gordon J I. The human microbiome project. Nature, 2007, 449(7164): 804-810. [19] Eckburg P B, Bik E M, Bernstein C N, Purdom E, Dethlefsen L, Sargent M, Gill S R, Nelson K E, Relman D A. Diversity of the human intestinal microbial flora. Science, 2005,
236 308(5728): 1635-1638. [20] Woese C R, Kandler O, Wheelis M L. Towards a natural system of organisms: Proposal for the domains Archaea, Bacteria, and Eucarya. Proc. Natl. Acad. Sci. U.S.A., 1990, 87(12): 4576-4579. [21] Relman D A, Falkow S, LeBoit P E, Perkocha L A, Min K W, Welch D F, Slater L N. The organism causing bacillary angiomatosis, peliosis hepatis, and fever and bacteremia in immunocompromised patients. N. Engl. J. Med., 1991, 324(21): 1514. [22] Winker S, Woese C R. A definition of the domains Archaea, Bacteria and Eucarya in terms of small subunit ribosomal RNA characteristics. Syst. Appl. Microbiol., 1991, 14(4): 305-310. [23] Maiden M C, Bygraves J A, Feil E, Morelli G, Russell J E, Urwin R, Zhang Q, Zhou J, Zurth K, Caugant D A, Feavers I M, Achtman M, Spratt B G. Multilocus sequence typing: A portable approach to the identification of clones within populations of pathogenic microorganisms. Proc. Natl. Acad. Sci. U.S.A., 1998, 95(6): 3140-3145. [24] Lin G N, Zhang C, Xu D. Polytomy identification in microbial phylogenetic reconstruction. BMC Systems Biology, 2011, Submitted. [25] Bansal A K, Meyer T E. Evolutionary analysis by wholegenome comparisons. J. Bacteriol., 2002, 184(8): 2260-2272. [26] Van de Peer Y, Chapelle S, De Wachter R. A quantitative map of nucleotide substitution rates in bacterial rRNA. Nucleic Acids Res., 1996, 24(17): 3381-3391. [27] Peterson D A, Frank D N, Pace N R, Gordon J I. Metagenomic approaches for defining the pathogenesis of inflammatory bowel diseases. Cell Host Microbe, 2008, 3(6): 417-427. [28] http://rna.ucsc.edu/rnacenter/xrna/xrna.html. [29] Garrity G. Bergey’s Manual of Systematic Bacteriology, Vol. 2 (Parts A, B & C; Three-Volume Set). New York: Springer, 2005. [30] Pace N R. A molecular view of microbial diversity and the biosphere. Science, 1997, 276(5313): 734-740. [31] Ludwig W, Strunk O, Westram R, Richter L, Meier H, Yadhukumar, Buchner A, Lai T, Steppi S, Jobb G, Forster W, Brettske I, Gerber S, Ginhart A W, Gross O, Grumann S, Hermann S, Jost R, Konig A, Liss T, Lussmann R, May M, Nonhoff B, Reichel B, Strehlow R, Stamatakis A, Stuckmann N, Vilbig A, Lenke M, Ludwig T, Bode A, Schleifer K H. ARB: A software environment for sequence data. Nucleic Acids Res., 2004, 32(4): 1363-1371. [32] Hugenholtz P. Exploring prokaryotic diversity in the genomic era. Genome Biol., 2002, 3(2): review 0003.1-review 0003.8. [33] Cole J R, Wang Q, Cardenas E, Fish J, Chai B, Farris R J, Kulam-Syed-Mohideen A S, McGarrell D M, Marsh T, Garrity G M, Tiedje J M. The Ribosomal Database Project: Improved alignments and new tools for rRNA analysis. Nucleic Acids Res., 2009, 37(Database issue): 141-145. [34] http://rdp.cme.msu.edu/. [35] DeSantis T Z, Hugenholtz P, Larsen N, Rojas M, Brodie E L, Keller K, Huber T, Dalevi D, Hu P, Andersen G L. Greengenes, a chimera-checked 16S rRNA gene database and workbench compatible with ARB. Appl. Environ. Microbiol., 2006, 72(7): 5069-5072. [36] http://greengenes.lbl.gov. [37] Pruesse E, Quast C, Knittel K, Fuchs B M, Ludwig W, Peplies J, Glockner F O. SILVA: A comprehensive online resource for quality checked and aligned ribosomal RNA sequence data compatible with ARB. Nucleic Acids Res., 2007, 35(21): 7188-7196. [38] http://www.arb-silva.de. [39] Larkin M A, Blackshields G, Brown N P, Chenna R, McGettigan P A, McWilliam H, Valentin F, Wallace I M, Wilm A,
J. Comput. Sci. & Technol., Mar. 2012, Vol.27, No.2
[40]
[41]
[42]
[43]
[44]
[45]
[46]
[47]
[48]
[49]
[50]
[51]
[52]
[53]
[54]
Lopez R, Thompson J D, Gibson T J, Higgins D G. Clustal W and Clustal X version 2.0. Bioinformatics, 2007, 23(21): 2947-2948. Tamura K, Peterson D, Peterson N, Stecher G, Nei M, Kumar S. MEGA5: Molecular evolutionary genetics analysis using maximum likelihood, evolutionary distance, and maximum parsimony methods. Mol. Biol. Evol., 2011. DeSantis T Z Jr., Hugenholtz P, Keller K, Brodie E L, Larsen N, Piceno Y M, Phan R, Andersen G L. NAST: A multiple sequence alignment server for comparative analysis of 16S rRNA genes. Nucleic Acids Res., 2006, 34(Web Server issue): 394-399. Edgar R C. MUSCLE: Multiple sequence alignment with high accuracy and high throughput. Nucleic Acids Res., 2004, 32(5): 1792-1797. Schloss P D. The effects of alignment quality, distance calculation method, sequence filtering, and region on the analysis of 16S rRNA gene-based studies. PLoS Comput. Biol., 2010, 6(7): e1000844. Baker G C, Smith J J, Cowan D A. Review and re-analysis of domain-specific 16S primers. J. Microbiol. Methods, 2003, 55(3): 541-555. Luna R A, Fasciano L R, Jones S C, Boyanton B L Jr., Ton T T, Versalovic J. DNA pyrosequencing-based bacterial pathogen identification in a pediatric hospital setting. J. Clin. Microbiol., 2007, 45(9): 2985-2992. Chakravorty S, Helb D, Burday M, Connell N, Alland D. A detailed analysis of 16S ribosomal RNA gene segments for the diagnosis of pathogenic bacteria. J. Microbiol. Methods, 2007, 69(2): 330-339. Crielaard W, Zaura E, Schuller A A, Huse S M, Montijn R C, Keijser B J. Exploring the oral microbiota of children at various developmental stages of their dentition in the relation to their oral health. BMC Med. Genomics, 2011, 4: 22. Wade W G. Has the use of molecular methods for the characterization of the human oral microbiome changed our understanding of the role of bacteria in the pathogenesis of periodontal disease? J. Clin. Periodontol., 2011, 38(Suppl 11): 7-16. Schmalenberger A, Schwieger F, Tebbe C C. Effect of primers hybridizing to different evolutionarily conserved regions of the small-subunit rRNA gene in PCR-based microbial community analyses and genetic profiling. Appl. Environ. Microbiol., 2001, 67(8): 3557-3563. Wu G D, Lewis J D, Hoffmann C, Chen Y Y, Knight R, Bittinger K, Hwang J, Chen J, Berkowsky R, Nessel L, Li H, Bushman F D. Sampling and pyrosequencing methods for characterizing bacterial communities in the human gut using 16S sequence tags. BMC Microbiol., 2010, 10: 206. Liu Z, DeSantis T Z, Andersen G L, Knight R. Accurate taxonomy assignments from 16S rRNA sequences produced by highly parallel pyrosequencers. Nucleic Acids Res., 2008, 36(18): e120. Claesson M J, O’Sullivan O, Wang Q, Nikkila J, Marchesi J R, Smidt H, de Vos W M, Ross R P, O’Toole P W. Comparative analysis of pyrosequencing and a phylogenetic microarray for exploring microbial community structures in the human distal intestine. PLoS One, 2009, 4(8): e6669. Sacchi C T, Whitney A M, Mayer L W, Morey R, Steigerwalt A, Boras A, Weyant R S, Popovic T. Sequencing of 16S rRNA gene: A rapid tool for identification of Bacillus anthracis. Emerg. Infect. Dis., 2002, 8(10): 1117-1123. Gori F, Folino G, Jetten M S, Marchiori E. MTR: Taxonomic annotation of short metagenomic reads using clustering at multiple taxonomic ranks. Bioinformatics, 2011, 27(2): 196203.
Chao Zhang et al.: Bacterial Characterization Based on Genomic Data [55] Rosen G L, Essinger S D. Comparison of statistical methods to classify environmental genomic fragments. IEEE Trans. Nanobioscience, 2010, 9(4): 310-316. [56] Altschul S F, Gish W, Miller W, Myers E W, Lipman D J. Basic local alignment search tool. J. Mol. Biol., 1990, 215(3): 403-410. [57] Foerstner K U, von Mering C, Hooper S D, Bork P. Environments shape the nucleotide composition of genomes. EMBO Rep., 2005, 6(12): 1208-1213. [58] Wommack K E, Bhavsar J, Ravel J. Metagenomics: Read length matters. Appl. Environ. Microbiol., 2008, 74(5): 1453-1463. [59] Andersson A F, Lindberg M, Jakobsson H, Backhed F, Nyren P, Engstrand L. Comparative analysis of human gut microbiota by barcoded pyrosequencing. PLoS One, 2008, 3(7): e2836. [60] Dalevi D, Ivanova N N, Mavromatis K, Hooper S D, Szeto E, Hugenholtz P, Kyrpides N C, Markowitz V M. Annotation of metagenome short reads using proxygenes. Bioinformatics, 2008, 24(16): i7-i13. [61] Koski L B, Golding G B. The closest BLAST hit is often not the nearest neighbor. J. Mol. Evol., 2001, 52(6): 540-542. [62] Pignatelli M, Aparicio G, Blanquer I, Hernandez V, Moya A, Tamames J. Metagenomics reveals our incomplete knowledge of global diversity. Bioinformatics, 2008, 24(18): 2124-2125. [63] Manichanh C, Chapple C E, Frangeul L, Gloux K, Guigo R, Dore J. A comparison of random sequence reads versus 16S rDNA sequences for estimating the biodiversity of a metagenomic library. Nucleic Acids Res., 2008, 36(16): 5180-5188. [64] Huson D H, Auch A F, Qi J, Schuster S C. MEGAN analysis of metagenomic data. Genome Res., 2007, 17(3): 377-386. [65] Clemente J C, Jansson J, Valiente G. Flexible taxonomic assignment of ambiguous sequencing reads. BMC Bioinformatics, 2011, 12: 8. [66] Clemente J C, Jansson J, Valiente G. Accurate taxonomic assignment of short pyrosequencing reads. In Proc. Pac. Symp. Biocomput., Jan. 2010, pp.3-9. [67] Vinga S, Almeida J. Alignment-free sequence comparison-a review. Bioinformatics, 2003, 19(4): 513-523. [68] Wang Q, Garrity G M, Tiedje J M, Cole J R. Naive Bayesian classifier for rapid assignment of rRNA sequences into the new bacterial taxonomy. Appl. Environ. Microbiol., 2007, 73(16): 5261-5267. [69] Brady A, Salzberg S L. Phymm and PhymmBL: Metagenomic phylogenetic classification with interpolated Markov models. Nat. Methods, 2009, 6(9): 673-676. [70] Kotamarti R M, Hahsler M, Raiford D, McGee M, Dunham M H. Analyzing taxonomic classification using extensible Markov models. Bioinformatics, 2010, 26(18): 2235-2241. [71] McHardy A C, Martin H G, Tsirigos A, Hugenholtz P, Rigoutsos I. Accurate phylogenetic classification of variable-length DNA fragments. Nat. Methods, 2007, 4(1): 63-72. [72] Smoot M E, Ono K, Ruscheinski J, Wang P L, Ideker T. Cytoscape 2.8: New features for data integration and network visualization. Bioinformatics, 2011, 27(3): 431-432. [73] http://scienleclouds.org/. [74] http://metagenomics.anl.gov. [75] Schatz M C. CloudBurst: Highly sensitive read mapping with MapReduce. Bioinformatics, 2009, 25(11): 1363-1369. [76] Underwood A, Green J. Call for a quality standard for sequence-based assays in clinical microbiology: Necessity for quality assessment of sequences used in microbial identification and typing. J. Clin. Microbiol., 2011, 49(1): 23-26. [77] Teng J L, Yeung M Y, Yue G, Au-Yeung R K, Yeung E Y, Fung A M, Tse H, Yuen K Y, Lau S K, Woo P C. In silico analysis of 16S ribosomal RNA gene sequencing based methods for
[78]
[79]
[80] [81] [82]
[83]
[84]
[85]
[86]
[87]
[88] [89]
[90]
[91]
[92]
[93]
[94]
[95]
237
identification of medically important aerobic Gram-negative bacteria. J Med. Microbiol., 2011. Woo P C, Teng J L, Yeung J M, Tse H, Lau S K, Yuen K Y. Automated identification of medically important bacteria by 16S rRNA gene sequencing using a novel comprehensive database 16SpathDB. J. Clin. Microbiol., 2011, 49(5): 17991809. Lecomte J, St-Arnaud M, Hijri M. Isolation and identification of soil bacteria growing at the expense of arbuscular mycorrhizal fungi. FEMS Microbiol. Lett., 2011, 317(1): 43-51. Schloss P D, Handelsman J. Toward a census of bacteria in soil. PLoS Comput. Biol., 2006, 2(7): e92. Arumugam M, Raes J, Pelletier E et al. Enterotypes of the human gut microbiome. Nature, 2011, 473(7346): 174-180. Fierer N, Lauber C L, Zhou N, McDonald D, Costello E K, Knight R. Forensic identification using skin bacterial communities. Proc. Natl. Acad. Sci. U.S.A., 2010, 107(14): 6477-6481. Janda J M, Abbott S L. 16S rRNA gene sequencing for bacterial identification in the diagnostic laboratory: Pluses, perils, and pitfalls. J. Clin. Microbiol., 2007, 45(9): 2761-2764. Silverman A P, Kool E T. Quenched autoligation probes allow discrimination of live bacterial species by single nucleotide differences in rRNA. Nucleic Acids Res., 2005, 33(15): 49784986. Robertson G A, Thiruvenkataswamy V, Shilling H, Price E P, Huygens F, Henskens F A, Giffard P M. Identification and interrogation of highly informative single nucleotide polymorphism sets defined by bacterial multilocus sequence typing databases. J. Med. Microbiol., 2004, 53(Pt. 1): 35-45. Lu J, Santo Domingo J, Shanks O C. Identification of chickenspecific fecal microbial sequences using a metagenomic approach. Water Res., 2007, 41(16): 3561-3574. Yoder J S. Centers for Disease C and Prevention. surveillance for waterborne disease and outbreaks associated with recreational water use and other aquatic facility-associated health events – United States, 2005-2006. Xu J, Gordon J I. Honor thy symbionts. Proc. Natl. Acad. Sci. U.S.A., 2003, 100(18): 10452-10459. Bacterial water quality standards for recreational waters, freshwater and marine waters status report. United States Environmental Protection Agency, Office of Water, http://purl.access.gpo.gov/GPO/LPS67028. Carson C A, Christiansen J M, Yampara-Iquise H, Benson V W, Baffaut C, Davis J V, Broz R R, Kurtz W B, Rogers W M, Fales W H. Specificity of a Bacteroides thetaiotaomicron marker for human feces. Appl. Environ. Microbiol., 2005, 71(8): 4945-4949. Bonjoch X, Balleste E, Blanch A R. Enumeration of bifidobacterial populations with selective media to determine the source of waterborne fecal pollution. Water Res., 2005, 39(8): 1621-1627. Sorensen D L, Eberl S G, Dicksa R A. Clostridium perfringens as a point source indicator in non-point polluted streams. Water Research, 1989, 23(2): 191-197. Marti R, Dabert P, Ziebal C, Pourcher A M. Evaluation of Lactobacillus sobrius/L. amylovorus as a new microbial marker of pig manure. Appl. Environ. Microbiol., 2010, 76(5): 1456-1461. Ufnar J A, Wang S Y, Ufnar D F, Ellender R D. Methanobrevibacter ruminantium as an indicator of domesticatedruminant fecal pollution in surface waters. Appl. Environ. Microbiol., 2007, 73(21): 7118-7121. Zheng G, Yampara-Iquise H, Jones J E, Andrew Carson C. Development of Faecalibacterium 16S rRNA gene marker for identification of human faeces. J. Appl. Microbiol., 2009, 106(2): 634-641.
238 [96] Duncan S H, Hold G L, Harmsen H J, Stewart C S, Flint H J. Growth requirements and fermentation products of Fusobacterium prausnitzii, and a proposal to reclassify it as Faecalibacterium prausnitzii gen. nov., comb. nov. Int. J. Syst. Evol. Microbiol., 2002, 52(Pt. 6): 2141-2146. [97] Tap J, Mondot S, Levenez F, Pelletier E, Caron C, Furet J P, Ugarte E, Munoz-Tamayo R, Paslier D L, Nalin R, Dore J, Leclerc M. Towards the human intestinal microbiota phylogenetic core. Environ. Microbiol., 2009, 11(10): 2574-2584. [98] Dowd S E, Callaway T R, Wolcott R D, Sun Y, McKeehan T, Hagevoort R G, Edrington T S. Evaluation of the bacterial diversity in the feces of cattle using 16S rDNA bacterial tag-encoded FLX amplicon pyrosequencing (bTEFAP). BMC Microbiol., 2008, 8: 125. [99] Leser T D, Amenuvor J Z, Jensen T K, Lindecrona R H, Boye M, Moller K. Culture-independent analysis of gut bacteria: The pig gastrointestinal tract microbiota revisited. Appl. Environ. Microbiol., 2002, 68(2): 673-690. [100] Zhu X Y, Zhong T, Pandya Y, Joerger R D. 16S rRNA-based analysis of microbiota from the cecum of broiler chickens. Appl. Environ. Microbiol., 2002, 68(1): 124-137. [101] Reva B, Antipin Y, Sander C. Determinants of protein function revealed by combinatorial entropy optimization. Genome Biol., 2007, 8(11): R232. [102] Zhang C, Xu S, Xu D. Detection and application of CagA sequence markers for assessing risk factor of gastric cancer caused by Helicobacter pylori. In proc. IEEE International Conference on Bioinformatics and Biomedicine (BIBM), Dec. 18-21, 2010, pp.485-488. [103] Guindon S, Gascuel O. A simple, fast, and accurate algorithm to estimate large phylogenies by maximum likelihood. Syst. Biol., 2003, 52(5): 696-704. [104] Hacker J, Hentschel U, Dobrindt U. Prokaryotic chromosomes and disease. Science, 2003, 301(5634): 790-793. [105] Ullman T A, Itzkowitz S H. Intestinal inflammation and cancer. Gastroenterology, 2011, 140(6): 1807-1816. [106] Round J L, Mazmanian S K. The gut microbiota shapes intestinal immune responses during health and disease. Nat. Rev .Immunol., 2009, 9(5): 313-323. [107] Franco A T, Friedman D B, Nagy T A, Romero-Gallo J, Krishna U, Kendall A, Israel D A, Tegtmeyer N, Washington M K, Peek R M Jr. Delineation of a carcinogenic Helicobacter pylori proteome. Mol. Cell. Proteomics, 2009, 8(8): 19471958. [108] Covacci A, Censini S, Bugnoli M, Petracca R, Burroni D, Macchia G, Massone A, Papini E, Xiang Z, Figura N et al. Molecular characterization of the 128-kDa immunodominant antigen of Helicobacter pylori associated with cytotoxicity and duodenal ulcer. Proc. Natl. Acad. Sci. U.S.A., 1993, 90(12): 5791-5795. [109] Ernst P B, Gold B D. The disease spectrum of Helicobacter pylori: The immunopathogenesis of gastroduodenal ulcer and gastric cancer. Annu. Rev. Microbiol., 2000, 54: 615-640. [110] Uemura N, Okamoto S, Yamamoto S, Matsumura N, Yamaguchi S, Yamakido M, Taniyama K, Sasaki N, Schlemper R J. Helicobacter pylori infection and the development of gastric cancer. N. Engl. J. Med., 2001, 345(11): 784-789. [111] Xia Y, Yamaoka Y, Zhu Q, Matha I, Gao X. A comprehensive sequence and disease correlation analyses for the C-terminal region of CagA protein of Helicobacter pylori. PLoS One, 2009, 4(11): e7736. [112] Eddy S R. Profile hidden Markov models. Bioinformatics, 1998, 14(9): 755-763. [113] Beck D, Settles M, Foster J A. OTUbase: An R infrastructure package for operational taxonomic unit data. Bioinformatics, 2011, 27(12): 1700-1701.
J. Comput. Sci. & Technol., Mar. 2012, Vol.27, No.2 [114] Seshadri R, Kravitz S A, Smarr L, Gilna P, Frazier M. CAMERA: A community resource for metagenomics. PLoS Biol., 2007, 5(3): e75. [115] Meyer F, Paarmann D, D’Souza M, Olson R, Glass E M, Kubal M, Paczian T, Rodriguez A, Stevens R, Wilke A, Wilkening J, Edwards R A. The metagenomics RAST server – a public resource for the automatic phylogenetic and functional analysis of metagenomes. BMC Bioinformatics, 2008, 9: 386. [116] Gerlach W, Stoye J. Taxonomic classification of metagenomic shotgun sequences with CARMA3. Nucleic Acids Res., 2011, 39(14): e91-e91. [117] Giongo A, Crabb D B, Davis-Richardson A G et al. PANGEA: Pipeline for analysis of next generation amplicons. ISME J., 2010, 4(7): 852-861. [118] Horton M, Bodenhausen N, Bergelson J. MARTA: A suite of Java-based tools for assigning taxonomic status to DNA sequences. Bioinformatics, 2010, 26(4): 568-569. [119] Devulder G, Perriere G, Baty F, Flandrois J P. BIBI, a bioinformatics bacterial identification tool. J. Clin. Microbiol., 2003, 41(4): 1785-1787. [120] Caporaso J G, Kuczynski J, Stombaugh J et al. QIIME allows analysis of high-throughput community sequencing data. Nat. Methods, 2010, 7(5): 335-336. [121] Wu D, Hartman A, Ward N, Eisen J A. An automated phylogenetic tree-based small subunit rRNA taxonomy and alignment pipeline (STAP). PLoS One, 2008, 3(7): e2566. [122] Kosakovsky Pond S, Wadhawan S, Chiaromonte F et al. Windshield splatter analysis with the Galaxy metagenomic pipeline. Genome Res., 2009, 19(11): 2144-2153. [123] Rosen G L, Reichenberger E R, Rosenfeld A M. NBC: The Naive Bayes Classification tool webserver for taxonomic classification of metagenomic reads. Bioinformatics, 2011, 27(1): 127-129.
Chao Zhang holds his Master’s degree in computer science from the University of Missouri, and is currently a computer science Ph.D. candidate and statistics Master candidate. His current research includes genomics-based bacterial identification and biomarker detection, highthroughput data analysis and GObased biological network analysis. He is also working on siRNA efficacy prediction and microRNA target prediction. Guolu Zheng is a principle investigator of the USDA-founded Cooperative Research Programs at the Lincoln University in Missouri. He obtained his Ph.D. degree from the University of Arkansans, Fayetteville in 1997. The focus of Dr. Zheng’s research is water quality and food safety. Emphasis is on advancing technology for rapid identification of fecal indicators and pathogens in waterways and foods. His current research is engaged in developing DNA- and Faecalibacterium-based methods for tracking fecal pollution in waters.
Chao Zhang et al.: Bacterial Characterization Based on Genomic Data Shun-Fu Xu is an associate professor and gastroenterologist in the Digestive Department of the First Affiliated Hospital of Nanjing Medical University in China. He obtained his Ph.D. degree from the University of Nanjing Medical University in 2008 and was a visiting scholar in Digital Biology Lab of University of Missouri in the same year. His research includes relationship between gastric cancer and Helicobacter pylori, and bioinformatic studies of Helicobacter pylori. He has published more than 30 papers. He obtained the 2nd Class Prize of Provincial Progressive Science and Technology of Jiangsu Province in 2004, and the 3rd Class of same Prize in 2005.
239
Dong Xu is James C. Dowell Professor and Chair of Computer Science Department, with appointments in the Christopher S. Bond Life Sciences Center and the Informatics Institute at the University of Missouri. He obtained his Ph.D. degree from the University of Illinois, UrbanaChampaign in 1995 and did two-year postdoctoral work at the US National Cancer Institute. He was a Staff Scientist at Oak Ridge National Laboratory until 2003 before joining University of Missouri. His research includes protein structure prediction, high-throughput biological data analyses, in silico studies of plants, microbes, and cancers. He has published more than 190 papers. He is a recipient of 2001 R&D 100 Award, 2003 Federal Laboratory Consortium’s Award of Excellence in Technology Transfer, and 2010 Outstanding Achievement Award from International Society of Intelligent Biological Medicine. He is an Editor in Chief of International Journal of Functional Informatics and Personalised Medicine. He is an Editorial Board member of Current Protein and Peptide Science, Applied and Environmental Microbiology, and International Journal of Data Mining and Bioinformatics.