Liechty, Lin and McDermott (2003) recently de- veloped a sequential .... Feigelson and James P. McDermott of Penn State,. Ashish Mahabal and Robert Brunner ...
Statistical Science 2004, Vol. 19, No. 2, 322–332 DOI 10.1214/088342304000000774 © Institute of Mathematical Statistics, 2004
Some Statistical and Computational Challenges, and Opportunities in Astronomy G. Jogesh Babu and S. George Djorgovski
Abstract. The data complexity and volume of astronomical findings have increased in recent decades due to major technological improvements in instrumentation and data collection methods. The contemporary astronomer is flooded with terabytes of raw data that produce enormous multidimensional catalogs of objects (stars, galaxies, quasars, etc.) numbering in the billions, with hundreds of measured numbers for each object. The astronomical community thus faces a key task: to enable efficient and objective scientific exploitation of enormous multifaceted data sets and the complex links between data and astrophysical theory. In recognition of this task, the National Virtual Observatory (NVO) initiative recently emerged to federate numerous large digital sky archives, and to develop tools to explore and understand these vast volumes of data. The effective use of such integrated massive data sets presents a variety of new challenging statistical and algorithmic problems that require methodological advances. An interdisciplinary team of statisticians, astronomers and computer scientists from The Pennsylvania State University, California Institute of Technology and Carnegie Mellon University is developing statistical methodology for the NVO. A brief glimpse into the Virtual Observatory and the work of the Penn State-led team is provided here. Key words and phrases: National Virtual Observatory, massive data, digital sky surveys, classification. theory of errors, curve fitting and minimax theory. A brief history is given here. The estimation of the error using the range of discrepant astronomical observations was perhaps the most important early encounter with a statistical concept. Hipparchus (2nd century BC) realized that his estimate of the length of a year was not without error, and he used the range to estimate the error. Other early astronomers, until Tycho Brahe (1546–1601), took the liberty of using the “best” of several discrepant observations. Brahe’s use of the mean increased the accuracy of his results, assisting Johannes Kepler (1571–1630) in his rejection of circular models and the discovery of his laws on elliptical planetary orbits (Hald, 1990). In his 1632 Dialogue of Two Chief World Systems, Galileo Galilei included a detailed discussion of what he called “observational” errors and a statistical analysis of the “new star” (supernova) of 1572.
1. INTRODUCTION: HISTORICAL RELATIONSHIP
Astronomy was perhaps the most widely studied field of natural science from antiquity until the 18th century. Observational and deductive astronomy led to the foundations of many important concepts in mathematical statistics, such as least squares, the G. Jogesh Babu is Professor of Statistics, Department of Statistics, Pennsylvania State University, University Park, Pennsylvania 16802, USA (e-mail: babu@stat. psu.edu). S. George Djorgovski is Professor of Astronomy, California Institute of Technology. He is one of the founders of the Virtual Observatory concept and the PI of the Digital Palomar Observatory Sky Survey (DPOSS) at California Institute of Technology, Pasadena, California 91125, USA. 322
CHALLENGES AND OPPORTUNITIES IN ASTRONOMY
Galileo recommended the value that required “the minimum amendments and smallest corrections” possible to the data, effectively the median. Thus Galileo’s analysis already had the rudiments of least absolute deviation estimation. Adrien Legendre published a volume in 1805 on new methods for determining the orbits of comets, which required estimation of a few unknowns from a large system of linear equations. He proposed minimizing sum of squares of errors. Laplace (1747–1827) and Gauss (1777–1855) contributed to the development of this “least squares method” and the mathematical theory of errors over the next several decades. This relationship weakened during the later half of the 19th century as astronomers turned principally toward astrophysics, gaining insight into the physical aspects of the universe, and statistics turned to applications in social sciences and industry. However, during the last few decades, a resurgence of interest in statistical methods has emerged among astronomers, although with different emphases than in the past. One major factor is the flood of data produced by large astronomical surveys at many wave bands. The application of astronomical data to astrophysical questions is becoming increasingly complex, outpacing the capabilities of traditional statistical methods. The summaries above represent only a small sample of the problems in modern observational astronomy that require sophisticated statistical and data analytical techniques. Given the weak connections between the statistical and astronomical communities in recent decades, there is a need for improved communication of existing statistical methods and the concerted development of new methods for astronomy. It should be mentioned here that there are isolated groups of collaborating astronomers and statisticians. Recent cross-disciplinary efforts in astrostatistics have produced valuable resources. A number of conferences have been held in Europe (e.g., Rolfe, 1983; Jaschek and Murtagh, 1990; Subba Rao et al., 1997) and the United States (Feigelson and Babu, 1992, 2003; Babu and Feigelson, 1997), astrostatistical sessions at large meetings are being organized, and an introductory monograph on astrostatistics (Babu and Feigelson, 1996) and a monograph on spatial statistics in cosmology (Martinez and Saar, 2001) have emerged. Today, astronomy is becoming one of the most exciting and rapidly developing field of physical sciences, creating new opportunities for collaborative efforts with statistics. A brief introduction to the opportunities for collaborative work is provided in this article.
323
2. ASTRONOMICAL SURVEYS
Astronomy is the field devoted to the study of physical objects beyond the Earth: our planetary system, the Sun and stars, collectives of stars such as the Milky Way galaxy, galaxies distributed throughout the Universe, including their active galactic nuclei such as quasars, material between these structures, variously called the interplanetary, interstellar and intergalactic media, and cosmology, study of the Universe as a whole. With rare exceptions, astronomical data are derived from observations of electromagnetic radiation produced by distant objects made with telescopes on or in orbit around Earth. Some telescopes are placed into orbit to get above the Earth’s atmosphere, which absorbs or deteriorates most wavelengths of electromagnetic radiation. Observational astronomy is “big science,” with major ground-based telescopes costing hundreds of millions of dollars and space-based observatories costing billions of dollars. Astronomical data from telescopes are first reduced to usable forms, including images (bivariate integer or real functions representing electromagnetic radiation intensity as a function of location in the sky), spectra (univariate intensities as a function of wavelength of electromagnetic radiation) or time series (univariate intensities as a function of observing time). These data structures often mix these forms: for example, a radio interferometer produces a data cube of electromagnetic radiation intensity versus location and wavelength; an X-ray telescope produces a four-dimensional data set of individual photons as a function of location, wavelength and time. An important intermediate data product between the raw telescope data and scientific investigation is the astronomical survey. Common forms for surveys are atlases of sky images at a particular wavelength and multivariate data bases that give properties (columns) for each object (row) observed. Many important surveys are commonly referred to in the astronomical community by their acronyms. Examples of some of the current and forthcoming surveys across the electromagnetic spectrum include FIRST [faint images of the radio sky at twenty centimeters (wavelength)] and NVSS [new VLA (very large array) sky survey] radio surveys (106 sources); MAP (microwave anisotropy probe) and Planck (formerly known as COBRAS/SAMBA—cosmic background radiation anisotropy satellite/satellite for measurement of background anisotropies) microwave band all-sky images; IRAS (infrared astronomical satellite) and SIRTF
324
G. J. BABU AND S. G. DJORGOVSKI
(space infrared telescope facility) mid/far-infrared surveys (105 objects); 2MASS (2-micron all-sky survey) and DENIS [deep near infrared survey (of the southern sky)] near-infrared surveys (108 objects); USNO (United States Naval Observatory), SDSS (Sloan digital sky survey) and DPOSS (digital Palomar Observatory sky survey) visible band surveys (109 objects); ROSAT (Röntgen satellite), Chandra and XMM (X-ray multi-mirror satellite) X-ray surveys (105 sources); and CGRO (Compton gamma-ray observatory) and GLAST (gamma-ray large area space telescope) gamma-ray surveys (103 sources). For details on NASA’s astrophysics data environment, see Bredekamp and Golombek (2003). 3. MAJOR DATA AVALANCHE
Astronomy has become an immensely data-rich field and is growing. A paradigm shift is underway in the very nature of observational astronomy. Whereas in the past a single astronomer or small group might observe a handful of objects, today large digital sky surveys are becoming the norm. Data are already streaming in from surveys such as the 2MASS and the SDSS, which are providing maps of the sky at infrared and optical wavelengths, respectively. The synoptic sky surveys [e.g., solar system patrols such as NEAT (near Earth asteroid team) or LONEOS (Lowell Observatory near Earth object search), GRB patrols such as LOTIS (Livermore optical transient imaging system) or ROTSE (robotic optical transient search experiment), microlensing experiments such as MACHO (massive compact halo object search) and OGLE (optical gravitational lensing experiment), etc.] will add another dimension—time—to the data. Thus, the large digital sky surveys are becoming the dominant source of data in astronomy. There are more than 100 terabytes of data in major archives and it is growing rapidly. A typical sky survey archive has approximately 10 terabytes of image data and a billion detected sources (stars, galaxies, quasars, etc.), with hundreds of measured attributes per source. These surveys span the full range of wavelengths, radio through gamma-ray, yet they are just a taste of the much larger data sets to come. Yearly advances in electronics bring new instruments that double the amount of data collected each year and lead to the exponential growth of information in astronomy. Thus data sets orders of magnitude larger, more complex and more homogeneous than in the past are on the horizon. In comparison, the size of the human genome
is about 1 gigabyte and that of the Library of Congress is about 20 terabytes. Consequently, the data volumes here are several orders of magnitude larger than what astronomers and statisticians are used to dealing with. These massive data sets are also much more complex (e.g., tens or hundreds of measured attributes per source) and higher dimensional in nature than what we are used to. This great opportunity comes with a commensurate technological challenge: how to optimally store, manage, combine, analyze and explore these vast amounts of complex information, and do it quickly and efficiently? Some powerful techniques that already exist can be tested in these new astronomical applications; others will have to be developed, in collaboration, by astronomers, statisticians and computer scientists. The range of astrostatistical challenges is truly vast. A few of these issues are discussed later. 4. PANCHROMATIC VIEW OF THE UNIVERSE
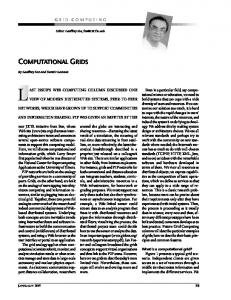
The current and forthcoming data (> 100 terabytes) spans the full range of wavelengths, radio through X-ray and beyond, and potentially provide a panchromatic and less biased view of the universe. The sky looks differently at different wave bands. X-rays and other wave bands such as radio, infrared, ultraviolet and gamma, cannot be seen with the human eye, so they do not have any color in the usual sense. To see invisible wavelengths, detectors such as the instruments on Chandra that are specially designed to see these other wavelengths are needed. Images taken by detectors that see invisible colors are called false color images. The colors used by astronomers to construct a composite picture are not real, but are chosen to bring out important details. Observations at different wavelengths carry important information about the nature of celestial objects. Figure 1 shows X-ray and optical images of two giant galaxy clusters, located 2.5 and 3.1 billion light years from Earth, respectively. The Chandra data (left) provide a detailed temperature map for the hot gas and allow astronomers to precisely determine the total masses of the clusters. Most of the mass is in the form of dark matter. The Hubble data (right) place independent constraints on the masses of the clusters that confirm the Chandra results. A panchromatic approach to the universe reveals a more complete physical picture. Figure 2 shows views of the Crab Nebula (a supernova remnant and pulsar that was first sighted by Chinese astronomers in 1054 AD) at X-ray, optical, infrared and radio. Chandra’s X-ray image of the Crab
CHALLENGES AND OPPORTUNITIES IN ASTRONOMY
325
F IG . 1. X-ray/optical sets of two giant galaxy clusters, Abell 2390 and MS2137.3-2353, located 2.5 and 3.1 billion light years from Earth, respectively. Chandra’s large scale X-ray images (left) show hot gas filling the two giant galaxy clusters, while Hubble’s smaller scale optical images (right) show the distribution of galaxies in the central regions of the same clusters. X-ray images courtesy of NASA/IOTA/Allen et al.; optical images courtesy of the HST.
F IG . 2. Multiwavelength views of the Crab Nebula, a supernova remnant and pulsar that was first sighted by Chinese astronomers in 1054 AD. It is 6000 light years from Earth. Images courtesy of NASA/CXC/SAO.
326
G. J. BABU AND S. G. DJORGOVSKI
F IG . 3. A panchromatic view of the Crab Nebula seen in Figure 2. Image courtesy of NASA/CXC/SAO.
Nebula directly traces the most energetic particles being produced by the pulsar. This amazing image reveals an unprecedented level of detail about the highly energetic particle winds and will allow astronomers to probe deep into the dynamics of this cosmic powerhouse. As time goes on and the electrons move outward, they lose energy to radiation. The diffused optical light comes from intermediate energy particles produced by the pulsar. The infrared radiation comes from electrons that have energies lower than those that produce the optical light. Radio waves come from the lowest energy electrons. They can travel the greatest distance and define the full extent of the nebula. The composite picture in Figure 3 was constructed by overlaying the data from the four wavelengths in Figure 2. Astrophysical phenomena generated by these objects can be understood only by combining data at several wave bands. This requires federation of different sky surveys, matching the source objects in different wavelengths. Another phenomenon revealed by multiwavelength studies is exemplified by Figure 4 (Hornschemeier et al., 2000). Using NASA’s Chandra X-ray observatory, astronomers have made the first long-duration X-ray survey of the Hubble Deep Field North [a small patch of the sky, selected for unprecedented deep imaging by the Hubble Space Telescope (HST) in the visible light and then followed by other deep observations on other wavelengths, including X-ray]. They detected X-rays from six of the galaxies in the field and were surprised by the lack of X-rays from some of the most energetic galaxies in the field. The X-ray emitting objects discovered by the research team are a distant galaxy thought to contain a central giant black hole, three elliptically shaped galaxies, an extremely red distant galaxy and a nearby spiral galaxy. However, it
was very surprising to find that none of the X-ray sources lined up with any of the submillimeter-wave sources. The submillimeter sources are extremely luminous, dusty galaxies that produce large amounts of infrared radiation. This is an example of an astrophysical process where truncation/censoring is present in one or more coordinates. There are no counterparts to nonparametric methods such as product limit estimation in higher dimensions. There is very little work in the statistical literature to handle multivariate data where truncation and/or censoring is present in one or more dimensions. More work needs to be done by statisticians in this area for effective analysis of current and forthcoming astronomical data. Typically, astronomical data start as digital images over a certain portion of the sky at a certain wavelength. Instrumental effects are removed from the data to produce a quantifiable image of flux (light energy per square centimeter per second) as a function of the two spatial coordinates (projected on the sky); in some rare cases, data cubes rather than two-dimensional images are produced, where the third dimension is the wavelength or time. Some source-finding algorithm is then run, which identifies individual (discrete) astronomical sources (e.g., stars, galaxies and quasars) and parametrizes the way their flux is distributed spatially, in wavelength and so forth. The number of independent
F IG . 4. Results of the first long-duration X-ray survey of the Hubble Deep Field North. Chandra detected X-rays from six of the galaxies in the field. A surprise result that must be studied further is the lack of X-rays from some of the extremely luminous galaxies at huge distances (over 10 billion light years) from Earth. The Chandra results raise questions about the current theories used to explain the high energy output of these objects. Optical images courtesy of NASA/HST; X-ray images courtesy of NASA/Pennsylvania State University.
CHALLENGES AND OPPORTUNITIES IN ASTRONOMY
measured parameters for each source then defines the dimensionality of a parameter space, and each source can be represented as a point in this parameter space of observed properties. Examples of parameters include fluxes, flux ratios (also known as colors), sizes, measures of the image shapes and concentrations. Some of the modern digital sky surveys measure hundreds of attributes for each detected source. This parameter space representation then, in principle, contains all the information present in the original data, but in a condensed form: it is associated with the detected sources and ignores the “empty” pixels. Furthermore, the data (which start as panoramic imagery) are transformed into a quantitative form suitable for statistical analysis. The systematic, panchromatic approach will enable new science, in addition to what can be done with individual surveys. It will enable meaningful, effective experiments within these vast data parameter spaces. 5. THE NATIONAL VIRTUAL OBSERVATORY
Many astronomical observations (especially the more traditional ones) consist of measurements of properties of individual, preselected sources or samples thereof (e.g., flux measurements at some wavelength for a sample of 100 nearby spiral galaxies, which for some reason the astronomer wants to know). Such observations, obtained with many different telescopes, instruments, integration times and so forth, are very heterogeneous in their properties (depth, wavelength coverage, spatial resolution, etc.), and as such are not easily converted into homogeneous data sets suitable for a proper statistical analysis. In the recent past, observational astronomy involved such pointed heterogeneous observations (∼ megabyte–gigabyte) with small samples of objects (∼10–1000). The current trend is toward large, homogeneous sky surveys (multiterabytes, with 106 –109 sources) that lead to archives of pointed homogeneous observations. As mentioned earlier, forthcoming projects and sky surveys are expected to deliver data volumes measured in petabytes with repeated, multiple-epoch measurements for billions of sources. For each object, a few to ∼100 parameters are measured, most (but not all) with quantifiable errors and missing data in one or more dimensions. Individually each of these surveys will lead to many advances in our understanding of the physical processes that drive the formation and evolution of the Universe. As seen in the examples above, in combination they will provide the first digital map of the local and distant Universe across many decades of wavelength of the electromagnetic spectrum.
327
The astronomical community thus faces a key task: to enable efficient and objective scientific exploitation of enormous multifaceted data sets. The National Virtual Observatory (NVO) initiative recently emerged, in recognition of this need and in response to a top priority recommendation by the National Academy of Sciences’ Decadal Report on astronomy for 2000– 2010 (Taylor and McKee, 2000), to federate numerous large digital sky archives, both ground based and space based, and to develop tools to explore and understand these vast volumes of data. The effective use of such integrated massive data sets presents a variety of new challenging statistical and algorithmic problems that require methodological advances. A major effort is needed by cross-disciplinary teams of astronomers, computer scientists and statisticians to bring advances in these fields into the toolbox of observational astronomy. The concept of a Virtual Observatory (VO) is now being pursued worldwide; several major projects are under way in Europe and elsewhere. The concept of the Virtual Observatory, its goals, challenges and possible approaches are described, for example, in the report of the National Virtual Observatory Science Definition Team (available at http://nvosdt.org), in a white paper (available at http://www.arXiv.org/abs/astro-ph/0108115) and in numerous articles in the volumes edited by Brunner, Djorgovski and Szalay (2001) and Banday, Zaroubi and Bartelmann (2001). Also see the articles on massive data sets by Djorgovski et al. (2003), Nichol et al. (2003), Strauss (2003), Szalay and Matsubara (2003) and others in the proceedings of the conference titled Statistical Challenges in Modern Astronomy III (Feigelson and Babu, 2003). Many articles on the current status of the NVO appear in the proceedings of the ESO/ESA/NASA/NSF Astronomy Conference (June 2002, Garching, Germany), Toward an International Virtual Observatory (http://www.eso.org/ gen-fac/meetings/vo2002/). Implementation of the NVO involves significant technical challenges on many fronts. Significant efforts deal with applied computing science and information technology aspects, but scientific discovery requires more than effective storage and distribution of information. How can a data set that comprises hundreds of millions of objects each with dozens of attributes be explored? How can correlations and anomalies within the data sets be identified? How can the detected sources to isolate subpopulations of astrophysical interest be classified? How can the data to constrain astrophysical interpretation, which often involve highly nonlinear
328
G. J. BABU AND S. G. DJORGOVSKI
parametric functions derived from fields such as physical cosmology, stellar structure or atomic physics, be used? The challenges posed by the analysis of large and complex data sets expected in the NVO-based research are driven both by the size and the complexity of the data sets (billions of data vectors in parameter spaces of tens or hundreds of dimensions), by the heterogeneity of the data and measurement errors, by selection effects (Figure 4) and censored data, and by the intrinsic clustering properties (functional form, topology) of the data distribution in the parameter space of observed attributes. The technological challenges for the NVO include development of efficient data base architectures and query mechanisms, and data standards. Techniques are needed for systematic exploration of the observable parameter spaces of measured source attributes from federated sky surveys to search for rare or even new types of objects. These will include supervised and unsupervised classification and clustering analysis techniques. Scientific questions one may wish to address include objective determination of the numbers of object classes present in the data, and the membership probabilities for each source; searches for unusual, rare, or even new types of objects and phenomena; and discovery of physically interesting (generally multivariate) correlations which may be present in some of the clusters. A key challenge for the NVO will be developing ways to simultaneously analyze data from several of the dozens of astronomical data bases available today. Each of these data bases is organized differently, which makes it quite difficult to perform analyses of data from several collections simultaneously. The NVO would not only link the major astronomical data assets into an integrated, but virtual, system to allow automated multiwavelength search and discovery among all cataloged astronomical objects, but also would provide advanced statistical and data analysis methods for the astronomical community. Enormous opportunities exist for sustained statistical research. It will create data standards and tools for mining data, and provide a link between the exciting astronomical data and the academic communities in many disciplines including statistics. Most importantly, the NVO will provide access to powerful new resources to scientists and students everywhere, who could do first-rate observational astronomy regardless of their access to large ground-based telescopes. The NVO also will facilitate the inclusion of new massive data sets,
and optimize the design of future surveys and space missions. The challenges posed by the analysis of massive data sets in astronomy (e.g., in the context of a VO) are common to many or all information-intensive sciences today, with potential uses in many other modern fields of endeavor: technology, commerce, national security and so forth. Thus, the tools and the methodologies developed in this context are likely to find useful applications elsewhere, with potentially great interdisciplinary and societal benefits. 6. CURRENT NVO RELATED STATISTICAL AND DATA ANALYTIC EFFORTS
Our team, consisting of statisticians, computer scientists and astronomers from Penn State, Carnegie Mellon and Caltech, is addressing some of the critically important statistical challenges raised by the NVO. A brief description of our team’s efforts on a few of these issues is presented here. Our aim is not to present detailed statistical analysis, but to point to work in progress by the collaborative teams. 6.1 Low-Storage Percentile Estimation for Streaming Massive Data
In dealing with massive or streaming data sets, conventional statistical methods of testing hypotheses and building models for prediction may not be viable. When the data are streaming in from telescopes, we do not have access to the entire data set at once; we only have access to the data points sequentially. Even the computation of test statistics and estimates of parameters such as the simple median, which requires sorting of the entire data, may pose difficulty in such cases. Standard sorting algorithms often require that the entire data set be placed into memory. When confronted with data bases containing millions or billions of objects, this may be impossible due to the limitations on memory storage and CPU. Liechty, Lin and McDermott (2003) recently developed a sequential procedure to estimate a pth quantile (0 < p < 1). It is a low-storage sequential algorithm that uses estimated ranks and weights to calculate scores that determine the most attractive candidate data points to keep as the estimate of the quantile. This method requires storing only a fixed number, say m, in memory for sorting and ranking. Initially, each of these points is given a weight and a score based on p. Now a
CHALLENGES AND OPPORTUNITIES IN ASTRONOMY
new point from the data set is put into the array and all the points in the existing array above it have their ranks increased by 1. The weights and scores are updated for these m + 1 points. The point with the largest score is then be dropped from the array and the process is repeated. See Liechty, Lin and McDermott (2003) for the details. Figure 5 shows simulation results for estimation of the median with m = 50. In this example, data of size n = 100,000 points are generated from a standard Cauchy distribution. In addition to the estimates of the median, the sample median based on the points seen up to any given stage is also computed sequentially for comparison purposes. The figure indicates that the estimates obtained by this method converge very fast. The method is extended to estimate a number of quantiles, including those in the tail region, simultaneously. These estimates can now be used to estimate the probability density function. Density estimation based on this procedure and a multivariate extension are under investigation. The multivariate extension will help in the clustering analysis when the data are streaming.
F IG . 5. Sequential plot of the difference between the median estimated using the low-storage method and the sample median for a Cauchy data set based on 100,000 points.
329
6.2 Multivariate Classification
Large multivariate astronomical data bases frequently contain mixtures of populations which must be distinguished from each other. The main point here is that astronomers want to know how many distinct classes of sources there are on the basis of some statistical criterion. Ultimately, the goal is to get a model which fits the data in some defined way. Typically, astronomers do not have a specific mathematical model in mind. Typical scientific questions posed include: • How many statistically distinct classes of objects are in this data set and which objects are to be assigned to which classes, along with association probabilities? Are previously unknown classes of objects present? • Are there rare outliers, individual objects with a low probability of belonging to any one of the dominant classes? Discovery of previously unknown types of objects is possible. • Are there interesting correlations among the properties of objects in any given class and what are the optimal analytical expressions of such correlations? Some of the correlations may be spurious (e.g., driven by sample selection effects) or simply uninteresting (e.g., objects brighter in one optical bandpass will tend to be brighter in another optical bandpass). Several complications may arise. The object classes from multivariate “clouds” in the parameter space may have a power law or exponential tails in some or all of the dimensions, and some may have sharp cutoffs. The clouds may be well separated in some of the dimensions, but not in others. How can we objectively decide which dimensions are irrelevant and which ones are useful? The topology of clustering may not be simple: there may be clusters within clusters, holes in the data distribution, multiply connected clusters and so forth (Djorgovski et al., 2003; Nichol et al., 2003). A classical approach to multivariate classification involves maximizing a likelihood; the expectation maximization (EM) algorithm is a widely used method for this purpose. A mixture model of N Gaussians, where N is determined from the data, to adaptively smooth and parametrize complex, multidimensional astronomical data sets is being addressed. Such nonparametric density estimators are computationally impractical for today’s enormous data bases. The strategy is to use fast multiresolutional, k-dimensional (mrKD) tree codes. Figure 6 shows an example of a mrKD tree which is an
330
G. J. BABU AND S. G. DJORGOVSKI
F IG . 6. A k-dimensional tree. The data are represented as a tree of nodes; each node has two daughter nodes as one splits the data in two (along the axis with the largest dimension). On the left are the nodes for the third level of the tree (the top level has one node; the second level has two nodes). The right side plot shows level 5 in the tree. The individual datum points in this two-dimensional space are shown as dots, while the bounding boxes of the nodes are shown as lines. The cached statistics, mean and covariance, are plotted as a large dot and ellipse. Images courtesy of Robert Nichol.
optimal index scheme that utilizes the emerging technology of cached statistics in computer science to store sufficient statistics for the EM calculation at each node in the tree. For various counting queries, one does not need to traverse the whole tree, but simply use these stored statistics to rapidly return the necessary count. Genovese and Wasserman (2000) developed a statistical theory to study the behavior of complex mixture models. When the number of components of the mixture is allowed to increase as sample size increases, the model is called a mixture sieve. Standard penalized likelihoods, such as the Bayesian information criterion (BIC) or Akaike information criterion (AIC), may not always be suitable for astronomical data. A general jackknife type (leave-one-out) likelihood procedure that reduces bias substantially and works better than AIC and BIC is under development. For high energy astronomy, most detections reside in the Poisson regime where Gaussian mixture models may be less appropriate. Most astronomical applications include two types of noise: (1) random projection of uninteresting astronomical objects or detector background on top of the signal under study and (2) measurement errors, which often are correlated with signal intensity. The first type can be treated with a smooth component in the mixture model, while the second type requires the incorporation of errors into the data of the mixture model.
6.3 Search for Rare Objects
The concept of exploring the universe through a systematic study of the observable parameter space was pioneered by Zwicky in the 1930s (Zwicky, 1957). Some astronomical objects such as high-redshift quasars are rare to locate. How do we systematically search in massive data bases and classify rare objects? Figure 7 illustrates an example of discoveries of high-redshift quasars and type-2 quasars (quasars where the luminous “central engine” and the region close to it, from which the characteristic broad emission lines originate, are obscured by a dusty disk or a torus, leaving only some indirect or subtle observable signatures that such a luminous object is present in an otherwise inconspicuous galaxy) in the digital Palomar observatory sky survey (DPOSS). Density estimation using EM–AIC scoring in color space helps in outlier detection. A color is defined as the ratio of fluxes (brightness) at two different wavelengths; it does not depend on the distance to the source. These ideas extend to arbitrary dimensional color space (space whose axes are object colors), where the ability to visualize data without projecting down to a lower dimensionality subspace is lost. These quasars were selected in a very unsophisticated manner in this color space. Since the distribution is very clearly non-Gaussian, the best fit Gaussian from the core of the stellar locus is evaluated using the quartiles. Whereas quasars are
CHALLENGES AND OPPORTUNITIES IN ASTRONOMY
331
7. CONCLUSIONS
F IG . 7. An example of a color parameter space selection of astrophysically interesting types of objects (high-redshift and type-2 quasars) from DPOSS. The dots are normal stars with r ∼ 19 mag. Solid circles are some of the high-redshift (z > 4; z is the customary notation for the redshift, which is a nonlinear measure of distance in cosmology) quasars; open circles are some of the type-2 quasars found in this survey.
morphologically indistinguishable from ordinary stars, this color parameter space offers good discrimination among these types of objects (Djorgovski et al., 2001). For high energy astronomy, most detections reside in the Poisson regime, where Gaussian mixture models may be less appropriate. Mixture models based on other profiles including Poisson, mixtures of Gaussian with very different variances but the same means (used to model the point spread functions of telescopes), and galaxy profile functions need to be examined. Another approach to outlier detection that involves Bayesian networks and mixture modeling is under investigation. Rather than using a single joint probability function, which would require a prohibitively large number of parameters to fit, a Bayesian network factors the representation into smaller conditional probability representations for subsets of the variables. The factored model has fewer parameters than would be necessary to model the full density function directly. Bayes nets are most useful when their structure can be estimated from data. Estimation occurs at two levels. The outer loop of the algorithm searches for the best top level structure. Then, for each candidate top level structure, the model for each variable and its parents must be estimated.
The technical and methodological challenges that are faced by the virtual observatory are common to most data-intensive sciences today (commerce, industry, security). Interdisciplinary exchanges between fields such as astronomy, physics, biology and earth sciences are highly desirable to avoid wasteful duplication of effort and cost. The old research methodologies, geared to deal with data sets many orders of magnitude smaller and simpler, are no longer adequate. The size of the data set affords us the opportunity to answer many interesting cosmological questions, but also presents many interesting statistical and computational challenges. For example, in searching for clusters of galaxies, we must account for background clutter, measurement error and the presence of unusual shapes such as filaments and sheets. Effective techniques are needed to deal with these problems on a large scale. The key issues are methodological: we have to learn to ask the new kinds of questions enabled by the massive data sets and the current technology. Astronomers’ need for advanced statistical methods is reciprocated by statisticians’ need for interaction with practicing scientists in many fields. Confrontation with astrostatistical challenges nurtures the development of statistical methodology that will have potential applications to other areas. This is especially true for the methods developed to analyze large data bases, which may find applications in market research, lowstorage sequential signal processing and multimedia traffic flows. Although relatively few statisticians have seriously engaged in astrostatistical research or consulting to date, a number of leading statisticians believe that the ground is unusually fertile for growth. Hundreds of studies of methodological interest are published annually in astronomy, and some of the most critical astrophysical questions of the 21st century have a major astrostatistical component. Effective visualization of high-dimensional parameter spaces and multivariate correlations is needed. Our favorite graphics package is not enough to handle such massive highdimensional data. A hybrid/interactive clustering and visualization approach is needed. Great opportunities for collaborations and partnerships between astronomers, applied computer scientists and statisticians exist. Problems and challenges posed by the new astronomy may enrich and stimulate new computer science and statistical developments. The NVO will serve as an engine of discovery for astronomy in the 21st century.
332
G. J. BABU AND S. G. DJORGOVSKI
ACKNOWLEDGMENTS
This work was supported in part by NSF Grant DMS-01-01360. We are very thankful to Eric D. Feigelson and James P. McDermott of Penn State, Ashish Mahabal and Robert Brunner of Caltech, and Robert Nichol and Larry Wasserman of Carnegie Mellon University for providing illustrations and examples. We acknowledge useful discussions with many colleagues on these issues. S. George Djorgovski acknowledges partial support from the NASA AISRP program. REFERENCES BABU , G. J. and F EIGELSON , E. D. (1996). Astrostatistics. Chapman and Hall, London. BABU , G. J. and F EIGELSON , E. D., eds. (1997). Statistical Challenges in Modern Astronomy II. Springer, New York. BANDAY, A. J., Z AROUBI , S. and BARTELMANN , M. L., eds. (2001). Mining the Sky: Proc. MPA/ESO/MPE Workshop. Springer, Heidelberg. B REDEKAMP, J. H. and G OLOMBEK , D. A. (2003). NASA’s astrophysics data environment. In Statistical Challenges in Astronomy (E. D. Feigelson and G. J. Babu, eds.) 103–112. Springer, New York. B RUNNER , R. J., D JORGOVSKI , S. G. and S ZALAY, A. S., eds. (2001). Virtual Observatories of the Future. Astronomical Society of the Pacific, San Francisco. D JORGOVSKI , S. G., B RUNNER , R., M AHABAL , A., W ILLIAMS , R., G RANAT, R. and S TOLORZ , P. (2003). Challenges for cluster analysis in a virtual observatory. In Statistical Challenges in Astronomy (E. D. Feigelson and G. J. Babu, eds.) 127–138. Springer, New York. D JORGOVSKI , S. G., M AHABAL , A., B RUNNER , R., G AL , R. R., C ASTRO , S., DE C ARVALHO , R. R. and O DEWAHN , S. C. (2001). Searches for rare and new types of objects. In Virtual Observatories of the Future (R. Brunner, S. G. Djorgovski and A. Szalay, eds.) 52–63. Astronomical Society of the Pacific, San Francisco.
F EIGELSON , E. D. and BABU , G. J., eds. (1992). Statistical Challenges in Modern Astronomy. Springer, New York. F EIGELSON , E. D. and BABU , G. J., eds. (2003). Statistical Challenges in Astronomy. Springer, New York. G ENOVESE , C. R. and WASSERMAN , L. (2000). Rates of convergence for the Gaussian mixture sieve. Ann. Statist. 28 1105–1127. H ALD , A. (1990). A History of Probability and Statistics and Their Applications before 1750. Wiley, New York. H ORNSCHEMEIER , A. E. et al. (2000). X-ray sources in the Hubble deep field detected by Chandra. Astrophysical J. 541 49–53. JASCHEK , C. and M URTAGH , F., eds. (1990). Errors, Bias and Uncertainties in Astronomy. Cambridge Univ. Press. L IECHTY, J. C., L IN , D. K. J. and M C D ERMOTT, J. P. (2003). Single-pass low-storage arbitrary quantile estimation for massive datasets. Statist. Comput. 13 91–100. M ARTINEZ , V. J. and S AAR , E. (2001). Statistics of the Galaxy Distribution. Chapman and Hall, New York. N ICHOL , R. C. et al. (2003). Computational astrostatistics: Fast and efficient tools for analyzing huge astronomical data sources. In Statistical Challenges in Astronomy (E. D. Feigelson and G. J. Babu, eds.) 265–276. Springer, New York. ROLFE , E. J., ed. (1983). Statistical methods in astronomy. Publication ESA SP 201, European Space Agency Scientific & Technical Publications, Noordwijk, Netherlands. S TRAUSS , M. A. (2003). Statistical and astronomical challenges in the Sloan digital sky survey. In Statistical Challenges in Astronomy (E. D. Feigelson and G. J. Babu, eds.) 113–123. Springer, New York. S UBBA R AO , T., P RIESTLEY, M. B. and L ESSI , O. (1997). Applications of Times Series Analysis in Astronomy and Meteorology. Chapman and Hall, London. S ZALAY, A. S. and M ATSUBARA , T. (2003). Analyzing large data sets in cosmology. In Statistical Challenges in Astronomy (E. D. Feigelson and G. J. Babu, eds.) 161–174. Springer, New York. TAYLOR , J. and M C K EE , C. (2000). Astronomy and Astrophysics in the New Millenium. Natl. Acad. Sci.–Natl. Res. Council Press, Washington, DC. Z WICKY, F. (1957). Morphological Astronomy. Springer, Berlin.