May 12, 2014 - in a neighborhood â A research project to improve the quality of life in cities. .... the well documented study of dispersion around a single cube ...
SMART CITY EXPO WORLD CONGRESS 2014
Computational Fluid Dynamics as a tool to predict the air pollution dispersion in a neighborhood – A research project to improve the quality of life in cities. Gilles Triscone, Nabil Abdennadher, Christophe Balistreri, Olivier Donzé, Davide Greco, Patrick Haas, Hasret Haas‐Peköz, Tamer Mohamed‐Nour, Pierre Munier, Piero Pontelandolfo, Roberto Putzu, Jacques Richard and Hervé Sthioul. HES‐SO // University of Applied Sciences Western Switzerland, 4 rue de la Prairie, 1202 Geneva, Switzerland. Nicolas Delley. HES‐SO // University of Applied Sciences Western Switzerland, Route de Cheseaux 1, 1401 Yverdon‐ les‐Bains, Switzerland. David Choffat and Elena‐Lavinia Niederhäuser. HES‐SO // University of Applied Sciences Western Switzerland, Boulevard de Pérolles 80, Case postale 32, 1705 Fribourg, Switzerland. Roger Schaer and Henning Müller. HES‐SO // University of Applied Sciences Western Switzerland, Rue de la Plaine 2, Case postale 80, 3960 Sierre, Switzerland. Jean Decaix, Sylvain Richard and Cécile Münch‐Alligné. HES‐SO // University of Applied Sciences Western Switzerland, Route du Rawyl 47,Case postale 2134, 1950 Sion 2, Switzerland. Pierre Kunz. Service de l'air, du bruit et des rayonnements non ionisants, Avenue Sainte‐Clotilde 23, Case postale 78, 1211 Genève 8, Switzerland. Fabienne Despot. SEDE Ltd., Rue du Midi 33, Case Postale 1126, 1800 Vevey, Switzerland. KEYWORDS: air pollution, pollutants dispersion, CFD. ABSTRACT In large cities, pollution composed of many different chemical components and small particles is an important public health problem that affects especially children and people presenting breathing difficulties. One challenge for public authorities is to respect the norms given by the central state, but how? Today, concrete methods for reducing pollution are perceived by the majority of citizens as constraints. However, the authorities have the possibility of modifying the wind's action by imposing architectural constraints, such as building emplacement and roof structure. This is the main objective of the Geneva "Clean City" project financed by the University of Applied Sciences Western Switzerland. "Clean City" focuses its research on one of Geneva’s polluted neighborhoods called Pâquis which is situated directly on the Geneva lake front. The project attempts to understand the dispersion of pollution from an experimental and a numerical point of view. After validation of the technique for a simple case, we compare environmental measurements on a 1/500 3D scale model of the Pâquis Date: May2014
1
SMART CITY EXPO WORLD CONGRESS 2014
installed in an instrumented wind tunnel with Computational Fluid Dynamics (CFD) simulation obtained with the help of cloud computing. In Barcelona, we will show the first experimental measurements and simulated “Clean City” results. 1 Introduction As in many large cities around the world, the atmosphere of some neighborhoods are often badly polluted, especially during wintertime when the central heating systems are working. This is an important health concern for the state services in charge of air protection. But, as is well known, it is difficult, for many reasons, to take action that would bring the pollution levels to acceptable safe values. Because of that difficulty, millions of people are exposed every day to "high" or "very high" levels of air pollution. Since 2005, the World Health Organization (WHO) has provided guidelines concerning air quality and drinking water quality. Concerning air quality[1], the guidelines focus on different pollution gases such as ozone, nitrogen dioxide, sulfur dioxide, and particulate matter. 1.1 Others studies in the same field There are an increasing number of research projects related to urban climate such as Clim2[2], a project of the city of Paris. However, to our knowledge, they do not achieve the goal of providing a complete multidisciplinary tool for the decision‐making process to aid the project planner on questions of air currents at the street level for the entire town.
Previously published studies have tried to solve the problem of calculating the temperature related to local albedo or have focused on experimental tests of air movements. Other projects (eg. ACCLIMAT[3]) try to predict local weather changes in terms of temperature, rainfall, etc. due to urban development[4]; but this is always in the context of global trends (problems of high granularity). Dispersion of pollutants using Computational Fluid Dynamics (CFD) is currently being studied by many research groups. See papers by Blocken et al.[5] or by Huijbregts et al.[6].
Other studies involve physical and/or coupling of different physical models to describe different situations while avoiding the problems associated with extensive computation time. See also Ref. [7] 1.2 Clean City project In the Geneva Pâquis neighborhood, the air quality is generally poor for nitrogen dioxide and the PM10 particle pollutions, as shown in figure 1, even though this area is on the lakefront and exposed to wind! At the present time we do not understand why the air quality is so poor, and because of that, it is difficult to propose actions or constraints without knowing if the results will be significant.
Date: May2014
2
SMART CITY EXPO WORLD CONGRESS 2014
Figure 1. Left map: average 2004 to 2011 NO2 concentration in air in Geneva[8]. The Pâquis neighborhood is the red‐brown area situated north of the lake. Right histogram:number of days per year when the PM10 concentration exceeded the legal limit (50 g/m3) in town "Urbain" area, in suburban "Suburbain" area and in the country side "Rural"[8].
With the help of new powerful computers, the availability of cloud computing and many new breakthrough technologies, we believe that Computational Fluid Dynamics (CFD) may help to give a solution for town planners in charge of making the cities of tomorrow. This is the aim of this extensive research project, associating four Swiss engineering schools and two partners, one institutional and one commercial. In this paper and in Barcelona this autumn 2014 we will show the first results of a CFD simulation for an entire neighborhood with a cell mesh not larger than 0.5 meter. The main idea of the project is to validate the simulation with measurements on a real experimental representation of the Pâquis area at a scale of 1/500 in a wind tunnel under well‐defined conditions. In case of success, these tools should help town planners improve air currents in any town. They will also allow services in charge of air protection to justify their proposals. 2 Tools we set up to resolve the problem To solve the problem we set up multidisciplinary teams in the fields of: Computer‐aided design (CAD): model of the town obtained using Unmanned Aerial Vehicle (UAV) imagery that allows engineers to obtain 2D maps and 3D models with an accuracy of 5 cm; CAD model with the help of the “Territory Information System” called SIT Geneva[9]; 3D printing to produce a 1/500 scale model; Micro engineering team for the instrumentation needed on the model; Mechanical team for the wind tunnel experiments; Computer hardware team for providing the necessary computer power; Software development, especially for the flow model, turbulence, reactions, etc., using CFD simulation software, OpenFOAM[10]; Consolidation of the results using commercial software, ANSYS Fluent[11]; Surface and air pollution measurements with the help of an instrumented UAV. Technical contributions from four University of Applied Sciences engineering schools of Western Switzerland, SEDE, Ltd., and the Geneva air protection service are acknowledged. Date: May2014
3
SMART CITY EXPO WORLD CONGRESS 2014
3 Experimental 3.1 3D CAD Pâquis Geneva neighborhood and the model made by rapid prototyping 3.1.1 From the SITG database As in many towns in Switzerland, Geneva has its own Information Territory System called SITG[9]. Using this data base we can model the Pâquis neighborhood in 3D with a resolution on the order of one decimeter but with considerable manual work, especially when modeling two adjoining buildings in order to obtain usable CAD files. Finally, after much painstaking work, we were able to obtain acceptable CAD files which were used for the 3D prototyping and the CFD simulations. 3.1.2 From the UAV's acquisition flights In order to work without having an Information Territory System and to be able to use the developed method in any location, we also obtained the CAD model using another method. To do that, we used a UAV R‐Pod which acquired 250 orthophotos in 90 minutes at 140 m altitude and then generating the CAD 3D model with the help of three different software packages: Pix4D, Socet Set and Orima, (see Ref.[12] for more details). The Ground Sampling Distance (GSD: size of area represented by each pixel in a digital photo) was 5cm. Figure 2 shows the flight planning and the raw 3D objects.
Figure 2. Flight planning of the UAV over the Pâquis neighborhood (left) and the raw 3D objects obtained, shown using the help of Google Earth.
Even if the model needs manual retouching, especially for adjoining buildings, the UAV method used to obtain the 3D CAD model of an entire neighborhood was successful. More details can be found in Ref.[13]. 3.1.3 3D 1/500 Pâquis model The model was obtained using 3D rapid prototyping using a Z Printer 450 from 3Dsystems. The model shown in figure 3 is constituted of about 80 different 3D parts 25cm x 25cm each, joined together to obtain a neighborhood model about 2.7m long and 1.9m wide. The pollution caused by the central heating systems and road traffic are simulated in the model by one roof chimney per building connected to an SF6 pressurized gas bottle and by holes in the streets with the diffusion of the same gas.
Date: May2014
4
SMART CITY EXPO WORLD CONGRESS 2014
Figure 3. UAV image of the chosen region of interest (left) and the model during assembly (right).
3.1.4 3D CAD model for CFD studies At the present time researchers are still working on the meshing of the model. It will be finished around June 2014 with about 50 billion hexacore cells representing a dimension of around 0.5 meter. When finished, we will be able the start the CFD simulations. The first results will be available soon. 3.2 UAV environmental measurements on town For the environmental measurements we used a UAV that allows stationary flights. This UAV is based on a hexacopter from the Fly‐n‐Sense company. The UAV can be equipped with PM10, O3 and NO2 sensors. The system records wind speed and different parameters such as temperature, pressure, position, altitude, etc. Thus we can obtain detailed maps of pollution concentration and phenomena related to particle movements. The pollutant diffusion can be outlined with a positioning tolerance smaller than one meter. For this project, the main objective of the UAV measurement campaign was to determine boundary conditions for CFD calculations at the borders of the Pâquis area. Figure 4 shows the UAV and a simulation of the air circulation around it which allows a better understanding of the measurement region.
Figure 4. The UAV hexacopter carrying the NO2 sensor (left). The image on the right shows a simulation of the air movement around the UAV which allows a better understanding of the measurement region.
Date: May2014
5
SMART CITY EXPO WORLD CONGRESS 2014
Patrick Haas et al. in the 32nd AIAA Applied Aerodynamics 2014 in Atlanta will present the details of this work. 3.3 Hardware and software choices At the beginning of this project we decided to use open source CFD software called OpenFOAM[10]. Based on that choice, the team in charge of the computer hardware worked in two parallel methods. One is based on home hardware clusters and the second is based on local and commercial cloud solutions. In order to test the different computer infrastructures, we used an existing 3D CAD model of the Geneva Bank neighborhood as shown in figure 5. Les paramètres requis sont manquants ou erronés. Figure 5. The 3D CAD Geneva Bank neighborhood meshes with 40 billion tetrahedral cells as an existing test model for validating the computer hardware performance.
The study has shown that a solution is possible using a commercial cloud application: Amazon Elastic Compute Cloud (Amazon EC2)[14]. Based on Cloudflu, this is basically a series of Python scripts which make the use of OpenFOAM with Amazon EC2 instances easier. We have a few scripts to: 1. upload the data; 2. automatically start and configure one or more EC2 instances which already have OpenFOAM installed (and link them together); 3. decompose and distribute an OpenFOAM case; 4. run the solver and obtain the results. See Ref. [15]. A typical simulation time takes about four hours for a price of about 12 $. 3.4 Diffusion models in a first approach In order to develop a diffusion model and to determine the type of solver to be implemented in OpenFOAM, a simplified case, well documented in the literature, is used as a reference. We chose the well documented study of dispersion around a single cube according to the work of RN Meroney & T. Stathopoulos; see Ref.[16,17,18,19]. The results of these studies are derived from numerical simulations[18,19] and others, and have the advantage of being the results of experiments conducted in wind tunnels[16,17]. As a first step we have verified on a hexahedral mesh of 0.5 billion cells, the convergence of the simulation OpenFOAM and compared the results with two commercial CFD software packages[11]: ANSYS Fluent and ANSYS CFX. To do that we used the turbulence model k‐ε RNG that is already implemented in commercial software. A simple diffusion model based on a scalar transport equation was implemented in OpenFOAM. The resulting code was called "simpleTransportFoam". The modified code simulates the turbulence and the scalar transport with an isotropic model. Despite this simplification, the results obtained with this routine are in good agreement with those obtained using commercial software. Figure 6 shows the current streamlines and pollutant concentration around the cube. As shown in figure 7 we obtain good agreement. More details concerning this work and also the influence of the meshing and the solver will be published shortly. Date: May2014
6
SMART CITY EXPO WORLD CONGRESS 2014
Figure 6. Illustration of the current streamlines around the cube (left) and the pollutant concentration (center) obtained by simulation.
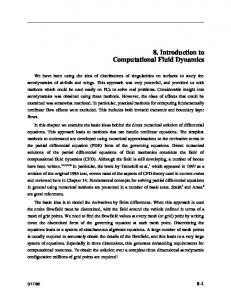
Figure 7. Concentration of the pollutant on the cube and behind the cube (left graph) and in the wake (right graph) versus the distance obtained with OpenFOAM, CFX and Fluent. The concentration and the distance are without dimension (arbitrary scale).
3.5 Experimental measurements in wind tunnel 3.5.1 Experimental climatic conditions that were chosen To validate the fact that the CFD may help the town planner to estimate the pollution dispersions for their urban projects, we decided to use a real Geneva neighborhood that is strongly polluted even under the conditions of a strong east wind called "bise". The wind tunnel axis with respect to the 3D model was put in the same direction as the "bise". This is a well‐defined experimental situation that can be compared to the simulation results. The authors would like to emphasize that the experimental situation does not have the objective of representing the real case of the Pâquis neighborhood but rather to establish a complex experimental case which allows comparison with CFD investigations. 3.5.2 The instrumented 3D model As shown in figure 8, the 3D model is equipped with an SF6 gas distribution system with three different tanks simulating three different pollutant mass flows rejected by the central heating systems. Depending on the type of furnace (oil or gas) and the building energy consumption, we classed the buildings in three categories. In the model, each of them was connected to an SF6 pressure bottle with identical plastic tubes – all the same length. This allows using the 3D model to simulate the rejection of pollution by the Pâquis neighborhood. In a next step we will simulate car traffic pollution by using holes in the streets and injecting SF6.
Date: May2014
7
SMART CITY EXPO WORLD CONGRESS 2014
Figure 8. The model is connected to a SF6 gas distribution system that allows each buildingto simulate the rejection of pollution.
To measure the SF6 in the 3D model we used a Photoacoustic Gas Monitor INNOVA 1412i from LumaSense technologies. The gas inlet head is connected to a large automated three axes displacement system installed above the roof of the wind tunnel test section. The translator allows us to measure the SF6 concentration anywhere in the 3D model. Figure 9 shows the 3D model installed in the wind tunnel.
Figure 9. The 3D model in place inside the wind tunnel for SF6, wind speed fields, etc. measurements. On the top the SF6 gas inlet head connected to a 3 axes translator.
4 Progress of the project "Clean City" For the pollution measurements in the neighborhood we have 8 fixed sensors, 2 meters above ground. For the CFD simulation we have to define the conditions at the edge of the simulated area. These conditions are determined using the instrumented hexacopter UAV. Measurements are underway. From experimental point of view we are making our first measurements on the 3D model mounted in the wind tunnel. We have checked and have tested the system such as the software that controls the three axes translator, the reproducibility of the measurements, etc. Now everything is ready for measurements under well‐defined wind conditions. Adequate computer power (the cloud) is available for doing the simulation. At the present time we are waiting for an adequate meshing in order to run the first simulation. It will be available soon. Date: May2014
8
SMART CITY EXPO WORLD CONGRESS 2014
5 Conclusions and continuation of the project Even if we have encountered and will encounter many difficulties, the "Clean City" multidisciplinary project, started in 2011, will produce its first results soon. We are confident that the proposed method will be a useful tool for urban planners and will be helpful. However we understand that progress must be made in order to automate the CAD model file for the CFD simulation. All the scientists involved in this project are enthusiastic about presenting the results at the WSB14 conference in Barcelona. 6 Acknowledgments This work is supported by the University of Applied Sciences Western Switzerland ‐ HES‐SO. REFERENCES [1] WHO Air quality guidelines for particulate matter, ozone, nitrogen dioxide and sulfur dioxide, Global update 2005, Summary of risk assessment. Available online at: http://whqlibdoc.who.int/hq/2006/WHO_SDE_PHE_OEH_06.02_eng.pdf, [Accessed 12 April 2014]. [2] Etude d’impacts des équipements de climatisation sur la température de l’air dans l'agglomération parisienne. Available online at: http://www.cnrm‐game‐meteo.fr/spip.php?article370, [Accessed May 12, 2014]. [3] Adaptation au Changement CLIMatique de l'Aggloméeation Toulousaine, http://www.cnrm.meteo.fr/ville.climat/spip.php?rubrique46, [Accessed May 12, 2014]. [4] Centre de Recherche en Climatologie, http://climatologie.u‐bourgogne.fr/, [Accessed May 12, 2014]. [5] Blocken, B., Tominaga, Y., Stathopoulos, T., CFD simulation of micro‐scale pollutant dispersion in the built environment. Available online at: http://sts.bwk.tue.nl/urbanphysics/pdf/2013_BAE_Virtual_Special_Issue_Preprint.pdf, [Accessed 9 Mai 2014]. [6] Huijbregts, Z. , Blocken, B., Gousseau, P., Stathopoulos, T.,van Heijst, G.J.F., CFD simulation of pollutant gas dispersion in downtown Montreal, Cananda, http://sts.bwk.tue.nl/urbanphysics/Gas dispersion in downtown Montreal.htm, [Accessed May 12, 2014]. [7] International Association for Urban Climate, http://www.urban‐climate.org/, [Accessed May 12, 2014]. [8] Qualité de l'air 2011 – Service de protection de l'air. Available online at: http://etat.geneve.ch/dt/SilverpeasWebFileServer/Rapport_ROPAG_2011.pdf?ComponentId=kmelia 207&SourceFile=1340267017987.pdf&MimeType=application/pdf&Directory=Attachment/Images/, [Accessed May 12, 2014]. [9] SITG – Le territoire Genevois à la carte, http://ge.ch/sitg/, [Accessed May 12, 2014]. Date: May2014
9
SMART CITY EXPO WORLD CONGRESS 2014
[10] OpenFOAM is a free, open source CFD software package developed by OpenCFD Ltd at ESI Group and distributed by the OpenFOAM Foundation, http://www.openfoam.com/, [Accessed May 12, 2014]. [11] ANSYS Fluent is a commercial CFD simulation software used worldwide, http://www.ansys.com/, [Accessed May 12, 2014]. [12] Gervaix, F. and Ferreira, N., 2011. Rapid, Rich And Reliable Photogrammetry On Demand (R‐ Pod), World Engineers' Convention 2011. Available online at: http://www.r‐pod.ch/wp‐content/uploads/2011/06/wec10Final00211.pdf, [Accessed 12 May 2014]. [13] Dellay, N. and Triscone, G., 2013. R‐Pod au service du "climat urbaain" avec Cean City. Geomatik Schweiz 8/2013 pp 454‐459. [14] Amazon Elastic Compute Cloud (Amazon EC2) is a web service that provides resizable compute capacity in the cloud. It is designed to make web‐scale computing easier for developers, https://aws.amazon.com/ec2/, [Accessed May 12, 2014]. [15] http://sourceforge.net/apps/mediawiki/cloudflu/index.php?title=Main_Page, [Accessed May 12, 2014]. [16] Li, W.W. and Meroney, R.N., 1983, Gas dispersion near a cubical model building. Part I Mean concentration measurements. Journal of Wind Engineering and Industrial Aerodynamics, 12, pp 15‐ 33. [17] Li, W.W. and Meroney, R.N., 1983, Gas dispersion near a cubical model building. Part II Concentration fluctuations measurements. Journal of Wind Engineering and Industrial Aerodynamics, 12, pp 35‐47. [18] Tominaga Y. and Stathopoulos, T., 2010, Numerical simulation of dispersion around an isolated cubic building : Model evaluation of RANS and LES. Building and Environment, 45, pp 2231‐2239. [19] Baniotopoulos, C., Borri, C., Stathopoulos, T., Environmental Wind Engineering and Design of Wind Energy Structures, CISM International Centre for Mechanical Sciences Vol. 531 (2011), ISBN 978‐3‐7091‐0953‐3.
Date: May2014
10