49th AIAA/ASME/SAE/ASEE Joint Propulsion Conference. July 14 - 17, 2013, San ..... Exhibit, Atlanta, Georgia, 30 July - 01 August 2012. 9Lee, B. J., Liou, M. S., ...
AIAA 2013-3601 Joint Propulsion Conferences July 14 - 17, 2013, San Jose, CA 49th AIAA/ASME/SAE/ASEE Joint Propulsion Conference
Computational Investigation of Compressible Flow in a Diffusing S-duct
Downloaded by Guy Flynt on February 25, 2014 | http://arc.aiaa.org | DOI: 10.2514/6.2013-3601
Behzad R. Ahrabi1, Kidambi Sreenivas2, Robert S. Webster3 Simcenter: National Center for Computational Engineering The University of Tennessee at Chattanooga, Chattanooga, TN 37403
This paper aims to report the computational research carried out to study the flow in a diffusing S-duct. Using Computational Fluid Dynamics (CFD), this study seeks to validate the numerical results by comparing them to experimental data reported in AIAA Propulsion Aerodynamics Workshop (PAW01). For this purpose, RANS equations were solved using an unstructured solver called Tenasi. Wilcox's Reynolds Stress Model (RSM) and Menter's Shear Stress Transport (SST) turbulence models were used in calculations to obtain steady state solutions. Computations were done for two mass flow rates and complexities of the flow field such as separation, secondary flows, and flow acceleration were well demonstrated. The accuracy and validity of the numerical results were judged by their ability to match the following experimental values: boundary layer profiles at the inlet, wall pressure distributions along the duct, wall pressure distributions at different cross sections, and pressure distribution at the Aerodynamic Interface Plane. Generally, a reasonable agreement was found.
Nomenclature ��� �� � �� ��� �� � 2 RSM � SST � �� ��� ���� y+ �
= = = = = = = = = = = = = = = =
Aerodynamic Interface Plane Diameter of the S-duct at the inlet Static pressure Total pressure (calculated using isentropic relations) Total pressure at inflow Static pressure at exit plane Mach number at AIP Wilcox’s Reynolds Stress Model Axial distance along the centerline of the S-duct, measured from inlet of the S-duct Menter's Shear Stress Transport Temperature Total temperature Total temperature at inflow Extent of recirculation region Distance normal to wall relative to viscous length scale ��� �/�� Circumferential angle
I. Introduction
D
IFFUSING S-ducts are of particular interest in the aircraft industry due to (1) their ability to reduce the drag by allowing the engine to be mounted completely within the body of the aircraft and (2) reduced radar signature. From an environmental point of view, this leads to less fuel consumption and higher energy efficiency. BlendedWing-Body1-3 (BWB) aircrafts, which are considered as the future of long-range transportation, are examples of an S-duct application.
1
Graduate Research Assistant, UT SimCenter at Chattanooga, 701 East M.L. King Boulevard, Student Member. Research Professor, UT SimCenter at Chattanooga, 701 East M.L. King Boulevard, Senior Member. 3 Associate Research Professor, UT SimCenter at Chattanooga, 701 East M.L. King Boulevard, Senior Member. 1 American Institute of Aeronautics and Astronautics 2
Copyright © 2013 by Simcenter: National Center for Computational Engineering. Published by the American Institute of Aeronautics and Astronautics, Inc., with permission.
Downloaded by Guy Flynt on February 25, 2014 | http://arc.aiaa.org | DOI: 10.2514/6.2013-3601
A well-designed diffusing S-duct needs to provide a uniform flow with maximum pressure recovery at the engine face. However, S-ducts involve serious drawbacks that limit their performance. As a consequence of centerline curvature and expansion of cross section area along the duct, flow separation is very likely to occur and usually, a pair of counter rotating vortices is observed after the first bend of the S-duct. Clearly these phenomena give rise to pressure loss and secondary flows, which, in this context, usually result in distortion at the Aerodynamic Interface Plane (AIP). Detailed description of the various flow features can be found in the studies of Harloff et al.4,5 and Wellborn et al.6,7. Due to tight coupling of the components in an aircraft engine system, it should be noted that the aerodynamic of fan, compressor, turbine, combustor, and, finally, the exhaust system depend, either directly or indirectly, on the flow characteristics at the AIP. As an example, the paper by Webster et al.8 presents a qualitative demonstration of integration of the S-duct with a turbofan stage in which distorted flow is shown to be responsible for noticeable change in flow characteristics of the turbofan. To reduce the distortion, designers try either to optimize the geometry9, or to use passive (e.g. vortex generator10-14) or active (e.g. air jet3) flow control methods. The above mentioned facts, along with aiming to reduce the costs and duration of the design process, motivate researchers to provide a prediction tool using Computational Fluid Dynamics (CFD). Despite some as yet unsolved shortcomings, application of CFD is increasing with the passage of time, thanks to enhancement in both computer resources and solver/grid generation methods. CFD, along with improvements in experimental techniques, has offered an appropriate method for design, optimization, and above all, detailed study of these flows. As a recent example, Mace et al.14 have studied dynamic pressure distortion at the AIP and also shown that CFD is capable of capturing the key features of unsteady flow structure. The essence of this paper is to report the computational research conducted for further study of compressible flow inside a diffusing S-duct, which was initially studied in the 1st AIAA Propulsion Aerodynamics Workshop (PAW01)15 held as part of the JPC 2012. The aim is a further investigation of flow characteristics, and also to provide more accurate simulation for the problem in order to obtain an improved solution at the AIP. Complexities involved in this simulation problem are realized by the fact that the numerical method needs to be capable of capturing the separation, recirculation region, and secondary flows under the effect of noticeable adverse pressure gradient. In an attempt to reduce required time, memory and computation power, turbulence models as opposed to an LES or DNS approach, are utilized. Specifically, Wilcox's Reynolds Stress Model (RSM) and Menter's Shear Stress Transport (SST) turbulence models are used in this effort. Furthermore, no unsteady simulations were attempted; all solutions presented here were obtained using steady state assumptions. The accuracy and validity of the numerical solutions are examined by comparing to following experimental data: (1) boundary layer profiles at the inlet, (2) wall pressure distributions along the S-duct and on cross stream planes, and (3) total pressure ratio at AIP. In following sections, the geometry and computational domain, the numerical method, the utilized solver, and the boundary conditions are described. Computational results for two mass flow rates are presented and compared to experimental data. Finally, the conclusion of this study is given.
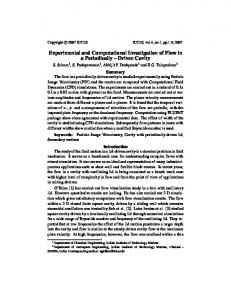
II. Description of the problem A. Geometry and Computational Domain Figure 1 shows the geometry of the S-duct and computational domain which were provided by AIAA PAW0115. Experiments referred to in this study were conducted in the ONERA wind tunnel R4MA (Modane-Avrieus, France) in 2006. Actually, the tested S-duct is a scaled up model of the S-duct used by Harloff et al.4 at the NASA Lewis Research Center in the 1990’s. The computational domain is composed of an external flow field, a bell-mouth, a constant diameter pipe, and an S-shaped duct. The external flow field is employed to provide a uniform inflow at inlet of the duct. The bell-mouth provides a more realistic inlet boundary condition since it makes it possible to study the effect of inlet boundary layer in the flow filed of the S-duct. Because of the symmetry of the S-duct, the computational domain for RANS simulation can be constructed only for half of the model. The area ratio of the S-duct (ratio between the outlet and inlet sections) is 1.52 . The offset of the S-duct resulting from centerline curvature is 1.34 D� (D� being the inlet diameter). The length of the S-duct is equal to 5.23 D� . The inlet diameter D� is 133.15 mm and the outlet diameter D� is 164 mm. A 164 mm diameter pipe connects the outlet station to the AIP. B. Flow Conditions and Experimental Data Table 1 shows the flow conditions at two different mass flow rates studied in this research. Experimental data was reported by PAW01 committee for both cases. These cases are known as M3A=0.4 and M3A=0.2 respectively. 2 American Institute of Aeronautics and Astronautics
These numbers point to the order of Mach number on the AIP. The average of measured values of this quantity is reported in the table for both cases. These values are calculated from the ratio of the average wall static pressure measured 0.5 diameter upstream from the AIP (the averaged value of the 16 wall static pressure taps located at � = 0°, 22.5°, 45°, 67.5°, 90°, 112.5°, 135°, 157.5°, 180°, 202.5°, 225°, 247.5°, 270°, 292.5°, 315° and 337.5° in the section 0.5 diameter upstream from the AIP) and the average total pressure measured in the AIP (average value of the 40 AIP steady total pressures)15.
Downloaded by Guy Flynt on February 25, 2014 | http://arc.aiaa.org | DOI: 10.2514/6.2013-3601
Experimental data reported after the workshop includes: 1. Total pressure profiles at the inlet of the S-duct S⁄D� ' (0.575 at angles ϕ ' 0, ,90, and 180, (see Figure 1-c). 2. Wall static pressure along 3 lines of 20 to 28 static pressure taps located axially at angles ϕ ' 0, , 90, , and 180, , and 3 lines of 13 static pressure taps located circumferentially within cross stream planes at S⁄D� ' 2, 3, 4 (see Figure 1-b). 3. Total Pressure distribution at AIP, S⁄D� ' 5.587 (see Figure 1-b).
(b)
(a)
(c)
Figure 1. (a) Computational domain and boundary conditions. (b) Locations of static and total pressure measurements. (c) Location of the inlet Table 1. S-duct flow measurements Test case: ��� (Stagnation Pressure) at the inlet ��� (Stagnation Temperature) at the inlet Mass flow (kg/s) Engine face results M2 (AIP Mach number)
Higher mass flow (M3A=0.4)
Lower mass flow (M3A=0.2)
88744 Pa
88731 Pa
286.2 K
286.3 K
2.427 kg/s
1.356 kg/s
0.3549
0.1819
C. Boundary Conditions Following boundary conditions are used (See Figure 1-a): 1. Total pressure and total temperature are specified at the inlet of the external flow field (red surface in the figure). 2. Static pressure is specified at the outlet of the external flow field (yellow surface). This pressure just needs to be a little lower than total pressure at the inlet to provide a favorable pressure gradient. In this study the value of 88000 Pa has been used for all cases. 3. Inviscid wall for the outer boundary of the external flow field (gray surface). Conditions 1 to 3, induce a uniform flow from inlet face toward the bell-mouth. 3 American Institute of Aeronautics and Astronautics
4. 5.
6.
No-slip slip adiabatic boundary condition at the walls (green surface). Two types of outflow tflow condition could be applied at the exit plane (Orange face). Either an outflow pressure condition, the pressure value being adjusted in an iterative manner until the computed mass flow matched the experimental one; or aan outflow mass flow condition (this his condition enables to perfectly match the experimental mass flow). In this study, the first type has been used. Symmetry condition on the vertical plane (this plane, which is perpendicular to z axis, is shown in Figure 2-b). ). It should be noticed that this boundary condition is applicable only for RANS computations. For more sophisticated turbulence computations, the symmetry assumption may not be reasonable.
Downloaded by Guy Flynt on February 25, 2014 | http://arc.aiaa.org | DOI: 10.2514/6.2013-3601
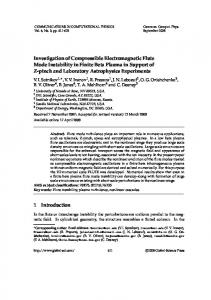
D. Grid Two girds have been used in this study study, both of which are madee of hexahedral elements. Table 2 shows the statistics of these grids, and Figure 2 shows the topology used at a cross section and also on the symmetry plane. plane As it is seen in the figure, an O-type type grid near the walls makes it poss possible ible to have a decent control on the boundary layer mesh and provide a tight packing. At the core core, H-type topology provides a uniform and smooth distribution of the nodes. It should be mentioned that the coarse mesh in this study was generated by slight modifications to a medium resolution mesh provided in the workshop. Table 2. Grid Statistics Resolution
Total elements
Total points
Elements inside S-duct
Points inside S-duct
Spacing pacing from the wall
Coarse
7,652,160
7,793,809
4,435,200
4,514,799
0.002 mm
Fine
24,260,400
24,554,198
14,255,760
14,397,975
0.002 0.00 mm
Fine
(a)
(b)
Figure 2. Topology of the grids (a) Cross section of S S-duct. duct. (b) Symmetry plane.
III. Description of the Flow Solver During this study, all simulations were carried out using Tenasi. Tenasi is a validated idated flow solver used for CFD and design research carried out by the University of Tennessee at Chattanooga (UTC). This section provides some of the key features of this solver. Tenasi is a node-centered, centered, finite volume, implicit scheme applied to general unstructured grids with nonsimplical elements. The flow variables are stored at the vertices and surface integrals are evaluated on the median dual surrounding each of these vertices. An important distinguishing feature of Tenasi is that the same executable execut can be used solve different sets of governing equations, i.e., incompressible, compressible, surface capturing, etc. by choosing a flow regime at runtime. The inviscid fluxes are evaluated using either a Roe Roe-averaged, averaged, flux-difference flux split approach orr an HLLC approach, while the viscous fluxes are evaluated using a directional derivative approach. Higher order accuracy is achieved through the use of variable extrapolation with the gradients appearing in the 4 American Institute of Aeronautics and Astronautics
reconstruction being evaluated using an unweighted least squares approach. The gradients appearing in the viscous fluxes are evaluated using a weighted least squares approach. The turbulence models available in the flow solver include the one equation Spalart-Allmaras model, the one equation Menter SAS model, the two equation k-ε model and the two equation k-ω/k-ε hybrid model (baseline and SST variants) and an assortment of Reynolds-stress and LES models. These models are loosely coupled with the mean flow. The parallel solution procedure consists of a scalable solution algorithm implemented to run efficiently on grid subdomains distributed across multiple processes and communicating through MPI. The algorithm has multiple nested kernels viz. time step, Newton iteration, LU/SGS iteration etc., and the subdomain coupling is at the innermost level, i.e., in the solution of the linear system. A block-Jacobi type updating of the subdomain boundaries ensures efficient parallelization with a small incremental cost incurred in terms of sub-iterations required to recover the convergence rate of the sequential algorithm. Further details of the main features of Tenasi may be found in Gatlin16, Whitfield17, Arabshahi18, Vanden19, Arabshahi and Whitfield20. Much of the explanation for the implementation and use of parallel, unstructured flow solvers may be found in Hyams21.
Downloaded by Guy Flynt on February 25, 2014 | http://arc.aiaa.org | DOI: 10.2514/6.2013-3601
IV. Results and Discussion As mentioned above, this study seeks to validate computational results by comparing them with experimental data. To assess the accuracy, a series of cases have been solved at two grid densities using the two turbulence models. In addition, since experimental results are available for two mass flow rates, it is possible to study the effect of mass flow rate on the flow field. A total of seven cases (Table 3) were studied using a combination of grids (coarse or fine) and turbulence models (Wilcox's Reynolds Stress Model (RSM) or Menter's Shear Stress Transport (SST)). For a specific combination of grid and turbulence model, the back pressure at the exit plane is adjusted to obtain the desired mass flow rate. Next, to make sure that the grid spacing next to the wall is fine enough, values of y+ on the walls are checked. Table 3 shows the obtained back pressure and y+ values for all cases. As can be seen from the table, the average values of y+ on the S-duct wall are less than 1. This table also shows that the back pressure values predicted by RSM solutions are lower than the SST solutions. In other words, RSM model predicts lower pressure recovery. However, difference is about 0.5 percent for higher mass flow rates and 0.1 percent for lower mass flow rates and, thus, is not very significant. In the following subsections, numerical results of the flow field are presented and in some instances, they are compared with available experimental data. Results of cases with higher mass flow rate (M3A=0.4) are presented first followed by the results of lower mass flow rate (M3A=0.2). Table 3. Studied cases
Case 1 Case 2 Case 3 Case 4 Case 5 Case 6 Case 7
Mass flow
Mesh Resolution
Turbulence model
Pressure at Outlet �0�12
Average y+ on the S-duct wall
Max y+ on the S-duct wall
M3A = 0.4 M3A = 0.4 M3A = 0.4 M3A = 0.4 M3A = 0.2 M3A = 0.2 M3A = 0.2
Coarse Fine Coarse Fine Coarse Fine Fine
RSM RSM SST SST RSM RSM SST
79400 79400 79700 79800 86150 86150 86250
0.60 0.44 0.76 0.56 0.44 0.33 0.34
1.09 0.99 1.31 1.06 1.93 0.64 0.65
A. Higher Mass Flow Rate Results (M3A = 0.4) Figure 3 compares computational and experimental total pressure ratios in the boundary layer at the S-duct inlet. Each part of the figure pertains to one of the circumferential angles ϕ ' 0°, 90°, and 180° (see Figure 1). It should be noted that these plots represent the amount of energy loss in the boundary layer and they should not be mistaken for velocity profiles. However, they are still indicative of the boundary layer thickness. For all angles, the RSM solutions exhibit greater sensitivity to grid density. Although a good agreement is seen for ϕ ' 90� (especially for wall distance < 2 mm), in all other cases computational results predict higher pressure loss in lower layers (wall distance < 2 mm) and lower pressure losses in higher layers (wall distance > 3 mm). Furthermore, in all cases, the computational boundary layers are thinner than their experimental counterparts. There is also a point of evident asymmetry in the experimental profiles. Besides, experimental data does not have a smooth variation that might be attributed to the unsteadiness in flow during the measurements. In contrast, Figure 4 shows both turbulence models predict nearly symmetric and smooth profiles at different angles, ϕ, and it should 5 American Institute of Aeronautics and Astronautics
Downloaded by Guy Flynt on February 25, 2014 | http://arc.aiaa.org | DOI: 10.2514/6.2013-3601
be emphasized again that here we seek steady-state solutions. The reason of asymmetry and noise in the measurements is not clear; however, it is very likely that it has a noticeable effect on the entire flow field.
Figure 3. Comparison of computational and experimental inlet boundary layers for M3A=0.4
Figure 4. Comparison of computational inlet boundary layers at different angles for M3A=0.4 6 American Institute of Aeronautics and Astronautics
Downloaded by Guy Flynt on February 25, 2014 | http://arc.aiaa.org | DOI: 10.2514/6.2013-3601
Figure 5 shows the computed and experimental wall static pressures along the S-duct. Generally, a reasonable agreement is seen. Despite the profiles of the boundary layer in Figures 3 and 4, here the solution of the SST model is more sensitive to grid density. All results have captured a constant pressure region at ϕ ' 180� and ϕ ' 90� which predicts the separation (Similar results can be found in studies by Harloff et al.4,5 and Wellborn et al.6,7). However, in both solutions the constant pressure region is shorter than the experimental one. Also, it is worthwhile to note that at ϕ ' 0� , a sudden drop in pressure can be seen. This is a result of the separation which leads to aerodynamic blockage of the flow area.
Figure 5. Wall static pressure along the S-duct for M3A=0.4 Figure 6 shows a comparison of the computational and experimental wall static pressure at different cross sectional positions. Computational results follow the same trend as experimental results, and, generally, a reasonable agreement is seen. Upstream of the first bend (S/D� ' 2� shows the highest differences while at the downstream location (S/D� ' 4�, a very good agreement is seen, particularly for SST model. For the computational results, the separation region was determined by streamline projection on the wall as depicted in Figure 7. Both RSM and SST models show similar solutions, and it is difficult to recognize large differences between them. However, by noting to bottom views in this figure, one can see the separation region is longer in the SST solution. Also, by comparing the side views of this figure, streamlines are more deflected by the vortex in the SST solution. Thus, the SST model has predicted a stronger vortex, and the result of that can be seen in the secondary flows at the AIP (Figure 10).
7 American Institute of Aeronautics and Astronautics
Downloaded by Guy Flynt on February 25, 2014 | http://arc.aiaa.org | DOI: 10.2514/6.2013-3601
Figure 6. Wall static pressure at cross stream sections for M3A=0.4 Figure 8 and Figure 9 show contours of total pressure ratio and Mach number on the symmetry plane, respectively. These figures compare the solution of two turbulence models. Again, both turbulence models show similar solutions, and the separation and its downstream consequences are marked by pressure loss in the low speed regions. These two figures and static pressure contours shown in side views of Figure 7 reveal the pressure-velocity interactions along the S-duct. It is well known that in a diffusing S-duct, flow decelerates as a result of increasing cross section area between the inlet and outlet. This deceleration is coincident with static pressure increase as kinetic energy converts to potential energy. However, in the separation region the cross section is blocked and a high velocity region is formed on the top of the vortex which leads to local flow acceleration and local pressure drop. Figure 9 also shows that the Mach number at the lower half of the outlet is much lower. This point is also recognized in Figure 10 which shows contours of Mach number and secondary flow streamlines on AIP. In this figure, both turbulence models show insignificant sensitivity to grid density, and both solutions result in the same average Mach number. However, the SST model predicts a slightly larger secondary flow region. Figure 11 shows the experimental and computational contours of total pressure ratio at the AIP. It should be mentioned that the experimental picture has a hole, because the pressure probes have not reached the center of the AIP. In this figure, every color other than white indicates energy loss and the deviation from ideal condition (uniform flow). The average values of the total pressure ratio indicate that the RSM predicts a slightly higher pressure loss compared to the SST model.
8 American Institute of Aeronautics and Astronautics
Flow direction
SST
Downloaded by Guy Flynt on February 25, 2014 | http://arc.aiaa.org | DOI: 10.2514/6.2013-3601
259 3 ���� 3 501
252 3 ���� 3 487 RSM
Figure 7. Visualization of separation region on the wall for M3A=0.4, both turbulence models, coarse grid. Views are from sides (upper and lower pictures) and from bottom (middle pictures). Contours show the static pressure.
RSM
SST
Figure 8. Total Pressure ratio on symmetry plane for M3A=0.4, both turbulence models, coarse grid
RSM
SST
Figure 9. Mach number on symmetry plane for M3A=0.4, both turbulence models, coarse grid 9 American Institute of Aeronautics and Astronautics
Downloaded by Guy Flynt on February 25, 2014 | http://arc.aiaa.org | DOI: 10.2514/6.2013-3601
Figure 10. Mach number contours and secondary flow streamlines at the AIP for M3A=0.4 (averages are area averages)
Figure 11. Comparison of total pressure ratio at the AIP for M3A=0.4 (averages are area averages) B. Lower Mass Flow Rate Results (M3A = 0.2) The results for the lower mass flow rate case are presented in this section. The layout of the figures for the lower mass flow rate case is identical to that used for the higher mass flow rate case. In addition to comparison of numerical and experimental results, in some instances, corresponding figures are compared to study the effect of mass flow rates on the flow field. As it was shown in previous subsection, grid density did not have a significant effect on the solution. Therefore for the rest of the study, SST turbulence model has been used only on the fine grid. Figure 12 compares computational and experimental total pressure ratios in the boundary layer at the inlet of the S-duct. A very good agreement is seen for ϕ ' 90 . Nevertheless, like the case of M3A=0.4, computational results predict symmetric profiles (Figure 13) while experimental results show evident difference among profiles of different ϕ's. Besides, comparison of Figure 13 and Figure 4 shows that energy loss in the boundary layer is considerably higher for higher mass flow rate, while the thickness of the boundary layer is nearly the same for both mass flow rates. It is worthwhile to note that the actual thickness of boundary layer is a key parameter to determine the thickness of boundary layer mesh. Figure 14 compares computational and experimental wall static pressures along the S-duct. Again, the constant pressure region points to the separation region, and a comparison with Figure 5 shows that the separation region is shorter for lower mass flow rate. However, this time, computational regions are considerably shorter than experimental ones. This result may imply that RANS computations are inadequate for capturing the separation for lower speed flows in geometries with significant streamline curvatures and high adverse pressure gradients. Figure 15 compares the visualization of the separation region on the wall for two mass flow rates. From bottom views both solutions show the same extent while from side views the separation region is clearly smaller for lower mass flow rate. Figure 16 and Figure 17 show contours of total pressure ratio and Mach number on the symmetry plane, respectively. These figures compare the solution of different mass flow rates using RSM turbulence model. To make 10 American Institute of Aeronautics and Astronautics
°
Downloaded by Guy Flynt on February 25, 2014 | http://arc.aiaa.org | DOI: 10.2514/6.2013-3601
the variations more distinctive, different contour levels have been used for different mass flow rates. Based on Figure 16, loss effects are significantly lower for the lower mass flow rate, as it is expected. Based on Figure 17, qualitative variations of Mach number on the symmetry plane for two mass flow rates are very similar and if the contour legends are ignored, it would be hard to make difference between two solutions. Figure 18 shows a comparison of the computational and experimental wall static pressure at different cross sectional positions. Like Figure 6, upstream of first bend (S/D� ' 2� shows the highest differences (still less than 1 percent) while at the downstream location (S/D� ' 4�, the best agreement is seen. Figure 19 shows contours of Mach number and secondary flow streamlines at the AIP. Like Figure 10, the SST model has predicted a slightly larger secondary flow region. Figure 20 shows the experimental and computational contours of total pressure ratio at the AIP. All the average values are very close too each other.
Figure 12. Comparison of computational and experimental inlet boundary layers for M3A=0.2
11 American Institute of Aeronautics and Astronautics
Downloaded by Guy Flynt on February 25, 2014 | http://arc.aiaa.org | DOI: 10.2514/6.2013-3601
Figure 13. Comparison of computational inlet boundary layers at different angles for M3A=0.2
Figure 14. Wall static pressure along the S-duct for M3A=0.2 12 American Institute of Aeronautics and Astronautics
Downloaded by Guy Flynt on February 25, 2014 | http://arc.aiaa.org | DOI: 10.2514/6.2013-3601
Figure 15. Visualization of separation region on the wall for M3A=0.4 and M3A=0.2, RSM turbulence model, coarse grid. Views are from sides (upper and lower pictur pictures) es) and from bottom (middle pictures). Contours show the static pressure.
M3A=0.2 M3A = 0.4
Figure 16. Total otal Pressure ratio on symmetry plane for M3A=0.4 and M3A=0.2,, coarse grid
M3A = 0.4
M3A=0.2
Figure 17. Mach ach number on symmetry plane for M3A=0.4 and M3A=0.2, RSM turbulence model, coarse grid 13 American Institute of Aeronautics and Astronautics
Downloaded by Guy Flynt on February 25, 2014 | http://arc.aiaa.org | DOI: 10.2514/6.2013-3601
Figure 18. Wall static pressure at cross stream sections for M3A=0.2
Figure 19. Mach number contours and secondary flow streamlines at the AIP for M3A=0.2 (averages are area averages) 14 American Institute of Aeronautics and Astronautics
Downloaded by Guy Flynt on February 25, 2014 | http://arc.aiaa.org | DOI: 10.2514/6.2013-3601
Figure 20. Comparison of total pressure ratio at the AIP for M3A=0.2 (averages are area averages)
V. Conclusion and Future Work Computational simulations were carried out using Tenasi for two different flow conditions for an S-Duct. The computed results were compared to experimental data and the overall agreement was good. The trends in the experimental data were captured well by both of the turbulence models considered in this study. Grid refinement did not indicate significant sensitivity of either turbulence model used in this study. The big area of disagreement between the computed and experimental data was at the inlet to the S-Duct with the experimental data indicating a strong asymmetry while the computational results were symmetric (as expected). The impact of this asymmetry on the downstream evolution of the flow could not be ascertained as only the pressure loss was available (experimentally) at the inlet. As a part of possible future work, the complete configuration could also be considered to evaluate the effect of the symmetry condition on the vertical plane and the effect of non-symmetric inflow conditions. This is motivated by the fact that experimental data show significant non-symmetric inflow conditions at the inlet of the duct.
Acknowledgments The authors acknowledge the support provided by the PAW-01 organizing committee that enabled them to attend the workshop. Computer resources were provided by the SimCenter at the University of Tennessee at Chattanooga.
References 1
Owens, L. R., Allan, B. G., and Gorton, S. A., “Boundary-Layer-Ingesting Inlet Flow Control,”AIAA-2006-839, January, 2006. 2 Owens, L. R., Allan, B. G., and Gorton, S. A., “Boundary-Layer-Ingesting Inlet Flow Control,” Journal of Aircraft, Vol.45, No. 4, pp. 1431-1440, July-August, 2008. 3 Johnson, B.J., Webster, R.S., and Sreenivas, K., “A Numerical Investigation of S-Duct Flows with Boundary-Layer Ingestion,” AIAA-2010-0841, 48th AIAA Aerospace Sciences Meeting, Orlando, Florida, 4-7 January, 2010. 4 Harloff, G.J., Reichert B.A., Wellborn S.R., “Navier-Stokes Analysis and Experimental Data Comparison of Compressible Flow in a Diffusing S-Duct”, AIAA-92-2699-CP, 1992. 5 Harloff, G.J., Reichert B.A., Sibaugh, J.R., Wellborn S.R., “Navier-Stokes Analysis and Experimental Data Comparison of Compressible Flow Within Ducts” , NASA-TM-105796. 6 Wellborn S.R., OKiishi T.H., Reichert R.A., “A Study of the Compressible Flow Through a Diffusing S-Duct”, NASA-TM106411. 7 Wellborn S.R., Reichert R.A., OKiishi T.H., teven R., "Study of the compressible flow in a diffusing S-duct", Journal of Propulsion and Power, Vol. 10, No. 5 (1994), pp. 668-675. 8 Webster R.S., Sreenivas K., Hyams D.G., Hilbert C.B., Briley W.R., Whitfield D.L., “Demonstration of Sub-system Level Simulations: A Coupled Inlet and Turbofan Stage,” AIAA 2012-4282, 48th AIAA/ASME/SAE/ASEE Joint Propulsion Conference & Exhibit, Atlanta, Georgia, 30 July - 01 August 2012. 9 Lee, B. J., Liou, M. S., and Kim, C., “Optimizing a Boundary-Layer-Ingestion Offset Inlet by Discrete Adjoint Approach,” AIAA Journal, Vol. 48, No. 9, September 2010, pp. 2008-2016.
15 American Institute of Aeronautics and Astronautics
Downloaded by Guy Flynt on February 25, 2014 | http://arc.aiaa.org | DOI: 10.2514/6.2013-3601
10 Anderson, B.H., Huang, P.S., Paschal, W.A., and Cavatorta, E., “A Study on Vortex Flow Control of Inlet Distortion in the Re-engined 727-100 Center Inlet Duct Using Computational Fluid Dynamics,” AIAA-92-0152, 1992. 11 Anderson, B.H., and Gibb, J., “Study on Vortex Generator Flow Control for the Management of Inlet Distortion,” Journal of Propulsion and Power, vol. 9, no. 3, May-June 1993, pp. 422-430. 12 Anderson, B.H., and Gibbs, J., “Vortex Generation Installation Studies on Steady State and Dynamic Distortion,” AIAA96-3279, 1996. 13 Yi, J., Lee, B.J., Kim, Ch., “Efficient Design Optimization of Vortex Generators in Subsonic Offset Inlet by Discrete Adjoint Approach,” AIAA 2011-3535, 20th AIAA Computational Fluid Dynamics Conference, Honolulu, Hawaii, 27 - 30 June 2011. 14 Mace, J., Lakebrink, M., Mani, M., “Computational Simulation of Dynamic Total-Pressure Distortion in an S-Diffuser,” AIAA 2012-3999, 48th AIAA/ASME/SAE/ASEE Joint Propulsion Conference & Exhibit, Atlanta, Georgia, 30 July - 01 August 2012. 15 1st AIAA Propulsion Aerodynamics Workshop (PAW01), S-duct documents, http://aiaapaw.tecplot.com 16 Gatlin, B., “An Implicit, Upwind Method for Obtaining Symbiotic Solutions to the Thin-Layer Navier-Stokes Equations,” Ph.D. Dissertation, Department of Aerospace Engineering, Mississippi State University, 1987. 17 Whitfield, D. L., Janus, J. M., and Simpson, L. B., “Implicit Finite Volume High Resolution Wave-Split Scheme for Solving the Unsteady Three-Dimensional Euler and Navier-Stokes Equations on Stationary or Dynamic Grids,”Mississippi State University Engineering and Industrial Research Station Report,MSSU-EIRS-ASE-88-2, 1988. 18 Arabshahi, A., “A Dynamic Multiblock Approach to Solving the Unsteady Euler Equations About Complex Configurations,” Ph.D. Dissertation, Department of Aerospace Engineering,Mississippi State University, 1989. 19 Vanden, K. J., “Direct and Iterative Algorithms for Three-Dimensional Euler Equations,” Ph.D. Dissertation, Department of Aerospace Engineering, Mississippi State University, 1992. 20 Arabshahi, A., and Whitfield, D. L., “Multiblock Euler Computation of Transonic Flow About A Generic Aircraft Configuration,” International Journal of Computational Fluid Dynamics, Vol.4, pp. 307-321, 1995. 21 Hyams, D. G., “An Investigation of Parallel Implicit Solution Algorithms for Incompressible Flows on Unstructured Topologies”, Ph.D. Dissertation, Mississippi State University, May, 2000.
16 American Institute of Aeronautics and Astronautics