[5]S.Sarada, M.Shiva Shankar and Rudresh.G â Numerical simulation of Viscous, Incompressible flow around NACA 64618 subsonic airfoil using. Computational ...
ISSN(Online) : 2319 - 8753 ISSN (Print) : 2347 - 6710
International Journal of Innovative Research in Science, Engineering and Technology (An ISO 3297: 2007 Certified Organization)
Vol. 4, Issue 2, February 2015
Computational Investigation of Flow Separation in Incompressible Aerodynamic Regime B.S. Anil Kumar1, Dr. Ramalingaiah2, Dr. S. Manjunath3, Rudresh Ganganna4 Research Scholar, Department of Mechanical Engineering, PESCE, Mandya, India 1 Professor, Department of Mechanical Engineering, PESCE, Mandya, India 2 Professor, Department of Mathematics, BNMIT, Bangalore, India 3 Founder Director, Niharika Institute of Computational Engineering (NICECFD), Bangalore, India 4 ABSTRACT: Numerical simulation of flow past airfoils in the stalled region is a challenging problem due to various complex phenomena like strong vortex dynamics, boundary layer separation due to adverse pressure gradient etc. For accurate numerical prediction of separated flow, correct modeling of boundary layer is essential to capture the flow details. In the present work 2D Computational Fluid Dynamics (CFD) analysis for flow around NACA 23024 subsonic airfoil at Reynolds number of 3 million is carried out for a range of angle of attack (0 to +20 degrees) covering both the linear slope and stalling region using ANSYS FLUENT CFD software package. CFD analysis results are compared with the wind tunnel test results. The performance of Spalart-allamaras one equation turbulence model, K-epsilon turbulence model with standard wall functions is analyzed. Lift and drag coefficients measured in wind tunnel are compared with the CFD analysis results. Deviation between wind tunnel test results and CFD analysis results in the stalled region is analyzed and accurate methodology for capturing the aerodynamic flow phenomena is established. KEYWORDS: CFD, Ansys Fluent, Aerodynamics, Turbulence Models I. INTRODUCTION NACA 23024 normal airfoil coordinates are used for geometry creation in ANSYS ICEMCFD mesh generation software.2D Structured grid is generated with fine mesh resolution around the airfoil to capture the boundary layer effects. The mesh is finalized with grid independence studies. CFD simulations are carried out for free stream Reynolds number of 3 million and angle of attack is varied from 0 to + 20 degrees. II. LITERATURE SURVEY David Hartwanger et al. [1] conducted CFD analysis for NREL S809 airfoil section of the wind turbine blade using the 2d panel code X-Foil and ANSYS CFX 2D code. The work concluded that using a high-resolution structured mesh; with advanced turbulence and transition models provide an excellent match with experimental data in the attached flow regime. However, the CFD and XFOIL panel code over-predict peak lift and tend to underestimate stalled flow. Franck bertagnolio et al [2] discusses the experimental and 2D CFD simulation results for the NACA six digit wing section families. The work concluded that results obtained with Ellipsys 2D research code provides a good match with experimental data both in the attached and stalled flow regimes. Ellipsys 2D CFD code uses the Mentors shear stress transition turbulence model with flow transition capabilities to predict the turbulence effects accurately as well as the flow transition from laminar to turbulent regime. H. Gao et al. [3] conducted experimental and CFD simulations for corrugated dragonfly airfoil at low Reynolds number (Re=55000 to 68000).2D and 3D CFD simulations are conducted using MUSIC Navier-Stokes solver. The work concluded that 2D and 3D CFD results differ significantly at relatively high angle of attacks and 3D CFD results agree Copyright to IJIRSET
DOI: 10.15680/IJIRSET.2015.0402035
470
ISSN(Online) : 2319 - 8753 ISSN (Print) : 2347 - 6710
International Journal of Innovative Research in Science, Engineering and Technology (An ISO 3297: 2007 Certified Organization)
Vol. 4, Issue 2, February 2015
much better with the experimental data. It is concluded that vortex dominated flow at higher angle of attacks is strongly three-dimensional. Vance Dippold [4] investigated different near wall flow modeling methods available in WIND CFD code and concluded that both two-equation turbulence models were found to work well in the presence of a neutral or favorable pressure gradient; however the Mentors Shear Stress Transport model clearly performed better when an adverse pressure gradient was present. S. Sarada et al [5] conducted 2D and 3D CFD analysis for NACA 64618 subsonic airfoil using FLUENT code and concluded that 2D simulations using K-epsilon model does not yield sensible results in stalling region and 3D CFD simulations are predicting sensible results in stalling region. Literatures cited in this field indicates that the Turbulence models employed in most of the commercial CFD softwares treat the boundary layer around the airfoil as fully turbulent and hence the lift forces are over predicted [1] and modeling of flow transition from laminar to turbulent provides accurate analysis results [2]. Some of the literatures [3] and [5] have concluded that three dimensional CFD analysis results will give good prediction of stalled aerodynamics as the turbulence is purely a three dimensional phenomena. Literatures [2] and [4] have expressed that Mentors Shear Stress Transport turbulence model is giving acceptable results in the post stall region. Literature [2] explains the capabilities of ELLIPSYS 2D CFD solver, which employs Mentors Shear Stress Transport Turbulence model with flow transition capabilities. It is concluded that Transition Turbulence model is giving close predictions in the attached as well as separated (post stall) flow region. It is concluded that the flow transition (boundary layer transition) from laminar to turbulent around the surface of the airfoil needs to be properly implemented in CFD analysis in order to have a reliable prediction in post stall region. III. MATHEMATICAL MODELING OF THE FLOW The 2 dimensional flow around NACA 23024 airfoil is modeled as Incompressible, viscous, steady state and turbulent. The governing Navier-Stokes equations are given below,
G1 G2 G1,V G2,V x y x y
Where G1, G2 are the Inviscid flux vectors, given by
u1 u2 u u 2 p u1 2 1 G1 G u1u2 2 p u22 u2u3 u1u3 G1,V , G2,V are the viscous flux vectors, given by
G1,V
0 0 yx xx G2,V xy yy yz xz
In the above equations, ρ is the density of the fluid, u1,u2 and u3 are the velocities and P is the pressure.
xx , yy
are the normal stresses, given by,
Copyright to IJIRSET
DOI: 10.15680/IJIRSET.2015.0402035
471
ISSN(Online) : 2319 - 8753 ISSN (Print) : 2347 - 6710
International Journal of Innovative Research in Science, Engineering and Technology (An ISO 3297: 2007 Certified Organization)
Vol. 4, Issue 2, February 2015
xx 2
u1 x
yy 2
u2 y
The shear stress are given by
u
u
xy yx 1 2 y x Where μ is the coefficient of viscosity and μbulk is the bulk viscosity coefficient defined by,
2
bulk 3 The turbulence closure is taken care by k-epsilon model. The transport equations for turbulent kinetic energy k and dissipation rate ε are written in tensor form as,
k U i k eff Pk xi xi k xi U i eff c 1 P c 2 xi xi xi k The turbulence generation term Pk can be expressed in tensor notation as,
pk t
U i xi
U i U j xi x j
The turbulent viscosity is given by,
t c
k
The effective viscosity is given by,
eff t
The near wall treatment to capture the viscous effects is taken care by standard wall functions. Transport equations of Spalart allmaras model is given below,
Where Gv is the production of turbulent viscosity and Yv is the destruction of turbulent viscosity that occurs in the nearwall region due to wall blocking and viscous damping.
Copyright to IJIRSET
DOI: 10.15680/IJIRSET.2015.0402035
472
ISSN(Online) : 2319 - 8753 ISSN (Print) : 2347 - 6710
International Journal of Innovative Research in Science, Engineering and Technology (An ISO 3297: 2007 Certified Organization)
Vol. 4, Issue 2, February 2015
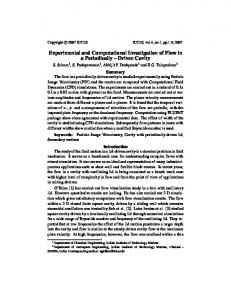
IV. COMPUTATIONAL GRID GENERATION Fig 1 shows the computational domain considered in this study and Fig 2 shows the computational grid generated around NACA 23024 airfoil. Fig 3.shows the fine mesh near the airfoil for boundary layer resolution. The mesh consists of 135000 quadrilateral elements with appropriate quality index.
Fig 1. Computational domain considered for the study
Fig 2. Computational mesh generated for the analysis
Copyright to IJIRSET
DOI: 10.15680/IJIRSET.2015.0402035
473
ISSN(Online) : 2319 - 8753 ISSN (Print) : 2347 - 6710
International Journal of Innovative Research in Science, Engineering and Technology (An ISO 3297: 2007 Certified Organization)
Vol. 4, Issue 2, February 2015
Fig 3. Mesh resolution in the boundary layer region
V. GRID INDEPENDENCE STUDIES Grid size is varied from 6000 to 12230 elements for 2D CFD analysis .2Dmesh with element count of 12230 is found suitable from accuracy point of view. VI. RESULTS AND DISCUSSIONS
Fig 4.Lift coefficient plot
Fig 5.Drag coefficient plot
Copyright to IJIRSET
DOI: 10.15680/IJIRSET.2015.0402035
474
ISSN(Online) : 2319 - 8753 ISSN (Print) : 2347 - 6710
International Journal of Innovative Research in Science, Engineering and Technology (An ISO 3297: 2007 Certified Organization)
Vol. 4, Issue 2, February 2015
Fig 6.Velocity vectors in stalling region (angle of attack 16 degrees), Spalart allmaras model
Fig 7.Velocity vectors in stalling region (angle of attack 16 degrees), K-epsilon turbulence model with standard wall functions
Fig 4 shows the lift coefficient plotted with angle of attack and Fig 5 shows the drag coefficient plotted with angle of attack. It is observed that in the linear slope region (pre stall region) CFD analysis results obtained by both Spalart allmaras model and K-epsilon turbulence model with standard wall functions will provide accurate results when compared with wind tunnel measured results. Deviation in CFD analysis results compared with wind tunnel measured values is observed in the post stall region. Spalart allmaras model is predicting close to the experimental results when compared with K-epsilon model with standard wall function approach. Fig 6 and 7 shows the velocity vectors around the airfoil in the stalled region (angle of attack 16 degrees) for Spalart allmaras model and K-epsilon model with standard wall functions respectively. It is observed that K-epsilon model with standard wall function under predicts the stalling effects and hence there is a mis match in CFD analysis results in the stalled region. In contrast to this Spalart allmaras turbulence model captures the vortex region more accurately and hence CFD analysis results are close to experimental measurements in the stalled region. Copyright to IJIRSET
DOI: 10.15680/IJIRSET.2015.0402035
475
ISSN(Online) : 2319 - 8753 ISSN (Print) : 2347 - 6710
International Journal of Innovative Research in Science, Engineering and Technology (An ISO 3297: 2007 Certified Organization)
Vol. 4, Issue 2, February 2015
K-epsilon model with standard wall functions approximates the viscous sub layer and buffer zone of the turbulent boundary layer with wall functions and this approximation is the cause for deviation of results in the post stall region. The Spalart allmaras model captures the boundary layer with a fine mesh without any approximations like wall functions and hence the CFD analysis results are close to experimental measurements in the post stall region. VII. CONCLUSIONS Comparative study of CFD analysis results with wind tunnel results have shown that in the pre stall region both kepsilon turbulence model with standard wall functions and Spalart allmaras turbulence model provide almost same results. Hence there are no numerical challenges. However in the post stall region CFD analysis results obtained with each turbulence model and near wall modeling approach is unique keeping in view the closeness of results with reference to wind tunnel test results, numerical stability and convergence issues. The analysis have shown that CFD analysis results obtained by Spalart allmaras Turbulence model are close to the experimental measurements when compared with K-epsilon turbulence model with standard wall functions. K-epsilon model approximates the boundary layer with empirical velocity profiles, which leads to false analysis results, in the post stall region where flow separation is present. In contrast to this Spalart allmaras turbulence model needs very fine mesh in the boundary layer region and captures the velocity profile in the boundary layer region on a fine resolved mesh accurately. VIII. ACKNOWLEDGEMENTS Authors would like to express sincere gratitude to “Niharika Institute of Computational Engineering (NICECFD), Bangalore. (www.nicecfd.com) for all the technical guidance and licensed version of ANSYS ICEMCFD meshing software and ANSYS FLUENT CFD analysis software. REFERENCES [1]David Hartwanger et.al “3 D modeling of a Wind Turbine using CFD” NAFEMS Conference, United Kingdom, 2008. [2]Frank Bertagnolio et.al “Wind Turbine airfoil catalogue” RISOE National Laboratories, Denmark, 2001. [3]H.Gao et.al “Computational study of unsteady flows around dragonfly and smooth airfoils at low Reynolds number” 46 th AIAA Aerospace sciences meeting and exhibit,Reno,Navada,2008. [4]Vance Dippold, III, “Investigation of Wall Function and Turbulence Model Performance within the Wind Code”, 43rd AIAA Aerospace Sciences Meeting and Exhibit, 10 - 13 January 2005, Reno, Nevada [5]S.Sarada, M.Shiva Shankar and Rudresh.G “ Numerical simulation of Viscous, Incompressible flow around NACA 64618 subsonic airfoil using Computational Fluid Dynamics”, Proceedings of National conference on advances in Mechanical Engineering, Allied Publishers Pvt Ltd, 2012 [6]Menter, F. R., “Two-Equation Eddy-Viscosity Turbulence Models for Engineering Applications” AIAA Journal, Vol. 32, No. 8, August 1994, pp. 1598-1605 (http://turbmodels.larc.nasa.gov/sst.html). [7]Abbott.I.H, “Theory of wing section, including a summary of airfoil data”, Dover book on Physics, 1995.
Copyright to IJIRSET
DOI: 10.15680/IJIRSET.2015.0402035
476