review
Computational methods for transcriptome annotation and quantification using RNA-seq
© 2011 Nature America, Inc. All rights reserved.
Manuel Garber1, Manfred G Grabherr1, Mitchell Guttman1,2 & Cole Trapnell1,3
High-throughput RNA sequencing (RNA-seq) promises a comprehensive picture of the transcriptome, allowing for the complete annotation and quantification of all genes and their isoforms across samples. Realizing this promise requires increasingly complex computational methods. These computational challenges fall into three main categories: (i) read mapping, (ii) transcriptome reconstruction and (iii) expression quantification. Here we explain the major conceptual and practical challenges, and the general classes of solutions for each category. Finally, we highlight the interdependence between these categories and discuss the benefits for different biological applications. Defining a precise map of all genes along with their alternative isoforms and expression across diverse cell types is critical for understanding biology. Until recently, production of such data was prohibitively expensive and experimentally laborious. The major method for annotating a transcriptome required the slow and costly process of cloning cDNAs or expressed sequence tag (EST) libraries, followed by capillary sequencing1–3. Owing to the high cost and limited data yield intrinsic to this approach, it only provided a glimpse of the true complexity of cell type–specific splicing and transcription4,5. Analysis of these data required sophisticated computational tools, many of which6–9 provide the basis for the programs used today for high-throughput RNA sequencing (RNA-seq) data. Alternative strategies, such as genome-wide tiling arrays, allowed for the identification of transcribed regions at a larger and more cost-efficient scale but with limited resolution3,10. Splicing arrays with probes across exonexon junctions enabled researchers to analyze predefined splicing events11,12 but could not be used to identify previously uncharacterized events. Expression quantification required hybridization of RNA to gene-expression microarrays, a process that is limited to studying the expression of known genes for defined isoforms13,14. Recent advances in DNA sequencing technology have made it possible to sequence cDNA derived from cellular RNA by massively parallel sequencing technologies, a process termed RNA-seq5,15–23. We use the term RNA-seq to refer to experimental procedures that generate DNA
sequence reads derived from the entire RNA molecule. Specific applications such as small RNA sequence analysis require special approaches, which we do not address here. In theory, RNA-seq can be used to build a complete map of the transcriptome across all cell types, perturbations and states. To fully realize this goal, however, RNAseq requires powerful computational tools. Many recent studies have applied RNA-seq to specific biological problems, including the quantification of alternative splicing in tissues5, populations5,24 and disease25, discovery of new fusion genes in cancer18,26, improvement of genome assembly27, and transcript identification16,23,28,29. Here we focus on the computational methods needed to address RNA-seq analysis core challenges. First, we describe methods to align reads directly to a reference transcriptome or genome (‘read mapping’). Second, we discuss methods to identify expressed genes and isoforms (‘transcriptome reconstruction’). Third, we present methods for estimation of gene and isoform abundance, as well as methods for the analysis of differential expression across samples (‘expression quantification’). Because of ongoing improvements in RNA-seq data generation, there is great variability in the maturity of available computational tools. In some areas, such as read mapping, a wealth of algorithms exists but in others, such as differential expression analysis, solutions are only beginning to emerge. Rather than comprehensively describing each method, we highlight the key common principles as well as the critical differences underlying
1Broad Institute of Massachusetts Institute of Technology and Harvard, Cambridge, Massachusetts, USA. 2Department of Biology, Massachusetts Institute of Technology, Cambridge, Massachusetts, USA. 3Department of Stem Cell and Regenerative Biology, Harvard University, Cambridge, Massachusetts, USA. Correspondence should be addressed to M.G. (
[email protected]).
PUBLISHED ONLINE 27 MAY 2011; DOI:10.1038/NMETH.1613
nature methods | VOL.8 NO.6 | JUNE 2011 | 469
review Table 1 | Selected list of RNA-seq analysis programs Class
Category
Package
Notes
Uses
Input
Seed methods
Short-read mapping package Smith-Waterman extension (SHRiMP)41
Aligning reads to a reference transcriptome
Reads and reference transcriptome
Burrows-Wheeler transform methods
Bowtie43 BWA44
Incorporates quality scores
Exon-first methods
MapSplice52 SpliceMap50
Works with multiple unspliced aligners
Aligning reads to a reference genome. Allows for the identification of novel splice junctions
Reads and reference genome
TopHat51
Uses Bowtie alignments
GSNAP53
Can use SNP databases
QPALMA54
Smith-Waterman for large gaps
Exon identification
G.Mor.Se
Assembles exons
Genome-guided assembly
Scripture28
Reports all isoforms
Cufflinks29
Reports a minimal set of isoforms
Velvet61
Reports all isoforms
Identifying novel genes and Reads transcript isoforms without a known reference genome
Quantifies using differentially included exons
Quantifying gene expression Reads and transcript models
Read mapping Unspliced alignersa
Stampy39
Spliced aligners
Seed-extend methods
Probabilistic model
Transcriptome reconstruction
© 2011 Nature America, Inc. All rights reserved.
Genome-guided reconstruction Genomeindependent reconstruction
Genome-independent assembly
TransABySS56
Identifying novel transcripts Alignments to using a known reference reference genome genome
Expression quantification Expression quantification
Gene quantification
Alexa-seq47
Enhanced read analysis of Quantifies using union of exons gene expression (ERANGE)20
Isoform quantification
Normalization by expected uniquely mappable area (NEUMA)82
Quantifies using unique reads
Cufflinks29
Maximum likelihood estimation of Quantifying transcript relative isoform expression isoform expression levels
Read alignments to isoforms
Cuffdiff29
Uses isoform levels in analysis
DegSeq79
Uses a normal distribution
Read alignments and transcript models
MISO33 RNA-seq by expectaion maximization (RSEM)69 Differential expression
EdgeR77
Identifying differentially expressed genes or transcript isoforms
Differential Expression analysis of count data (DESeq)78 Myrna75
Cloud-based permutation method
aThis
list is not meant to be exhaustive as many different programs are available for short-read alignment. Here we chose a representative set capturing the frequently used tools for RNA-seq or tools representing fundamentally different approaches.
each approach and their application to RNA-seq analysis. We also discuss how these different methodologies can impact the results and interpretation of the data. Although we discuss each of the three categories as separate units, RNA-seq data analysis often requires using methods from all three categories. The methods described here are largely independent of the choice of library construction protocols, with the notable exception of ‘paired-end’ sequencing (reading from both ends of a fragment), which provides valuable information at all stages of RNA-seq analysis28–30. As a reference for the reader, we provide a list of currently available methods in each category (Table 1). To provide a general indication of the compute resources and tradeoffs of different methods, we selected a representative method from each category and applied it to a published RNA-seq dataset consisting of 58 million paired-end 76-base reads from mouse embryonic stem cell RNA28 (Supplementary Table 1). 470 | VOL.8 NO.6 | JUNE 2011 | nature methods
Mapping short RNA-seq reads One of the most basic tasks in RNA-seq analysis is the alignment of reads to either a reference transcriptome or genome. Alignment of reads is a classic problem in bioinformatics with several solutions specifically for EST mapping8,9. RNA-seq reads, however, pose particular challenges because they are short (~36–125 bases), error rates are considerable and many reads span exon-exon junctions. Additionally, the number of reads per experiment is increasingly large, currently as many as hundreds of millions. There are two major algorithmic approaches to map RNA-seq reads to a reference transcriptome. The first, to which we collectively refer as ‘unspliced read aligners’, align reads to a reference without allowing any large gaps. The unspliced read aligners fall into two main categories, ‘seed methods’ and ‘Burrows-Wheeler transform methods’. Seed methods31–38 such as mapping and assembly with quality (MAQ)33 and Stampy35 find matches for short subsequences, termed ‘seeds’, assuming that at least
review a Exon-first approach Exon 1
Exon 2
b Seed-extend approach RNA
Exon 1
Exon read mapping
Exon 2
RNA
Seed matching k-mer seeds
Spliced read mapping
Seed extend
© 2011 Nature America, Inc. All rights reserved.
c Potential limitations of exon-first approaches
Gene
Pseudogene
one seed in a read will perfectly match the reference. Each seed is used to narrow candidate regions where more sensitive methods (such as Smith-Waterman) can be applied to extend seeds to full alignments. In contrast, the second approach includes Burrows-Wheeler transform methods39–41 such as Burrows-Wheeler alignment (BWA)40 and Bowtie39, which compact the genome into a data structure that is very efficient when searching for perfect matches42,43. When allowing mismatches, the performance of Burrows-Wheeler transform methods decreases exponentially with the number of mismatches as they iteratively perform perfect searches39–41. Unspliced read aligners are ideal for mapping reads against a reference cDNA databases for quantification purposes5,20,26,44,45. If the exact reference transcriptome is available, Burrows-Wheeler methods are faster than seed-based methods (in our example, ~15× faster requiring ~110 central processing unit (CPU) hours) and have small differences in alignment specificity (~10% lower) Supplementary Table 1). In contrast, when only the reference transcriptome of a distant species is available, ‘seed methods’ can result in a large increase in sensitivity. For example, using the rat transcriptome as a reference for mouse reads resulted in 40% more reads aligned at a cost of ~7× more compute time, yielding a comparable alignment success rate as when aligning to the actual reference mouse transcriptome (Supplementary Table 1 and Supplementary Figs. 1 and 2). Similarly, an increase in sensitivity using seed methods has been observed when aligning reads to polymorphic regions in a species for quantification of allele-specific gene expression46. Unspliced read aligners are limited to identifying known exons and junctions, and do not allow for the identification of splicing events involving new exons. Alternatively, reads can be aligned to the entire genome, including intron-spanning reads that require large gaps for proper placement. Several methods exist, collectively referred to as ‘spliced aligners’, that fall into two main categories: ‘exon first’ and ‘seed and extend’. Exon-first47–49 methods such as MapSplice49, SpliceMap47 and TopHat48 use a two-step process. First, they map reads continuously to the genome using the unspliced read aligners (Fig. 1a).
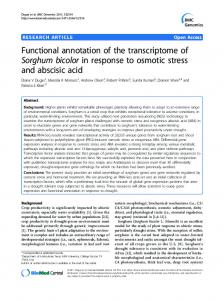
Figure 1 | Strategies for gapped alignments of RNA-seq reads to the genome. (a,b) An illustration of reads obtained from a two-exon transcript; black and gray indicate exonic origin of reads. Exon-first methods (a) map full, unspliced reads (exonic reads), and remaining reads are divided into smaller pieces and mapped to the genome. An extension process extends mapped pieces to find candidate splice sites to support a spliced alignment. Seed-and-extend methods (b) store a map of all small words (k-mers) of similar size in the genome in an efficient lookup data structure; each read is divided into k-mers, which are mapped to the genome via the lookup structure. Mapped k-mers are extended into larger alignments, which may include gaps flanked by splice sites. (c) A potential disadvantage of exon-first approaches illustrated for a gene and its associated retrotransposed pseudogene. Mismatches compared to the gene sequence are indicated in red. Exonic reads will map to both the gene and its pseudogene, preferring gene placement owing to lack of mutations, but a spliced read could be incorrectly assigned to the pseudogene as it appears to be exonic, preventing higher-scoring spliced alignments from being pursued.
Second, unmapped reads are split into shorter segments and aligned independently. The genomic regions surrounding the mapped read segments are then searched for possible spliced connections. Exonfirst aligners are very efficient when only a small portion of the reads require the more computationally intensive second step. Alternatively, seed-extend methods8,50,51 such as ‘genomic short-read nucleotide alignment program’ (GSNAP)50 and ‘computing accurate spliced alignments’ (QPALMA)51 break reads into short seeds, which are placed onto the genome to localize the alignment (Fig. 1b). Candidate regions are then examined with more sensitive methods, such as the Smith-Waterman algorithm51 or iterative extension and merging of initial seeds8,50 to determine the exact spliced alignment for the read (Fig. 1b). Many of these alignment methods47–51 also support pairedend read mapping, which increases alignment specificity. Exon-first approaches are faster and require fewer computational resources compared to seed-extend methods. For example, a seedextend method (GSNAP) takes ~8× longer (~340 CPU hours) than an exon-first method (TopHat) resulting in ~1.5× more spliced reads (Supplementary Table 1). However, the biological meaning of these additional splice junctions has not been demonstrated. Exon-first approaches can miss spliced alignments for reads that also map to the genome contiguously, as can occur for genes that have retrotransposed pseudogenes (Fig. 1c). In contrast, seedextend methods evaluate spliced and unspliced alignments in the same step, which reduces this bias toward unspliced alignments, yielding the best placement of each read. Seed-extend methods perform better than exon-first approaches when mapping reads from polymorphic species52. Transcriptome reconstruction Defining a precise map of all transcripts and isoforms that are expressed in a particular sample requires the assembly of these reads or read alignments into transcription units. Collectively, we refer to this process as transcriptome reconstruction. Transcriptome reconstruction is a difficult computational task for three main reasons. nature methods | VOL.8 NO.6 | JUNE 2011 | 471
review genome-independent methods assemble the reads directly into transcripts without using a reference genome.
Genome-guided approach
Genome-guided reconstruction. Existing genome-guided methods can be classified in two main categories: ‘exon identification’ and ‘genome-guided assembly’28,29 approaches. Exon identification16,23 methods such as G.mor.se16 were developed early when reads were short (~36 bases) and few aligned to exon-exon junctions. They first define putative exons as coverage islands, and then use spliced reads that span across these coverage islands to define exon boundaries and to establish connections between exons. Exon identification methods provided a first approach to solve the transcript reconstruction problem best suitable for short reads, a RNA 1 RNA 2 but they are underpowered to identify fulllength structures of lowly expressed, long Sequence-fragmented RNA and alternatively spliced genes. To take advantage of longer read Align reads Break reads lengths, genome-guided assembly methto genome into k-mer seeds Assemble ods such as Cufflinks 29 and Scripture 28 reads have been developed. These methods use spliced reads directly to reconstruct the transcriptome28,29. Scripture initially de Bruijn k-mer graph transforms the genome into a graph topolFragments aligned to genome ogy, which represents all possible connecParse graph into sequences tions of bases in the transcriptome either Transcript 1 Assemble alignments Transcript 2 when they occur consecutively or when they are connected by a spliced read. Align sequences to genome Scripture uses this graph topology to Transcript graph reduce the transcript reconstruction problem to a statistical segmentation problem of identifying significant transcript paths Parse graph across the graph 28 . Scripture provides into transcripts increased sensitivity to identify transcripts expressed at low levels by working with significant paths, rather than significant exons28. Cufflinks uses an approach originally developed for EST assembly7, to Genomic loci connect aligned reads into a graph based on the location of their spliced alignb Branch point 1 Branch point 2 ments 29 . Scripture and Cufflinks build conceptually similar assembly graphs Transcript graph but differ in how they parse the graph into transcripts. Scripture reports all isoforms that are compatible with the read Maximal set Minimal possible set 1 data (maximum sensitivity) 28 , whereas Cufflinks reports the minimal number of compatible isoforms (maximum precision)29. Specifically, Scripture enumerates Minimal possible set 2 all possible paths through the assembly graph that are consistent with the spliced reads and the fragment size distribution of the paired end reads. In contrast, Figure 2 | Transcriptome reconstruction methods. (a) Reads originating from two different isoforms of the Cufflinks chooses a minimal set of paths same genes are colored black and gray. In genome-guided assembly, reads are first mapped to a reference through the graph such that all reads are genome, and spliced reads are used to build a transcript graph, which is then parsed into gene annotations. included in at least one path. Each path In the genome-independent approach, reads are broken into k-mer seeds and arranged into a de Bruijn defines an isoform, so this minimal set graph structure. The graph is parsed to identify transcript sequences, which are aligned to the genome to of paths is a minimal assembly of reads. produce gene annotations. (b) Spliced reads give rise to four possible transcripts, but only two transcripts are needed to explain all reads; the two possible sets of minimal isoforms are depicted. As there can be many minimal sets of 472 | VOL.8 NO.6 | JUNE 2011 | nature methods
Genome-independent approach
© 2011 Nature America, Inc. All rights reserved.
First, gene expression spans several orders of magnitude, with some genes represented by only a few reads. Second, reads originate from the mature mRNA (exons only) as well as from the incompletely spliced precursor RNA (containing intronic sequences), making it difficult to identify the mature transcripts. Third, reads are short, and genes can have many isoforms, making it challenging to determine which isoform produced each read. Several methods exist to reconstruct the transcriptome, and they fall into two main classes: ‘genome-guided’ and ‘genomeindependent’ (Fig. 2). Genome-guided methods rely on a reference genome to first map all the reads to the genome and then assemble overlapping reads into transcripts. By contrast,
review
© 2011 Nature America, Inc. All rights reserved.
Genome-independent reconstruction. Rather than mapping reads to a reference sequence first, genome-independent transcriptome reconstruction algorithms such as transAbyss53 use the reads to directly build consensus transcripts53–55. Consensus transcripts can then be mapped to a genome or aligned to a gene or protein database for annotation purposes. The central challenge for genome-independent approaches is to partition reads into disjoint components, which represent all isoforms of a gene. A commonly used strategy is to first build a de Bruijn graph, which models overlapping subsequences, termed ‘k-mers’ (k consecutive nucleotides), rather than reads55–58. This reduces the complexity associated with handling millions of reads to a fixed number of possible k-mers 57,58. The overlaps of k – 1 bases between these k-mers constitute the graph of all possible sequences that can be constructed. Next, paths are traversed in the graph, guided by read and paired-end coverage levels, eliminating false branch points introduced by k-mers that are shared by different transcripts but not supported by reads and paired ends. Each remaining path through the graph is then reported as a separate transcript (Fig. 2). Although genome-independent reconstruction is conceptually simple, there are two major complications: distinguishing sequencing errors from variation, and finding the optimal balance between sensitivity and graph complexity. Unlike the mapping-first strategy, sequencing errors introduce branch points in the graph that increase its complexity. To eliminate these artifacts, genomeindependent methods look at the coverage of different paths in the graph and apply a coverage cutoff to decide when to follow a path or when to remove it53,59. In practice, the choice of the k-mer length for this analysis can greatly affect the assembly53. Smaller values of k result in a larger number of overlapping nodes and a more complex graph, whereas larger values of k reduce the number of overlaps and results in a simpler graph structure. An optimal choice of k depends on coverage: when coverage is low, small values of k are preferable because they increase the number of overlapping reads contributing k-mers to the graph. But when coverage is large, small values of k are overly sensitive to sequencing errors and other artifacts, yielding very complex graph structures59. To cope with the variability in transcript abundance intrinsic to expression data, several methods, such as transABySS, use a variable k-mer strategy to gain power across expression levels to assemble transcripts53,55, albeit at the expense of CPU power and requiring parallel execution.
2
Low
3
Short transcript
4
High
Long transcript
FPKM
1
Read count
a
1
b
2
d
3
104
Isoform 1
4
1
2
3
4
Exon union model Transcript model
102 101 100 10−1 10−2
25%
10−2 10−2 100
0%
c
103
Estimated FPKM
Isoform 2 Transcript expression method
Likelihood of isoform 2
isoforms, Cufflinks uses read coverage across each path to decide which combination of paths is most likely to originate from the same RNA29 (Fig. 2b). Scripture and Cufflinks have similar computational requirements, and both can be run on a personal computer. Both assemble similar transcripts at the high expression levels but differ substantially for lower expressed transcripts where Cufflinks reports 3× more loci (70,000 versus 25,000) most of which do not pass the statistical significance threshold used by Scripture (Supplementary Table 1 and Supplementary Fig. 3). In contrast, Scripture reports more isoforms per locus (average of 1.6 versus 1.2) with difference arising only for a handful of transcripts (Supplementary Table 1). In the most extreme case, Scripture reports over 300 isoforms for a single locus whereas Cufflinks reports 11 isoforms for the same gene.
25%
100%
Isoform 1
Isoform 2
101
102
103
104
True FPKM
Confidence interval
Isoform 1 Exon union method
Isoform 2
Exon intersection method
Figure 3 | An overview of gene expression quantification with RNA-seq. (a) Illustration of transcripts of different lengths with different read coverage levels (left) as well as total read counts observed for each transcript (middle) and FPKM-normalized read counts (right). (b) Reads from alternatively spliced genes may be attributable to a single isoform or more than one isoform. Reads are color-coded when their isoform of origin is clear. Black reads indicate reads with uncertain origin. ‘Isoform expression methods’ estimate isoform abundances that best explain the observed read counts under a generative model. Samples near the original maximum likelihood estimate (dashed line) improve the robustness of the estimate and provide a confidence interval around each isoform’s abundance. (c) For a gene with two expressed isoforms, exons are colored according to the isoform of origin. Two simplified gene models used for quantification purposes, spliced transcripts from each model and their associated lengths, are shown to the right. The ‘exon union model’ (top) uses exons from all isoforms. The ‘exon intersection model’ (bottom) uses only exons common to all gene isoforms. (d) Comparison of true versus estimated FPKM values in simulated RNA-seq data. The x = y line in red is included as a reference.
Reconstruction strategies compared. Both genome-guided and genome-independent algorithms have been reported to accurately reconstruct thousands of transcripts and many alternative splice forms28,29,53,55. The question as to which strategy is most suitable for the task at hand is strongly governed by the particular biological question to be answered. Genome-independent methods are the obvious choice for organisms without a reference sequence, whereas the increased sensitivity of genome-guided approaches makes them the obvious choice for annotating organisms with a reference genome. In the case of genomes or transcriptomes that have undergone major rearrangements, such as in cancer cells26, the answer to the above question becomes less clear and depends on the analytical goal. In many cases, a hybrid approach incorporating both the genome-independent and genomeguided strategies might work best for capturing known information as well as capturing novel variation. In practice, genomeindependent methods require considerable computational resources (~650 CPU hours and >16 gigabytes of random-access nature methods | VOL.8 NO.6 | JUNE 2011 | 473
review a Condition 1 Condition 2
Condition 2
Condition 1
Condition 1
Condition 2
Condition 2
Expression estimate
Probability
Expression
Condition 1
Expression estimator value
b Condition 1 Condition 2
Isoform 2
Exon intersection method
Transcript expression method Transcript expression level
Exon intersection expression level
© 2011 Nature America, Inc. All rights reserved.
Isoform 1
Condition 1
Condition 2
Detected change
Condition 1
Condition 2
Figure 4 | Overview of RNA-seq differential expression analysis. (a) Expression microarrays rely on fluorescence intensity via a hybridization of a small number of probes to the gene RNA. RNA-seq gene expression is measured as the fraction of aligned reads that can be assigned to the gene. (b) A hypothetical gene with two isoforms undergoing an isoform switch between two conditions is shown. The total number of reads aligning to the gene in the two conditions is similar, but its distribution across isoforms changes. Differential expression using the simplified exon union or exon intersection methods reports no changes between conditions while estimating read counts and expression for the individual isoforms detects both differential expression at the gene and isoform level.
memory (RAM)) compared to genome-guided methods (~4 CPU hours and