pollutants by microflotation", AIChE Journal, 17, 1486-. 1491. COLLINS, G.L. and JAMESON, G.J., (1977),. "Double-layer effects in the flotation of fine particles",.
Fifth International Conference on CFD in the Process Industries CSIRO, Melbourne, Australia 13-15 December 2006
COMPUTATIONAL MODELLING AND VALIDATION OF ULTRAFINE PARTICLE FLOTATION Peter F. GEORGE, Anh V. NGUYEN, and Graeme J. JAMESON Chemical Engineering, The University of Newcastle, Callaghan, NSW 2308, AUSTRALIA
ABSTRACT The flotation of ultrafine (nano and submicron) particles is important in the mineral processing and wastewater treatment industries. The flotation efficiency of these particles is not adequately described by the conventional theory, based on the interception and collision mechanisms. This paper describes a computational modelling for ultrafine particle flotation and its comparison with experimental results obtained in a small laboratory cell with fine bubbles. The model was developed by incorporating fundamental theories of mass transfer, Brownian diffusion, microhydrodynamics of particles in the vicinity of a slip surface of air bubbles, and colloidal interactions that come into effect at small separation distances. The governing equation describing the particle collection was numerically solved. The experiments were conducted with silica particles of 40 nm, 100 nm, and 3μm in diameter and at 1% (by weight) concentration. Cetyltrimethylammonium bromide and Dowfroth 250 surfactant were used as the collector and frother, respectively. The surface charge of the particles and bubbles in the surfactant solutions were measured with the Brookhaven ZetaPlus apparatus and Rank Brothers Zeta Meter. No homocoagulation of the silica particles was confirmed and the flotation separation was principally due to heterocoagulation between particles and bubbles. Both the computational and experimental results show a minimum in the collection efficiency at a particle size in the order of 100nm. With larger particles, the interception and inertial collision predominate the particle capture, while the diffusion and colloidal forces control the collection of particles with a size smaller than the transition size. NOMENCLATURE C particle concentration Cb particle concentration in the bulk D tensor of the particle diffusivity D∞ particle diffusivity in the bulk ( D∞ = kBTm∞ ) E Collection efficiency Fex external forces (Fr = radial & Fϕ = tangential) Fedl electrical double-layer surface force Fhyd hydrophobic surface force FvdW van der Waals surface force fi microhydrodynamic resistance factor (i = 1 to 4) h depth of liquid in the flotation cell ir radial unit vector iϕ tangential unit vector J particle flux (Jr = radial & Jϕ = tangential) Ki hydrophobic force constant (i = 1, 2) k flotation rate constant kB Boltzmann constant
m tensor of particle mobility m∞ particle mobility in the bulk, 1/ m∞ = 6πμ R p np Q R Rb Rp r T t U V Vs Vc W z
particle refractive index gas volumetric flow rate tensor of resistance bubble radius particle radius radial coordinate (Figure 1) absolute temperature reference time bubble slip velocity non-Brownian particle velocity particle terminal settling velocity volume of flotation cell water velocity (Wr = radial & Wϕ = tangential) stretching variable, r = Rb exp( z )
κ λi μ ρ ψp ψb ϕ
Debye constant decay length of hydrophobic force (i = 1, 2) water viscosity difference between the particle and water densities particle surface potential bubble surface potential polar coordinate (Figure 1)
INTRODUCTION The advances currently being made in grinding technology are allowing large, complex low-grade mineral deposits to be exploited economically. The continual reduction in grade is forcing miners to produce ultra fine particles in order to liberate mineral particles from the ore, e.g. the McArthur River and Century Zinc base metal deposits (Potts, 2003). However, ultrafine particles are usually difficult to be recovered by flotation because the particle mass is so small that the efficiency of particle capture by air bubbles is significantly reduced. Submicron particles may be too large to be significantly influenced by Brownian diffusion, but are so small that the electrical double-layer and viscous forces are much greater than the inertial forces. This makes the submicron particles difficult to capture with air bubbles. These particles simply follow the water streamlines around the bubbles without making contact. Nanoparticles in the size range 10 to 100 nm have many of the characteristics of large molecules and undergo Brownian diffusion, which can enhance the collection by bubbles. A number of theories have been developed to estimate the flotation recovery of nanoparticles, including Reay and Ratcliff (Reay and Ratcliff, 1973), Collins and Jameson (Collins and Jameson, 1977) and Ramirez et al. (Ramirez et al., 1999; Ramirez et al., 2000). An
B
1
simulations are compared with experimental results for the flotation of silica ranging from 40nm to 3μm in diameter.
interesting feature of these predictions is that at a certain particle diameter, below 1 µm, the recovery of fine particles begins to increase with decreasing particle diameter. This is the opposite to the effect observed for the inertial-controlled flotation of particles between 1 and 10 microns in diameter. This phenomenon, however, does not appear to have been observed experimentally. As the particle size decreases below one micron, its inertia becomes insignificant, and Brownian motion, hydrodynamic interaction and surface force interaction become the driving force for bubble-particle collection. The simplest of the three models, developed by Reay and Ratcliff (Reay and Ratcliff, 1973), accounts only for the Brownian motion, while the Collins model (Collins and Jameson, 1977) accounts for hydrodynamic interactions and London-Van der Waals force, in addition to the Brownian motion. While the Ramirez model (Ramirez et al., 1999; Ramirez et al., 2000) accounted for the same effects as the Collins model, the hydrodynamic mobility was calculated as a function of inter-particle distance to take account of the Marangoni effect. This model involved the formulation of the Fokker-Planck equation for the pair-distribution function and was designed to account for bubbles with different mobilities. There are a number of significant problems with each of these models including their neglect of the electrical double layer interaction force and the hydrophobic force in their surface force calculations. Also, Collins applied the traditional Hamaker constant combining rules in his model, which give a negative Hamaker constant, indicating that the thin water film between a gas bubble and a solid surface is stable and should never disrupt spontaneously, which is contrary to observation (Nguyen and Schulze, 2004). This issue was recently addressed by Nguyen (Nguyen et al., 2001) who proposed a model for the Hamaker constant which changes with inter-centre particle-bubble distance. There has only been limited experimental work investigating the collection efficiency of particles. Thus Cassell et al. (Cassell et al., 1971) floated 1μm polystyrene latex sphere and Reay and Ratcliff (Reay and Ratcliff, 1975) floated glass spheres of diameter 1-30μm and 6μm latex particles. The results from both studies were found to match the simple Reay and Ratcliff model (Reay and Ratcliff, 1973), except for the charged latex particles. The neglect of the electrical double layer interaction force in the model was cited as the key reason for the discrepancy. In an early study (Fukui and Yuu, 1980), 0.6μm polystyrene particles were floated using 20μm bubbles generated by electrolysis. A single collection efficiency of 0.0022 was determined for neutrally charged submicron particles, which is in the same order as the results predicted by (Reay and Ratcliff, 1973). Although the results appear to agree with theory, they must be questioned on experimental grounds. The electrolyte AlCl3 used in the experiment can hydrolyse to form a powerful coagulating agent and the possibility of particle aggregation cannot be ruled out. In this paper, we present a computational model for particle collection by Brownian diffusion and convection forces. Fundamental theories of convection, microhydrodynamics and colloidal forces are incorporated. The colloidal forces considered include van der Waals, electrical double-layer and hydrophobic forces. The model
2
U
1
Bubble
r Particle
ϕ
3
Vr
Vϕ
Bubble
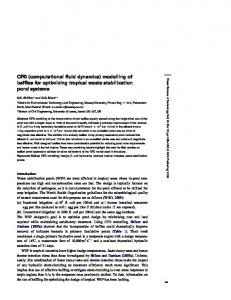
Figure 1: Schematic of the interception (1), gravity (2) and Brownian (3) transport mechanisms for fine particles towards a rising bubble in a rotationally symmetrical coordinate system (r, ϕ). The thick lines describe the particle trajectory while the thin lines describe the liquid streamlines. MODEL DESCRIPTION The model described in this paper considers three predominant transport mechanisms: interception, gravity and Brownian diffusion (Figure 1). Inertial forces are neglected. The transport of submicron particles satisfies the conservation of mass, given by ∂C / ∂t + ∇ ⋅ J = 0
(1)
where the particle flux, J, due to the convection and diffusion processes can be described by J = VC − DΔC
(2)
The particle velocity in Eq. (2) can be determined from the force balance by considering the effect of the microhydrodynamics on the particle motion around the bubble, giving
V = R ⋅ W + m ⋅ Fex
(3)
The tensors of diffusivity in Eq. (2) and mobility in Eq. (3) are related by the Stokes-Einstein equation: D = kBT m . The tensors are described by (Nguyen and Schulze, 2004) 0 ⎤ ⎡ i r i r f1 m = m∞ ⎢ iϕ iϕ f 3 ⎥⎦ ⎣ 0 ⎡i r i r f 2 R=⎢ ⎣ 0
(4)
0 ⎤ iϕ iϕ f 4 ⎥⎦
(5)
where the microhydrodynamic resistance factors are described by (Nguyen and Schulze, 2004) ⎧ ⎛ R / 4 ⎞0.719 ⎫ ⎪ ⎪ p f1 = ⎨1 + ⎜ ⎜ r − R − R ⎟⎟ ⎬ p b ⎠ ⎪⎩ ⎝ ⎪⎭
2
−1/ 0.719
(6)
⎧ ⎛ R / 8.109 ⎞0.909 ⎫ ⎪ ⎪ p f 2 = ⎨1 + ⎜ ⎟⎟ ⎬ ⎜ ⎪⎩ ⎝ r − R p − Rb ⎠ ⎪⎭ f3 =
dispersion occurs when the numerical step in the radial direction is too large, while overshoot is significant if the numerical step in the transverse direction is too coarse. Due to these numerical difficulties, oscillations may appear in the numerical solution, leading to slow convergence and numerical instability. Overshoot and numerical dispersion can be controlled using the mesh Peclet number and the Courant number. In relation to Eq. (15) the mesh Peclet number is defined as Bz Δz / f1 ,
−1/ 0.909
1.501 + ( r − R p − Rb ) / R p
(7)
1.106 + ( r − R p − Rb ) / R p
(8)
f4 = 1
(9)
where Δz is the maximum step size in the radial direction. The Courant number is defined as Bz Δϕ / Δz / f1 , where Δϕ is the maximum step size in
The water velocity in the radial and tangential direction may be calculated using the Hadamard-Rybczynski theory (Nguyen, 1999). The radial and tangential components of the external forces, Fr and Fϕ, are described as Fr = −
4π R Δρ 3 p
3
cos ϕ + ( FvdW + Fedl + Fhyd )
Fϕ = −
4π R 3p ρ 3
sin ϕ
the transverse direction. Designing a numerical model with small mesh Peclet and Courant numbers effectively decreases oscillations, improves accuracy and decreases numerical dispersion. Most numerical methods give an accurate solution when these numbers are smaller than unity. These criteria were used to obtain the solutions presented in this paper. Due to the stiffness of the governing equation, extremely small step sizes are required to prevent the numerical oscillation and instability, particularly in the region in the vicinity of the bubble surface. It is also noted that the colloidal forces which cause the stiffness problem diminish at large separation distances. Therefore, an extremely fine mesh is not required for the region far from the bubble surface. Consequently, the computational domain can be divided into two regions, an inner and outer region. In the inner region, where the colloidal forces are very strong, an exponentially decreasing (towards the bubble surface) step size in the separation distance H was used. The largest separation distance of the inner region was equal to 500 nm. In the case of no attractive forces, the shortest separation distance of the inner region was about 10-10 times the particle radius. The step size increases gradually towards the end of the inner region. A uniform step size with relatively large increment in the separation distance was used for the outer region. Once the particle concentration distribution around the bubble is determined, the local radial flux, Jr, of particles at the bubble surface can be determined from Eq. (2), and the overall rate of collection is obtained by integration. Division by the simple swept-volume rate of collection yields the collection efficiency E, which is described by:
(10)
(11)
Equations for the van der Waals, electrical double-layer and hydrophobic forces can be found in (Nguyen and Schulze, 2004). Eq. (1) can be now rewritten as
1 1 2 ( r J r ) + r sin1 ϕ ∂∂ϕ (sin ϕ Jϕ ) = 0 r 2 ∂r
(12)
where J r = Wr f 2C − D∞ f1
Jϕ = Wϕ f 4C −
∂C + m∞ f1Fr C ∂r
D∞ f 3 ∂C + m∞ f 3 Fϕ C r ∂ϕ
(13) (14)
Since the colloidal forces change rapidly in the limit as r approaches the bubble radius, the exponential stretching of the radial coordinate, r = Rb exp( z ) , can be used to increase accuracy in the numerical solution. Inserting Eqs. (13) and (14) into Eq. (12) gives ∂ 2C ∂ 2C ∂C ∂C f1 + 2 f 3 + Bz + Bϕ + CBc = 0 2 ∂z ∂ϕ ∂z ∂ϕ
(15)
Parameters Bz, Bϕ and Bc are functions of the particle radial and polar positions, liquid velocity, the bubble and particle terminal velocities, surface forces, the bubble and particle diameters, and the particle diffusivity D∞. Equation (15) may be solved using the boundary conditions: ∂C / ∂r = 0 at ϕ = 0 and ϕ = π, C ( r → ∞, ϕ ) = Cb and C ( r → 0, ϕ ) = 0 . The first and
π
E=
2 − J ( z → 0,ϕ ) sin ϕ dϕ U + ( Vs ) Cb ∫0 r
(16)
EXPERIMENTAL The flotation experiments were conducted in a one-litre batch column-type cell of internal diameter 70mm and of a height variable from 305 to 405mm. The bubbles were produced by introducing nitrogen gas through a 68mm diameter Pyrex glass sintered disc of porosity three (Corning Ltd, Artington, Surrey, UK), to produce an average bubble diameter, determined photographically, of 150μm. The volumetric gas flow rate was 80cm3/min. The height of the froth phase was 285mm and was maintained by a constant feed of flotation solution from a large diameter feed tank The results obtained from the model were compared against experimental results obtained from the flotation of
second derivatives in Eq. (15) on a non-uniform mesh can be approximated with the central finite difference scheme. The over-relaxation method can be applied to solve the algebraic equations. The initial solutions can be obtained using the parabolic approximation with ∂ 2C / ∂ϕ 2 = 0 and the Crank-Nicholson numerical method. Due to the nature of the molecular interactions, the colloidal forces, in particular the van der Waals and double-layer forces are infinitely large, as the particle approaches the bubble surface. As a result, the particle transport equation becomes very stiff. Several numerical difficulties are commonly encountered with stiff partial differential equations. These numerical difficulties are of two types: overshoot and numerical dispersion. Numerical
3
silica particles ranging in diameter from 40 to 3000nm. A 2% concentration of Snowtex 20L, Snowtex ZL (Nissan Chemical America Corporation, Houston, Texas, USA) and Nyasil 20 (Nyacol Nanotechnologies Inc, Ashland, Massachusetts, USA) particles were floated separately and the tests repeated in triplicate. The frother used in the experiments was Dowfroth 250 (Dow Chemical Corporation, Ludington, Michigan, USA) at a concentration of 30 ppm. The collector was cetyltrimethyl ammonium bromide (CTAB) (Ajax Chemicals, Sydney, Australia) at a concentration of 5 x 10⁻⁵M. In these experiments the total recovery of particles was low, typically 54% after 50 minutes. The rate constant for each size particle floated was determined by plotting the log of the concentration of particles captured against time dC / dt = − kC . The collection efficiency was determined directly from the rate constant, k, by (Nguyen and Schulze, 2004) E=
4 Rb kVc 3Qh
photographs were taken and the bubble size was measured using the computer program Optimas 6.1. The zeta potential of the silica particles were measured using a ZetaPlus apparatus (Brookhaven Instrument Corporation, Holtsville, New York, USA). Heterocoagulation of particles was checked with jar tests. Stable suspensions were confirmed with no evidence of settling over a 24-hour period. The electrophoretic mobility of nitrogen bubbles in the flotation solutions was measured using a microelectrophoresis apparatus (Rank Brothers Ltd, Bottisham, Cambridge, UK) and the technique described by Jameson et al. (Collins et al., 1978; Kubota and Jameson, 1993). This apparatus was modified to attach a Fire-I 400 digital video camera (UniBrain Ltd, San Ramon, California, USA) to capture the motion of very fine bubbles at the stationary plane of the electrophoretic cell. The electrophoretic mobility was measured in an 80 volt, 80mm length electric field. The nitrogen bubbles were generated in a 304L SS DOT-3A 1800 pressure vessel (Swagelok, Highland Heights, Ohio, USA) with a 1000 cm3 volume. The vessel was filled with 600ml water, purified using the Milli-Q plus system, and cooled to 5oC. It was then pressurized to 1000 kPa with high purity nitrogen gas (BOC Gases Australia Ltd, Sydney, NSW, Australia) for a 24-hour period. The rise velocity of the bubbles in the surfactant solutions was determined and was well correlated with the velocity predicted by the Stokes law for fine bubbles with a rigid (immobile) interface, which was due to the adsorbed surfactant molecules. Therefore, the simple Smoluchowski equation was used to convert the electrophoretic mobility of the bubbles into the zeta potential.
(17)
The experimental work also investigated whether the nanoparticles were recovered by true flotation by means of bubble-particle attachment interactions or entrainment by means of water recovery into the froth products. The experimental methods and results have been published (George et al., 2004) and show that the level of true flotation and entrainment can be determined with high certainty and that the proportion of the colloidal particles recovered by true flotation was quite high. The high efficiency of true flotation obtained with colloidal silica is due to the low particle concentration and the fine bubble size, 150um, used in the experiments. The particle size distribution was assessed using three different techniques, including laser light scattering, photon correlation spectroscopy, and transmission electron microscopy. The laser light scattering was performed using a Mastersizer 2000 (Malvern Instruments Ltd, Worcestershire, UK). The Mastersizer measures particles ranging in size from 50 to 800 nm. The photon correlation spectroscopy was performed using a Dynamic Light Scattering unit ‘DLS/SLS–5022F’ (ALV-laser Vertriebsgesellschaft GbmH, Langen, Hessen, Germany). This instrument measures the Doppler frequency shift of the scattered light from a particle undergoing random Brownian motion. The Doppler frequency shift is proportional to the hydrodynamic radius of the particle. A second photon correlation spectroscopy unit, a Malvern Zetasizer Nano S (Malvern Instruments Ltd, Worcestershire, UK) was also used to measure the particle size distribution between 1nm and 200nm. The transmission electron micrographs were taken using a JEM-1200EX11 transmission electron microscope (Jeol USA, Peabody, Massachusetts, USA). The micrographs were digitised and sized using the computer program Optimas 6.1 (Media Cybernetics Corporation, Carlsbad, California, USA). The size of the nitrogen bubbles rising in the flotation cell was measured by inserting a solution-filled photographic cell into the column and taking scaled photos of the bubbles rising up through the pulp and into the photographic cell (Ahmed and Jameson, 1985). The bubble size was measured in a solution of 30ppm Dowfroth 250 and 5x10⁻⁵M CTAB. A series of ten digital
Scaled Particle Concentration, C /Cb
300
200
100
0
-100
-200
-300 0
0.5 1 1.5 Scaled Separation Distance, (r - R b - R p )/R p
2
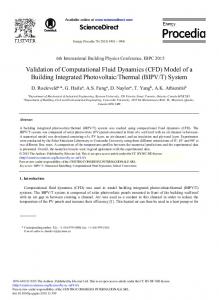
Figure 2: Typical oscillation in the particle concentration profile produced by a coarse grid when strong attractive colloidal forces are present. Inputs for the numerical solution include ϕ = 0, Rp = 100 nm, Rb = 1 mm, ρ = 1500 kg/m3, np = 1.6, 1/κ = 50 nm, ψp = 0, ψb = 0, K1 = –7 mN/m, K2 = –6 mN/m, λ1 = 6 nm, λ2 = 20 nm. Thickness of the inner and outer regions was 300 nm and 3000 nm, respectively. RESULTS AND DISCUSSION Calculations were carried out in order to determine the optimal mesh steps, and the size of the inner and outer
4
regions. These calculations were carried out for hydrophobic particles in the presence of strong attractive double-layer and hydrophobic forces. Numerical solutions become oscillatory if the mesh is insufficiently fine, due to the stiffness of the differential equation, noted earlier. An example of the oscillation in the particle concentration obtained with a coarse grid is shown in Figure 2. The number of nodes in the inner region was 50. The total number of nodes in the radial direction was 340. In terms of increment in the separation distance, the smallest step size in the inner region was about 0.035. A stable solution, shown in Figure 3, was obtained when the number of nodes in the inner region was increased and the radial step size in the inner region was decreased. In Figure 3, the data shown by the filled circles was obtained when the number of nodes in the inner region was increased to 100, while the minimal step size was decreased to 1.4 × 10 −5 . The data shown by the open circles was obtained with 200 nodes in the inner region and 6.5 × 10 −10 for the minimal radial step size. The two sets of data were essentially identical.
Scaled Particle Concentration, C /Cb
1
0.6
Hmax = 300 Rp Hmax = 60 Rp
0.4
Hmax = 40 Rp Hmax = 30 Rp
0.2
0 0
10 20 30 40 50 Scaled Separation Distance, (r - R b - R p )/R p
Figure 4: Numerical solutions for particle concentration profiles obtained with different maximal separation distances used to impose the infinity boundary condition. Inputs for the numerical solution include ϕ = 0, Rp = 10 nm, Rb = 1 mm, ρ = 1500 kg/m3, np = 1.6, κ = 1/50 nm-1, ψp = 10 mV, ψb = 40 mV, K1 = 0, and K2 = 0.
100
80
1 Collection efficiency, E
Scaled Particle Concentration, C /Cb
0.8
60
40
20
0 0.001
0 mV - 15mV - 25mV - 40mV
0.1
0.01
0.001 0.01
0.1
1
Scaled Separation Distance, (r - R b - R p )/R p
0.0001
Figure 3: Correct numerical solutions for particle concentration distributions produced with fine (filled circles) and very fine mesh (open circles). Inputs for numerical solution are described in the caption to Figure 14. Note the logarithmic scale used on the horizontal axis.
10
100
1000
Particle diameter (nm)
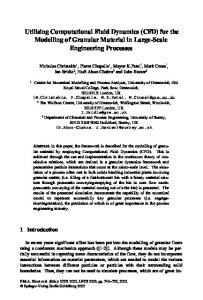
Figure 5:Theoretical prediction for the collection efficiency versus the particle size and the bubble surface potential. The numerical constants included the bubble diameter (150μm); particle refractive index (1.54), density (2600kg/m3) and surface potential (-35mV); Debye length (50 nm); and the hydrophobic force parameters: K1 = 7mN/m, K2 = -6mN/m, λ1 = 6nm and λ2 = 20nm.
In the numerical computation, the (outer) boundary condition far from the bubble surface (at infinity) must be imposed at some finite distance measured from the bubble surface. The finite distance was numerically found by trial and error. In this procedure, a number of the finite distances were selected to solve the governing equation. Then the numerical results for the particle concentration obtained with different values for the distances were compared. The finite distance was determined when no significant difference in the particle concentration distributions obtained with two consecutive values for the finite distance was found. A relative error of 0.1% in the relative concentration was used as the quantitative measure. Typically, the finite distance 200Rp was found to satisfy the requirement. Figure 4 shows typical profiles of the particle concentrations obtained with different numerical values for the position of the outer boundary.
Predicted values of the collection efficiency are shown in Figure 5 for values of the bubble surface potential from 0 to -50mV. The constants used in the calculations include the particle density, surface potential and bubble diameter measured in the experiment. The empirical hydrophobic decay lengths, λ1 and λ2 along with the associated hydrophobic force constants, K1 and K2, agree with the measured data using an atomic force microscope. Greater positive charges lead to decreases in the predicted collection efficiencies. The particle diameter where the minimum collection efficiency occurs
5
show the collection efficiency to have a minimum at a particle size in the order of 100nm. With larger particles, the interception and collision mechanisms predominate, while the diffusion and colloidal forces control the collection of particles with a size smaller than the transition size.
decreased from around 100nm down to 20nm across the range of bubble potentials. For particles sizes below the minimum, the collection efficiency increases because of the increased Brownian diffusivity. Results from the model are compared with the experimental results in Figure 6. The experimental results obtained from the flotation of three different types of silica are compared with the model simulation for bubble zeta potentials of -50mV and -30mV. The zeta potential of the bubble in a solution of 5x10⁻⁵M CTAB was measured as -55mV. The addition of a neutral frother molecule should take up some of the sites on the bubble surface previously occupied by the CTAB molecules, thereby reducing the overall zeta potential of the bubbles. The predicted particle diameter at minimum collection efficiency is in reasonable agreement with the data, although the model over-predicts the collection efficiency for the larger particle diameters.
ACKNOWLEDGEMENT The authors acknowledge the Australia Research Council for financial support. REFERENCES AHMED, N. and JAMESON, G.J., (1985), "The effect of bubble size on the rate of flotation of fine particles", Int. J. Miner. Process., 14, 195-215. CASSELL, A.E. et al., (1971), "Removal of colloid pollutants by microflotation", AIChE Journal, 17, 14861491. COLLINS, G.L. and JAMESON, G.J., (1977), "Double-layer effects in the flotation of fine particles", Chem. Eng. Sci., 32, 239-46. COLLINS, G.L. et al., (1978), "A method for measuring the charge on small gas bubbles", J. Colloid Interface Sci., 63, 69-75. FUKUI, Y. and YUU, S., (1980), "Collection of submicron particles in electro flotation", Chem. Eng. Sci., 35, 1095-1105. GEORGE, P. et al., (2004), "Assessment of true flotation and entrainment in the flotation of submicron particles by fine bubbles", Minerals Engineering, 17, 847853. KUBOTA, K. and JAMESON, G.J., (1993), "A study of the electrophoretic mobility of a very small inert gas bubble suspended in aqueous inorganic electrolyte and cationic surfactant solutions", J. Chem. Eng. Jpn., 26, 712. NGUYEN, A.V., (1999), "Hydrodynamics of liquid flows around air bubbles in flotation: a review", Int. J. Miner. Process., 56, 165-205. NGUYEN, A.V. et al., (2001), "Prediction of van der Waals interaction in bubble-particle attachment in flotation", Int. J. Miner. Process., 61, 155-169. NGUYEN, A.V. and SCHULZE, H.J., (2004), "Colloidal science of flotation". Marcel Dekker, New York, 840 pp. POTTS, A., (2003), "Flotation - far from sinking", Mining Magazine, 188, 102-110. RAMIREZ, J.A. et al., (1999), "The flotation rates of fine spherical particles under Brownian and convective motion", Chemical Engineering Science, 54, 149-157. RAMIREZ, J.A. et al., (2000), "Microflotation of fine particles in the presence of a bulk-insoluble surfactant", Int. J. Multiphase Flow, 26, 891-920. REAY, D. and RATCLIFF, G.A., (1973), "Removal of fine particles from water by dispersed air flotation. Effects of bubble size and particle size on collection efficiency", Can. J. Chem. Eng., 51, 178-85. REAY, D. and RATCLIFF, G.A., (1975), "Experimental testing of the hydrodynamic collision model of fine particle flotation", Can. J. Chem. Eng., 53, 481-6.
C ollection efficiency, E
1 Snowtex ZL Snowtex 20L model, -30 mV
0.1
Nyasil 20 model, -50 mV
0.01
0.001
0.0001 10
100 1000 Particle diameter (nm)
10000
Figure 6: Comparison between model and experimental data for collection efficiency versus particle diameter. The numerical constants used in the calculation were the same as Figure 5, except for K2 = -20mN/m in the simulation with -30mV for the bubble zeta potential. CONCLUSION A computational model has been developed for predicting the collection efficiency of nano and submicron particles. The model included viscous interactions, Brownian diffusion, colloidal forces and microhydrodynamics of particles in the vicinity of a slip surface of rising air bubbles that come into effect at small separation distances with the formation of thin liquid films. A finite difference scheme with mesh refinement in the vicinity of the air bubble surface was used to discretise the stiff partial differential equation for the particle concentration. The mesh refinement produced stable numerical solutions without oscillation in the particle concentration, which otherwise occurred due to the stiffness of the differential equation and coarseness of the numerical mesh. Predictions from the model were compared with experimental results, from the flotation of silica particles ranging in diameter from 40 nm to 3 μm, using 150 µm bubbles. Both the theoretical and experimental results
6