3.2 Solution for a damped pendulum using the Euler-Cromer method. ....................
........ ... 5.1 Solution of Laplace's equation using the Jacobi relaxation method.
Computational Physics using MATLAB®
Kevin Berwick
Page 1
Table of Contents Preface........................................................................................................................................ 6 1. Uranium Decay....................................................................................................................... 7 3. The Pendulum ........................................................................................................................ 9 3.1 Solution using the Euler method ...................................................................................... 9 3.1.1 Solution using the Euler-Cromer method.................................................................... 10 3.1.2 Simple Harmonic motion example using a variety of numerical approaches ............. 11 3.2 Solution for a damped pendulum using the Euler-Cromer method. ............................ 16 3.3 Solution for a non-linear, damped, driven pendulum :- the Physical pendulum, using the Euler-Cromer method. ................................................................................................... 18 3.4 Bifurcation diagram for the pendulum ......................................................................... 24 3.6 The Lorenz Model .......................................................................................................... 26 4. The Solar System .................................................................................................................28 4.1 Kepler’s Laws ..................................................................................................................28 4.1.1 Ex 4.1 Planetary motion results using different time steps .........................................30 4.2 Orbits using different force laws .................................................................................... 35 4.3 Precession of the perihelion of Mercury. .................................................................... 40 4.4 The three body problem and the effect of Jupiter on Earth ..........................................48 4.6 Chaotic tumbling of Hyperion....................................................................................... 53 5. Potentials and Fields ........................................................................................................... 60 5.1 Solution of Laplace’s equation using the Jacobi relaxation method. ........................... 60 5.1.1 Solution of Laplace’s equation for a hollow metallic prism with a solid, metallic inner conductor. ............................................................................................................................ 63 5.1.2 Solution of Laplace’s equation for a finite sized capacitor ........................................ 66 5.1.3 Exercise 5.7 and the Successive Over Relaxation Algorithm....................................... 70 5.2 Potentials and fields near Electric charges, Poisson’s Equation .................................... 75 6. Waves ................................................................................................................................... 78 6.1 Waves on a string ........................................................................................................... 78 6.1.1 Waves on a string with free ends ................................................................................. 81 6.2 Frequency spectrum of waves on a string .....................................................................83 7. Random Systems .................................................................................................................. 87 7.1 Random walk simulation ................................................................................................ 87 7.1.1 Random walk simulation with random path lengths. ..................................................89 10. Quantum Mechanics .......................................................................................................... 91 10.2 Time independent Schrodinger equation. Shooting method. ...................................... 91 Kevin Berwick
Page 2
10.5 Wavepacket construction ............................................................................................. 93 10.3 Time Dependent Schrodinger equation in One dimension. Leapfrog method. ........... 95 10.4 Time Dependent Schrodinger equation in two dimensions. Leapfrog method. .......... 99
Kevin Berwick
Page 3
Table of Figures Figure 1. Uranium decay as a function of time .........................................................................8 Figure 2. Simple Pendulum - Euler Method .............................................................................. 9 Figure 3. Simple Pendulum: Euler - Cromer method.............................................................. 10 Figure 4. Simple pendulum solution using Euler, Euler Cromer, Runge Kutta and Matlab ODE45 solver. .......................................................................................................................... 15 Figure 5. The damped pendulum using the Euler-Cromer method ........................................ 17 Figure 6. Results from Physical pendulum, using the Euler-Cromer method, F_drive =0.5 19 Figure 7.Results from Physical pendulum, using the Euler-Cromer method, F_drive =1.2 ..20 Figure 8. Results from Physical pendulum, using the Euler-Cromer method, F_drive =0.5 21 Figure 9. Results from Physical pendulum, using the Euler-Cromer method, F_Drive=1.2 . 21 Figure 10. Increase resolution with npoints=15000.Results from Physical pendulum, using the Euler-Cromer method, F_Drive=1.2 ................................................................................. 22 Figure 11. Poincare section (Strange attractor) Omega as a function of theta. F_Drive =1.2 . 23 Figure 12. Bifurcation diagram for the pendulum ................................................................... 25 Figure 13. Variation of z as a function of time and corresponding strange attractor .............. 27 Figure 14. Simulation of Earth orbit around the Sun .............................................................. 29 Figure 15. Simulation of Earth orbit with time step of 0.05 .................................................... 31 Figure 16. Simulation of Earth orbit, initial y velocity of 4, time step is 0.002. ..................... 32 Figure 17.Simulation of Earth orbit, initial y velocity of 4, time step is 0.05 ......................... 33 Figure 18. Simulation of Earth orbit, initial y velocity of 8, time step is 0.002. 2500 points and Runge Kutta method ......................................................................................................... 33 Figure 19.Plot for an initial y velocity of 8, dt is 0.05, npoints=2500. The Runge Kutta Method is used here ................................................................................................................. 35 Figure 20. Orbit for a force law with β=2. The time step is 0.001 years. ................................ 37 Figure 21. Orbit for a force law with β=2.5. The time step is 0.001 years. .............................. 39 Figure 22. Orbit for a force law with β=3. .............................................................................. 40 Figure 23. Orbit orientation as a function of time ................................................................... 45 Figure 24. Calculated precession rate of Mercury ................................................................... 47 Figure 25. Simulation of solar system containing Jupiter and Earth ....................................50 Figure 26. Simulation of solar system containing Jupiter and Earth. Jupiter mass is 10 X actual value. ............................................................................................................................. 51 Figure 27.Simulation of solar system containing Jupiter and Earth. Jupiter mass is 1000 X actual value, ignoring perturbation of the Sun. ....................................................................... 52 Figure 28.Motion of Hyperion. The initial velocity in the y direction was 1 HU/Hyperion year. This gave a circular orbit. Note from the results that the tumbling is not chaotic under these conditions. ...................................................................................................................... 56 Figure 29.Motion of Hyperion. The initial velocity in the y direction was 5 HU/Hyperion year. This gave a circular orbit. Note from the results that the tumbling is chaotic under these conditions. ............................................................................................................................... 59 Figure 30. Equipotential surface for geometry depicted in Figure 5.2 in the book ................ 62 Figure 31.Equipotential surface for hollow metallic prism with a solid metallic inner conductor held at V=1. ............................................................................................................. 66 Kevin Berwick
Page 4
Figure 32.Equipotential surface for a finite sized capacitor. ................................................... 69 Figure 33. Equipotential contours near a finite sized capacitor. ............................................. 69 Figure 34.Equipotential surface in region of a simple capacitor as calculated using the SOR code for a 60 X 60 grid. The convergence criterion was that the simulation was halted when the difference in successively calculated surfaces was less than 10-5 per site.......................... 73 Figure 35.Number of iterations required for Jacobi method vs L for a simple capacitor. The convergence criterion was that the simulation was halted when the difference in successively calculated surfaces was less than 10-5 per site. ........................................................................ 74 Figure 36.Number of iterations required for SOR method vs L for a simple capacitor. The convergence criterion was that the simulation was halted when the difference in successively calculated surfaces was less than 10-5 per site. ........................................................................ 74 Figure 37. Equipotential surface near a point charge at the center of a 20X20 metal box. The Jacobi relaxation method was used . The plot on the right compares the numerical and analytical (as obtained from Coulomb’s Law). ........................................................................ 77 Figure 38. Waves propagating on a string with fixed ends ..................................................... 79 Figure 39. Signal from a vibrating string and Power spectrum. Signal excited with Gaussian pluck centred at the middle of the string and the displacement 5% from the end of the string was recorded. ...........................................................................................................................86 Figure 40. x^2 as a function of step number. Step length = 1. Average of 500 walks. Also shown is a linear fit to the data. .............................................................................................. 88 Figure 41. x^2 as a function of step number. Step length = random value betwen +/-1. Average of 500 walks. Also shown is a linear fit to the data................................................... 90 Figure 42. Calculated wavefunction using the shooting method. The wall(s) of the box are at x=(-)1. The value of Vo used was 1000 giving ground-state energy of 1.23. Analytical value is 1.233. Wavefunctions are not normalised. .............................................................................. 93 Figure 43. Composition of wavepacket. ko = 500, x0=0.4, sigma^2=0.001. ......................... 94 Figure 44. Wavepacket reflection from potential cliff at x=0.6. The potential was V=0 for x0.6. Values used for initial wavepacket were x_0=0.4,C=10, sigma_squared=1e-3, k_0=500. Simulation used delta_x=1e-3, delta_t=5e-8. Time progresses left to right. ............................................................................................................98 Figure 45. Wavepacket reflection from potential wall at x=0.6. The potential was V=0 for x0.6. Values used for initial wavepacket were x_0=0.4,C=10, sigma_squared=1e-3, k_0=500. Simulation used delta_x=1e-3, delta_t=5e-8. Time progresses left to right. ............................................................................................................98 Figure 46.Wavepacket reflection from potential cliff at x=0.5. The potential was V=0 for x0.5. Values used for initial wavepacket were x_0=0.25, y_0=0.5,C=10, sigma_squared=0.01, k_0=40. Simulation used delta_x=0.005, delta_t=0.00001. ................................................................................................................... 102 Figure 47. Wavepacket reflection from potential wall at x=0.5. The potential was V=0 for x0.5. Values used for initial wavepacket were x_0=0.25, y_0=0.5,C=10, sigma_squared=0.01, k_0=40. Simulation used delta_x=0.005, delta_t=0.00001. ................................................................................................................... 103
Kevin Berwick
Page 5
Preface I came across the book, ‘Computational Physics’, in the library here in the Dublin Institute of Technology in early 2012. Although I was only looking for one, quite specific piece of information, I had a quick look at the Contents page and decided it was worth a more detailed examination. I hadn’t looked at using numerical methods since leaving College almost a quarter century ago. I cannot remember much attention being paid to the fact that this stuff was meant to be done on a computer, presumably since desktop computers were still a bit of a novelty back then. And while all the usual methods, Euler, Runge-Kutta and others were covered, we didn’t cover applications in much depth at all. It is very difficult to anticipate what will trigger an individual’s intellectual curiosity but this book certainly gripped me. The applications were particularly well chosen and interesting. Since then, I have been working through the exercises intermittently for my own interest and have documented my efforts in this book, still a work in progress. Coincidentally, I had started to use MATLAB® for teaching several other subjects around this time. MATLAB® allows you to develop mathematical models quickly, using powerful language constructs, and is used in almost every Engineering School on Earth. MATLAB® has a particular strength in data visualisation, making it ideal for use for implementing the algorithms in this book. The Dublin Institute of Technology has existing links with Purdue University since, together with UPC Barcelona, it offers a joint Master's Degree with Purdue in Sustainability, Technology and Innovation via the Atlantis Programme. I travelled to Purdue for two weeks in Autumn 2012 to accelerate the completion of this personal project. I would like to thank a number of people who assisted in the production of this book. The authors of ‘Computational Physics’, Nick Giordano and Hisao Nakanishi from the Department of Physics at Purdue must be first on the list. I would like to thank both of them sincerely for their interest, hospitality and many useful discussions while I was at Purdue. They provided lot of useful advice on the physics, and their enthusiasm for the project when initially proposed was very encouraging. I would like to thank the School of Electronics and Communications Engineering at the Dublin Institute of Technology for affording me the opportunity to write this book. I would also like to thank the U.S. Department of Education and the European Commission's Directorate General for Education and Culture for funding the Atlantis Programme, and a particular thanks to Gareth O’ Donnell from the DIT for cultivating this link. Suggestions for improvements, error reports and additions to the book are always welcome and can be sent to me at
[email protected]. Any errors are, of course, my fault entirely. Finally, I would like to thank my family, who tolerated my absence when, largely self imposed, deadlines loomed.
Kevin Berwick West Lafayette, Indiana, USA, September 2012 Kevin Berwick
Page 6
1. Uranium Decay % % % % %
1D radioactive decay by Kevin Berwick, based on 'Computational Physics' book by N Giordano and H Nakanishi Section 1.2 p2
% Solve the Equation
dN/dt = -N/tau
N_uranium_initial = 1000; %initial number of uranium atoms npoints = 100; %Discretize time into 100 intervals dt = 1e7; % time step in years tau=4.4e9; % mean lifetime of 238 U N_uranium = zeros(npoints,1); % initializes N_uranium, a vector of dimension npoints X 1,to being all zeros time = zeros(npoints,1); % this initializes the vector time to being all zeros N_uranium(1) = N_uranium_initial; % the initial condition, first entry in the vector N_uranium is N_uranium_initial time(1) = 0; %Initialise time for step=1:npoints-1 % loop over the timesteps and calculate the numerical solution N_uranium(step+1) = N_uranium(step) - (N_uranium(step)/tau)*dt; time(step+1) = time(step) + dt; end % For comparison , calculate analytical solution t=0:1e8:10e9; N_analytical=N_uranium_initial*exp(-t/tau); % Plot both numerical and analytical solution plot(time,N_uranium,'r',t,N_analytical,'b'); %plots the numerical solution in red and the analytical solution in blue xlabel('Time in years') ylabel('Number of atoms')
Kevin Berwick
Page 7
1000 900 800
Number of atoms
700 600 500 400 300 200 100
0
1
2
3
4 5 6 Time in years
7
8
9
10 9
x 10
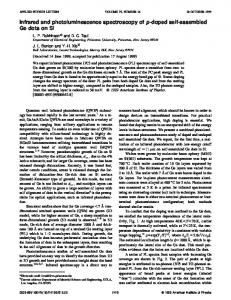
Figure 1. Uranium decay as a function of time
Note that the analytical and numerical solution are coincident in this diagram. It uses real data on Uranium and so the scales are slightly different than those used in the book.
Kevin Berwick
Page 8
3. The Pendulum 3.1 Solution using the Euler method
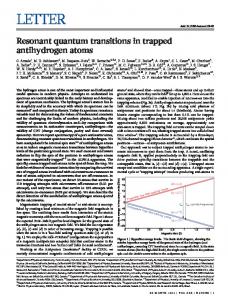
Here is the code for the numerical solution of the equations of motion for a simple pendulum using the Euler method. Note the oscillations grow with time. !! % % % % % %
Euler calculation of motion of simple pendulum by Kevin Berwick, based on 'Computational Physics' book by N Giordano and H Nakanishi, section 3.1
clear; length= 1; %pendulum length in metres g=9.8 % acceleration due to gravity npoints = 250; %Discretize time into 250 intervals dt = 0.04; % time step in seconds omega = zeros(npoints,1); % initializes omega, a vector of dimension npoints X 1,to being all zeros theta = zeros(npoints,1); % initializes theta, a vector of dimension npoints X 1,to being all zeros time = zeros(npoints,1); % this initializes the vector time to being all zeros theta(1)=0.2; % you need to have some initial displacement, otherwise the pendulum will not swing for step = 1:npoints-1 % loop over the timesteps omega(step+1) = omega(step) - (g/length)*theta(step)*dt; theta(step+1) = theta(step)+omega(step)*dt time(step+1) = time(step) + dt; end plot(time,theta,'r' ); %plots the numerical solution in red xlabel('time (seconds) '); ylabel('theta (radians)');
1.5
1
theta (radians)
0.5
0
-0.5
-1
-1.5
0
1
2
3
4 5 6 time (seconds)
7
8
9
10
Figure 2. Simple Pendulum - Euler Method
Kevin Berwick
Page 9
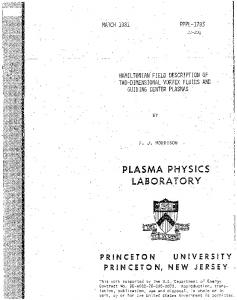
3.1.1 Solution using the Euler-Cromer method.
This problem with growing oscillations is addressed by performing the solution using the Euler - Cromer method. The code is below % % % % % %
Euler_cromer calculation of motion of simple pendulum by Kevin Berwick, based on 'Computational Physics' book by N Giordano and H Nakanishi, section 3.1
clear; length= 1; %pendulum length in metres g=9.8; % acceleration due to gravity npoints = 250; %Discretize time into 250 intervals dt = 0.04; % time step in seconds omega = zeros(npoints,1); % initializes omega, a vector of dimension npoints X 1,to being all zeros theta = zeros(npoints,1); % initializes theta, a vector of dimension npoints X 1,to being all zeros time = zeros(npoints,1); % this initializes the vector time to being all zeros theta(1)=0.2; % you need to have some initial displacement, otherwise the pendulum will not swing for step = 1:npoints-1 % loop over the timesteps omega(step+1) = omega(step) - (g/length)*theta(step)*dt; theta(step+1) = theta(step)+omega(step+1)*dt; %note that % this line is the only change between % this program and the standard Euler method time(step+1) = time(step) + dt; end; plot(time,theta,'r' ); %plots the numerical solution in red xlabel('time (seconds) '); ylabel('theta (radians)');
0.25 0.2 0.15
theta (radians)
0.1 0.05 0 -0.05 -0.1 -0.15 -0.2 -0.25
0
1
2
3
4 5 6 time (seconds)
7
8
9
10
Figure 3. Simple Pendulum: Euler - Cromer method
Kevin Berwick
Page 10
3.1.2 Simple Harmonic motion example using a variety of numerical approaches
In this example I use a variety of approaches in order to solve the following, very simple, equation of motion. It is based on Equation 3.9, with k and α =1.
I take 4 approaches to solving the equation, illustrating the use of the Euler, Euler Cromer, Second order Runge-Kutta and finally the built in MATLAB® solver ODE23. The solution using the built in MATLAB® solver ODE23 is somewhat less straightforward than those using the other techniques. A discussion of the technique follows. The first step is to take the second order ODE equation and split it into 2 first order ODE equations. These are Next you create a MATLAB® function that describes your system of differential equations. You get back a vector of times, T, and a matrix Y that has the values of each variable in your system of equations over the times in the time vector. Each column of Y is a different variable. MATLAB® has a very specific way to define a differential equation, as a function that takes one vector of variables in the differential equation, plus a time vector, as an argument and returns the derivative of that vector. The only way that MATLAB® keeps track of which variable is which inside the vector is the order you choose to use the variables in. You define your differential equations based on that ordering of variables in the vector, you define your initial conditions in the same order, and the columns of your answer are also in that order. In order to do this, you create a state vector y. Let element 1 be the vertical displacement, y1, and element 2 is the velocity,v. Next, we write down the state equations, dy1 and dy2. These are dy1=v; dy2=-y1 Next, we create a vector dy, with 2 elements, dy1 and dy2. Finally we call the MATLAB® ODE solver ODE23. We take the output of the function called my_shm. We perform the calculation for time values range from 0 to 100. The initial velocity is 0, the initial displacement is 10. The code to do this is here [t,y]=ode45(@my_shm,[0,100],[0,10]); Finally, we need to plot the second column of the y matrix, containing the displacement against time. The code to do this is
Kevin Berwick
Page 11
plot(t,y(:,2),'r'); Here is the top level code to do the comparison % % Simple harmonic motion - comparison of Euler, Euler Cromer % and 2nd order Runge Kutta and built in MATLAB Runge Kutta % function ODE45to solve ODEs. % by Kevin Berwick, % based on 'Computational Physics' book by N Giordano and H Nakanishi, % section 3.1 % Equation is d2y/dt2 = -y % Calculate the numerical solution using Euler method in red [time,y] = SHM_Euler (10); subplot(2,2,1); plot(time,y,'r' ); axis([0 100 -100 100]); xlabel('Time'); ylabel('Displacement'); legend ('Euler method'); % Calculate the numerical solution using Euler Cromer method in blue [time,y] = SHM_Euler_Cromer (10); subplot(2,2,2); plot(time,y,'b' ); axis([0 100 -20 20]); xlabel('Time'); ylabel('Displacement'); legend ('Euler Cromer method'); % Calculate the numerical solution using Second order Runge-Kutta method in green [time,y] = SHM_Runge_Kutta (10); subplot(2,2,3); plot(time,y,'g' ); axis([0 100 -20 20]); xlabel('Time'); ylabel('Displacement'); legend ('Runge-Kutta method'); % Use the built in MATLAB ODE45 solver to solve the ODE % The function describing the SHM equations is called my_shm % The time values range from 0 to 100 % The initial velocity is 0, the initial displacement is 10 [t,y]=ode23(@SHM_ODE45_function,[0,100],[0,10]); % We need to plot the second column of the y matrix, containing the % displacement against time in black subplot(2,2,4); plot(t,y(:,2),'k'); axis([0 100 -20 20]); xlabel('Time'); ylabel('Displacement'); legend ('ODE45 Solver');
Kevin Berwick
Page 12
Here are the functions to do the individual calculations % % Simple harmonic motion - Euler method % by Kevin Berwick, % based on 'Computational Physics' book by N Giordano and H Nakanishi, % section 3.1 % Equation is d2y/dt2 = -y function [time,y] = SHM_Euler (initial_displacement); npoints = 2500; dt = 0.04;
%Discretize time into 250 intervals % time step in seconds
v = zeros(npoints,1); % initializes v, a vector of dimension npoints X 1,to being all zeros y = zeros(npoints,1); % initializes y, a vector of dimension npoints X 1,to being all zeros time = zeros(npoints,1); % this initializes the vector time to being all zeros y(1)=initial_displacement; % need some initial displacement % Euler solution for step = 1:npoints-1 % loop over the timesteps v(step+1) = v(step) - y(step)*dt; y(step+1) = y(step)+v(step)*dt; time(step+1) = time(step) + dt; end;
% % Simple harmonic motion - Euler Cromer method % by Kevin Berwick, % based on 'Computational Physics' book by N Giordano and H Nakanishi, % section 3.1 % Equation is d2y/dt2 = -y function [time,y] = SHM_Euler_Cromer (initial_displacement); npoints = 2500; dt = 0.04;
%Discretize time into 250 intervals % time step in seconds
v = zeros(npoints,1); % initializes v, a vector of dimension npoints X 1,to being all zeros y = zeros(npoints,1); % initializes y, a vector of dimension npoints X 1,to being all zeros time = zeros(npoints,1); % this initializes the vector time to being all zeros y(1)=initial_displacement; % need some initial displacement % Euler Cromer solution for step = 1:npoints-1 % loop over the timesteps v(step+1) = v(step) - y(step)*dt; y(step+1) = y(step)+v(step+1)*dt; time(step+1) = time(step) + dt; end;
% % % % %
Simple harmonic motion - Second order Runge Kutta method by Kevin Berwick, based on 'Computational Physics' book by N Giordano and H Nakanishi, section 3.1
Kevin Berwick
Page 13
% Equation is d2y/dt2 = -y function [time,y] = SHM_Runge_Kutta(initial_displacement); % 2nd order Runge Kutta solution npoints = 2500; dt = 0.04;
%Discretize time into 250 intervals % time step in seconds
v = zeros(npoints,1); % initializes v, a vector of dimension npoints X 1,to being all zeros y = zeros(npoints,1); % initializes y, a vector of dimension npoints X 1,to being all zeros time = zeros(npoints,1); % this initializes the vector time to being all zeros y(1)=initial_displacement; % need some initial displacement v = zeros(npoints,1); % initializes v, a vector of dimension npoints X 1,to being all zeros y = zeros(npoints,1); % initializes y, a vector of dimension npoints X 1,to being all zeros v_dash = zeros(npoints,1); % initializes y, a vector of dimension npoints X 1,to being all zeros y_dash = zeros(npoints,1); % initializes y, a vector of dimension npoints X 1,to being all zeros time = zeros(npoints,1); % this initializes the vector time to being all zeros y(1)=10; % need some initial displacement for step = 1:npoints-1
% loop over the timesteps
v_dash=v(step)-0.5*y(step)*dt; y_dash=y(step)+0.5*v(step)*dt; v(step+1) = v(step)-y_dash*dt; y(step+1) = y(step)+v_dash*dt; time(step+1) = time(step)+dt; end;
% % Simple harmonic motion - Built in MATLAB ODE45 method % by Kevin Berwick, % based on 'Computational Physics' book by N Giordano and H Nakanishi, % section 3.1 % Equation is d2y/dt2 = -y function dy = SHM_ODE45_function(t,y); % y is the state vector y1 = y(1); v = y(2);
% y1 is displacement % y2 is velocity
% write down the state equations dy1=v; dy2=-y1; % collect the equations into a column vector, velocity in column 1, % displacement in column 2
Kevin Berwick
Page 14
dy = [dy1;dy2];
100
20 Euler Cromer method
Displacement
Displacement
Euler method 50 0 -50 -100
0
50 Time
10 0 -10 -20
100
20
0
ODE45 Solver
10
Displacement
Displacement
100
20 Runge-Kutta method
0 -10 -20
50 Time
0
50 Time
100
10 0 -10 -20
0
50 Time
100
Figure 4. Simple pendulum solution using Euler, Euler Cromer, Runge Kutta and Matlab ODE45 solver.
Kevin Berwick
Page 15
3.2 Solution for a damped pendulum using the Euler-Cromer method.
This solution uses q=1 % % % % % %
Euler_cromer calculation of motion of simple pendulum with damping by Kevin Berwick, based on 'Computational Physics' book by N Giordano and H Nakanishi, section 3.2
clear; length= 1; g=9.8; q=1; npoints = 250; dt = 0.04;
%pendulum length in metres % acceleration due to gravity % damping strength %Discretize time into 250 intervals % time step in seconds
omega = zeros(npoints,1); % initializes omega, a vector of dimension npoints X 1,to being all zeros theta = zeros(npoints,1); % initializes theta, a vector of dimension npoints X 1,to being all zeros time = zeros(npoints,1); % this initializes the vector time to being all zeros theta(1)=0.2; not swing
% you need to have some initial displacement, otherwise the pendulum will
for step = 1:npoints-1 % loop over the timesteps omega(step+1) = omega(step) - (g/length)*theta(step)*dt-q*omega(step)*dt; theta(step+1) = theta(step)+omega(step+1)*dt; % In the Euler method, , the previous value of omega % and the previous value of theta are used to calculate the new values of omega and theta. % In the Euler Cromer method, the previous value of omega % and the previous value of theta are used to calculate the the new value % of omega. However, the NEW value of omega is used to calculate the new % theta % time(step+1) = time(step) + dt; end; plot(time,theta,'r' ); %plots the numerical solution in red xlabel('time (seconds) '); ylabel('theta (radians)');
Kevin Berwick
Page 16
0.2
0.15
theta (radians)
0.1
0.05
0
-0.05
-0.1
-0.15
0
1
2
3
4 5 6 time (seconds)
7
8
9
10
Figure 5. The damped pendulum using the Euler-Cromer method
Kevin Berwick
Page 17
3.3 Solution for a non-linear, damped, driven pendulum :- the Physical pendulum, using the Euler-Cromer method.
All of the next five plots were produced using the code below with slight modifications in either the input parameters or the plots. % Euler Cromer Solution for non-linear, damped, driven pendulum % by Kevin Berwick, % based on 'Computational Physics' book by N Giordano and H Nakanishi, % section 3.3 % clear; length= 9.8; %pendulum length in metres g=9.8; % acceleration due to gravity q=0.5; F_Drive=1.2; % damping strength Omega_D=2/3; npoints =15000; %Discretize time dt = 0.04; % time step in seconds omega = zeros(npoints,1); % initializes omega, a vector of dimension npoints X 1,to being all zeros theta = zeros(npoints,1); % initializes theta, a vector of dimension npoints X 1,to being all zeros time = zeros(npoints,1); % this initializes the vector time to being all zeros theta(1)=0.2; not swing omega(1)=0;
% you need to have some initial displacement, otherwise the pendulum will
for step = 1:npoints-1; % loop over the timesteps % Note error in book in Equation for Example 3.3 omega(step+1)=omega(step)+(-(g/length)*sin(theta(step))q*omega(step)+F_Drive*sin(Omega_D*time(step)))*dt; temporary_theta_step_plus_1 = theta(step)+omega(step+1)*dt; % We need to adjust theta after each iteration so as to keep it between +/-pi % The pendulum can now swing right around the pivot, corresponding to theta>2*pi. % Theta is an angular variable so values of theta that differ by 2*pi correspond to the same position. % For plotting purposes it is nice to keep (-pi pi) temporary_theta_step_plus_1= temporary_theta_step_plus_1-2*pi; end; % Update theta array theta(step+1)=temporary_theta_step_plus_1; time(step+1) = time(step) + dt; end; % Only plot omega and theta point when omega is in phase with the driving force Omega_D I=find(abs(rem(time, 2*pi/Omega_D)) > 0.02); omega(I)=NaN; theta(I)=NaN; scatter (theta,omega,2 ); %plots the numerical solution plot (theta,omega,'k' ); %plots the numerical solution xlabel('theta (radians)'); ylabel('omega (radians/second)');
1
omega (radians/second)
0.5
0
-0.5
-1
-1.5
-2 -4
-3
-2
-1
0 1 theta (radians)
2
3
4
Figure 11. Poincare section (Strange attractor) Omega as a function of theta. F_Drive =1.2
Kevin Berwick
Page 23
3.4 Bifurcation diagram for the pendulum % % % % %
Program to perform Euler_cromer calculation of motion of physical pendulum by Kevin Berwick, and calculate the bifurcation diagram. You need to have the function 'pendulum_function' available in order to run this. based on 'Computational Physics' book by N Giordano and H Nakanishi, section 3.4.
Omega_D=2/3; for F_Drive_step=1:0.1:13; F_Drive=1.35+F_Drive_step/100; % Calculate the plot of theta as a function of time for the current drive step % using the function :- pendulum_function [time,theta]= pendulum_function(F_Drive, Omega_D); %Filter the results to exclude initial transient of 300 periods, note % that the period is 3*pi. I=find (time< 3*pi*300); time(I)=NaN; theta(I)=NaN; %Further filter the results so that only results in phase with the driving force % F_Drive are displayed. % Replace all those values NOT in phase with NaN Z=find(abs(rem(time, 2*pi/Omega_D)) > 0.01); time(Z)=NaN; theta(Z)=NaN; % Remove all NaN values from the array to reduce dataset size time(isnan(time)) = []; theta(isnan(theta)) = []; % Now plot the results plot(F_Drive,theta,'k'); hold on; axis([1.35 1.5 1 3]); xlabel('F Drive'); ylabel('theta (radians)'); end;
% % % %
Euler_cromer calculation of motion of physical pendulum by Kevin Berwick, based on 'Computational Physics' book by N Giordano and H Nakanishi, section 3.3
function [time,theta] = pendulum_function(F_Drive,Omega_D); length= 9.8; g=9.8; q=0.5; npoints =100000; dt = 0.04;
%pendulum length in metres % acceleration due to gravity % damping strength %Discretize time % time step in seconds
omega = zeros(npoints,1); % initializes omega, a vector of dimension npoints X 1,to being all zeros theta = zeros(npoints,1); % initializes theta, a vector of dimension npoints X 1,to being all zeros
Kevin Berwick
Page 24
time = zeros(npoints,1); % this initializes the vector time to being all zeros theta(1)=0.2; not swing omega(1)=0;
% you need to have some initial displacement, otherwise the pendulum will
for step = 1:npoints-1; % loop over the timesteps omega(step+1)=omega(step)+(-(g/length)*sin(theta(step))q*omega(step)+F_Drive*sin(Omega_D*time(step)))*dt; temporary_theta_step_plus_1 = theta(step)+omega(step+1)*dt; % Make corrections to keep theta between pi and -pi if (temporary_theta_step_plus_1 < -pi) temporary_theta_step_plus_1= temporary_theta_step_plus_1+2*pi; elseif (temporary_theta_step_plus_1 > pi) temporary_theta_step_plus_1= temporary_theta_step_plus_1-2*pi; end; % Update theta array theta(step+1)=temporary_theta_step_plus_1; % Increment time time(step+1) = time(step) + dt; end;
3 2.8 2.6
theta (radians)
2.4 2.2 2 1.8 1.6 1.4 1.2 1 1.35
1.4
1.45
1.5
F Drive
Figure 12. Bifurcation diagram for the pendulum
Kevin Berwick
Page 25
3.6 The Lorenz Model
The equations are the same as those as in 3.29 (
)
The equations I used in the numerical solution are (
)
(
) (
)
% % Euler calculation of Lorenz equations % by Kevin Berwick, % based on 'Computational Physics' book by N Giordano and H Nakanishi, % section 3.6 % clear a=10; b=8/3; r=25; sigma=10; npoints =500000; %Discretize time dt = 0.0001; % time step in seconds x = zeros(npoints,1); % initializes x, a vector of dimension npoints X 1,to being all zeros y = zeros(npoints,1); % initializes y, a vector of dimension npoints X 1,to being all zeros z = zeros(npoints,1); % initializes z, a vector of dimension npoints X 1,to being all zeros time = zeros(npoints,1); % this initializes the vector time to being all zeros x(1)=1; for step = 1:npoints-1 % loop over the timesteps and solve the difference equations x(step+1)=x(step)+sigma*(y(step)-x(step))*dt; y(step+1)=y(step)+(-x(step)*z(step)+r*x(step)-y(step))*dt; z(step+1)=z(step)+(x(step)*y(step)-b*z(step))*dt; % Update time array time(step+1) = time(step) + dt; end; subplot (2,1,1);
Kevin Berwick
Page 26
plot(time,z,'b' ); xlabel('time'); ylabel('z'); subplot (2,1,2); plot (x,z,'g' ); xlabel('x'); ylabel('z')
60
z
40
20
0
0
5
10
15
20
25 time
30
35
40
45
50
60
z
40
20
0 -20
-15
-10
-5
0 x
5
10
15
20
Figure 13. Variation of z as a function of time and corresponding strange attractor
Kevin Berwick
Page 27
4. The Solar System 4.1 Kepler’s Laws % % % % % %
Planetary orbit using Euler Cromer methods. by Kevin Berwick, based on 'Computational Physics' book by N Giordano and H Nakanishi Section 4.1
npoints=500; dt = 0.002; x=1; y=0; v_x=0; v_y=2*pi;
% time step in years % initialise position of planet in AU % initialise velocity of planet in AU/yr
% Plot the Sun at the origin plot(0,0,'oy','MarkerSize',30, 'MarkerFaceColor','yellow'); axis([-1 1 -1 1]); xlabel('x(AU)'); ylabel('y(AU)'); hold on; for step = 1:npoints-1; % loop over the timesteps radius=sqrt(x^2+y^2); % Compute new velocities in the x and y directions v_x_new=v_x - (4*pi^2*x*dt)/(radius^3); v_y_new=v_y - (4*pi^2*y*dt)/(radius^3); % Euler Cromer Step - update positions using newly calculated velocities x_new=x+v_x_new*dt; y_new=y+v_y_new*dt; % Plot planet position immediately plot(x_new,y_new,'-k'); drawnow; % Update x and y velocities with new velocities v_x=v_x_new; v_y=v_y_new; % Update x and y with new positions x=x_new; y=y_new; end;
Kevin Berwick
Page 28
1 0.8 0.6 0.4
y(AU)
0.2 0 -0.2 -0.4 -0.6 -0.8 -1 -1
-0.8
-0.6
-0.4
-0.2
0 x(AU)
0.2
0.4
0.6
0.8
1
Figure 14. Simulation of Earth orbit around the Sun
Here is the code using a second order Runge Kutta method giving the same results. % % % Planetary orbit using second order Runge-Kutta method. % by Kevin Berwick, % based on 'Computational Physics' book by N Giordano and H Nakanishi % Section 4.1 % % npoints=500; dt = 0.002; % time step in years t=0; x=1; % initialise position of planet in AU y=0; v_x=0; % initialise x velocity of planet in AU/yr v_y=2*pi; % initialise y velocity of planet in AU/yr % Plot the Sun at the origin plot(0,0,'oy','MarkerSize',30, 'MarkerFaceColor','yellow'); axis([-1 1 -1 1]); xlabel('x(AU)'); ylabel('y(AU)'); hold on; for step = 1:npoints-1; % loop over the timesteps radius=sqrt(x^2+y^2); % Compute Runge Kutta values for the y equations y_dash=y+0.5*v_y*dt; v_y_dash=v_y - 0.5*(4*pi^2*y*dt)/(radius^3); % update positions and new y velocity
Kevin Berwick
Page 29
y_new=y+v_y_dash*dt; v_y_new=v_y-(4*pi^2*y_dash*dt)/(radius^3); % Compute Runge Kutta values for the x equations x_dash=x+0.5*v_x*dt; v_x_dash=v_x - 0.5*(4*pi^2*x*dt)/(radius^3); % update positions using newly calculated velocity x_new=x+v_x_dash*dt; v_x_new=v_x-(4*pi^2*x_dash*dt)/(radius^3); % Plot planet position immediately plot(x_new,y_new,'-k'); drawnow; % Update x and y velocities with new velocities v_x=v_x_new; v_y=v_y_new; % Update x and y with new positions x=x_new; y=y_new; end;
4.1.1 Ex 4.1 Planetary motion results using different time steps
In Exercise 4.1 we are asked to change the time step to show that for dt > 0.01 years, you get an unsatisfactory result. I chose dt=0.05 and got the Figure below. Clearly the orbit is unstable. This is in accordance with the rule of thumb that the time step should be less than 1% of the characteristic time scale of the problem.
Kevin Berwick
Page 30
2 1.5 1
y(AU)
0.5 0 -0.5 -1 -1.5 -2 -2
-1.5
-1
-0.5
0 x(AU)
0.5
1
1.5
2
Figure 15. Simulation of Earth orbit with time step of 0.05
I also looked at changing the velocity to look at the effect of increasing the value of the initial velocity, while returning the time step to 0.002. Here is the plot, below,
Kevin Berwick
Page 31
with an initial y velocity of 4, dt is 0.002. 0.6
0.4
0.2
y(AU)
0
-0.2
-0.4
-0.6
-0.8 -0.4
-0.2
0
0.2
0.4
0.6
0.8
1
x(AU)
Figure 16. Simulation of Earth orbit, initial y velocity of 4, time step is 0.002.
Here is the plot with the same initial y velocity of 4, but dt is increased to 0.05. Clearly, the instability is apparent.
Kevin Berwick
Page 32
2.5 2 1.5 1
y(AU)
0.5 0 -0.5 -1 -1.5 -2 -2.5 -2.5
-2
-1.5
-1
-0.5
0 x(AU)
0.5
1
1.5
2
2.5
Figure 17.Simulation of Earth orbit, initial y velocity of 4, time step is 0.05
Here is the result for an initial y velocity of 8, dt is 0.002., npoints=2500. The Runge Kutta Method is used here. Note the relative stability of the orbit. 2.5 2 1.5 1
y(AU)
0.5 0 -0.5 -1 -1.5 -2 -2.5 -5
-4
-3
-2
-1
0
1
2
x(AU)
Figure 18. Simulation of Earth orbit, initial y velocity of 8, time step is 0.002. 2500 points and Runge Kutta method
Here is the code and Plot for an initial y velocity of 8, dt is 0.05, npoints=2500. The Runge Kutta Method is used here. Kevin Berwick
Page 33
% % % Planetary orbit using second order Runge-Kutta method. % by Kevin Berwick, % based on 'Computational Physics' book by N Giordano and H Nakanishi % Section 4.1 % % % npoints=500; npoints=2500; dt = 0.05; % time step in years t=0; x=1; y=0; v_x=0; % v_y=2*pi; v_y=8;
% initialise position of planet in AU % initialise x velocity of planet in AU/yr % initialise y velocity of planet in AU/yr % initialise y velocity of planet in AU/yr
% Plot the Sun at the origin plot(0,0,'oy','MarkerSize',30, 'MarkerFaceColor','yellow'); % axis([-1 1 -1 1]); remove in order to see effect of changing time step xlabel('x(AU)'); ylabel('y(AU)'); hold on; for step = 1:npoints-1; % loop over the timesteps radius=sqrt(x^2+y^2); % Compute Runge Kutta values for the y equations y_dash=y+0.5*v_y*dt; v_y_dash=v_y - 0.5*(4*pi^2*y*dt)/(radius^3); % update positions and new y velocity y_new=y+v_y_dash*dt; v_y_new=v_y-(4*pi^2*y_dash*dt)/(radius^3); % Compute Runge Kutta values for the x equations x_dash=x+0.5*v_x*dt; v_x_dash=v_x - 0.5*(4*pi^2*x*dt)/(radius^3); % update positions using newly calculated velocity x_new=x+v_x_dash*dt; v_x_new=v_x-(4*pi^2*x_dash*dt)/(radius^3); % Plot planet position immediately plot(x_new,y_new,'-k'); drawnow; % Update x and y velocities with new velocities v_x=v_x_new; v_y=v_y_new; % Update x and y with new positions x=x_new; y=y_new; end;
Kevin Berwick
Page 34
2.5 2 1.5 1
y(AU)
0.5 0 -0.5 -1 -1.5 -2 -2.5 -3
-2
-1
0 x(AU)
1
2
3
Figure 19.Plot for an initial y velocity of 8, dt is 0.05, npoints=2500. The Runge Kutta Method is used here 4.2 Orbits using different force laws
Here is the code to calculate the elliptical orbit for a force law with β=2. The time step is 0.001 years. % % % % % % % %
Planetary orbit using second order Runge-Kutta method. by Kevin Berwick, based on 'Computational Physics' book by N Giordano and H Nakanishi Section 4.2
npoints=1000; dt = 0.001;
% time step in years
t=0; x=1; % initialise position of planet in AU y=0; v_x=0; % initialise x velocity of planet in AU/yr % v_y=2*pi; % initialise y velocity of planet in AU/yr v_y=5; % initialise y velocity of planet in AU/yr % Plot the Sun at the origin
Kevin Berwick
Page 35
plot(0,0,'oy','MarkerSize',30, 'MarkerFaceColor','yellow'); title('Beta = 2') axis([-1 1 -1 1]); xlabel('x(AU)'); ylabel('y(AU)'); hold on; for step = 1:npoints-1; % loop over the timesteps radius=sqrt(x^2+y^2); % Compute Runge Kutta values for the y equations y_dash=y+0.5*v_y*dt; v_y_dash=v_y - 0.5*(4*pi^2*y*dt)/(radius^3); % update positions and new y velocity y_new=y+v_y_dash*dt; v_y_new=v_y-(4*pi^2*y_dash*dt)/(radius^3); % Compute Runge Kutta values for the x equations x_dash=x+0.5*v_x*dt; v_x_dash=v_x - 0.5*(4*pi^2*x*dt)/(radius^3); % update positions using newly calculated velocity x_new=x+v_x_dash*dt; v_x_new=v_x-(4*pi^2*x_dash*dt)/(radius^3); % Plot planet position immediately plot(x_new,y_new,'-k'); drawnow; % Update x and y velocities with new velocities v_x=v_x_new; v_y=v_y_new; % Update x and y with new positions x=x_new; y=y_new; end;
Kevin Berwick
Page 36
Beta = 2 1 0.8 0.6 0.4
y(AU)
0.2 0 -0.2 -0.4 -0.6 -0.8 -1 -1
-0.8
-0.6
-0.4
-0.2
0 x(AU)
0.2
0.4
0.6
0.8
1
Figure 20. Orbit for a force law with β=2. The time step is 0.001 years.
Here is the code to calculate the elliptical orbit for a force law with β=2.5. The time step is 0.001 years. % % % % % %
Planetary orbit using second order Runge-Kutta method. by Kevin Berwick, based on 'Computational Physics' book by N Giordano and H Nakanishi Section 4.2
npoints=1000; dt = 0.001;
% time step in years
t=0; x=1; % initialise position of planet in AU y=0; v_x=0; % initialise x velocity of planet in AU/yr % v_y=2*pi; % initialise y velocity of planet in AU/yr v_y=5; % initialise y velocity of planet in AU/yr % Plot the Sun at the origin plot(0,0,'oy','MarkerSize',30, 'MarkerFaceColor','yellow'); title('Beta = 2.5') axis([-1 1 -1 1]); xlabel('x(AU)'); ylabel('y(AU)'); hold on; for step = 1:npoints-1;
Kevin Berwick
Page 37
% loop over the timesteps radius=sqrt(x^2+y^2); % Compute Runge Kutta values for the y equations y_dash=y+0.5*v_y*dt; v_y_dash=v_y - 0.5*(4*pi^2*y*dt)/(radius^3.5); % update positions and new y velocity y_new=y+v_y_dash*dt; v_y_new=v_y-(4*pi^2*y_dash*dt)/(radius^3.5); % Compute Runge Kutta values for the x equations x_dash=x+0.5*v_x*dt; v_x_dash=v_x - 0.5*(4*pi^2*x*dt)/(radius^3.5); % update positions using newly calculated velocity x_new=x+v_x_dash*dt; v_x_new=v_x-(4*pi^2*x_dash*dt)/(radius^3.5); % Plot planet position immediately plot(x_new,y_new,'-k'); drawnow; % Update x and y velocities with new velocities v_x=v_x_new; v_y=v_y_new; % Update x and y with new positions x=x_new; y=y_new; end;
Kevin Berwick
Page 38
Beta = 2.5 1 0.8 0.6 0.4
y(AU)
0.2 0 -0.2 -0.4 -0.6 -0.8 -1 -1
-0.8
-0.6
-0.4
-0.2
0 x(AU)
0.2
0.4
0.6
0.8
1
Figure 21. Orbit for a force law with β=2.5. The time step is 0.001 years.
Here is the Figure for β=3. Check out the planet being ejected from the solar system!! The Sun is at the origin
Kevin Berwick
Page 39
Beta =3 10 8 6 4
y(AU)
2 0 -2 -4 -6 -8 -10 -10
-8
-6
-4
-2
0 x(AU)
2
4
6
8
10
Figure 22. Orbit for a force law with β=3. 4.3 Precession of the perihelion of Mercury.
Let’s do the Maths here.
(
)
(
) (
(
) )
(
)
Now, write each 2nd order differential equations as two, first order, differential equations.
Kevin Berwick
Page 40
(
)
(
)
So, the difference equation set using the Euler Cromer method is (
)
(
)
We could go ahead and code this, but what about if we chose to attack the problem using the Runge Kutta method. The relevant equations are
(
)
(
(
)
(
Kevin Berwick
)
)
Page 41
In the case of the y equations for example, y’ and v’ is evaluated by the Euler method at . Then to get the new values of y and v, we simply use the Euler method but using y’ and v’ in the equations. So, here is the code for an alpha value of 0.0008
Kevin Berwick
Page 42
% % % % % % % %
Precession of mercury using second order Runge-Kutta method. by Kevin Berwick, based on 'Computational Physics' book by N Giordano and H Nakanishi Section 4.3
npoints=30000; dt = 0.0001; % time step in years time = zeros(npoints,1); % initializes time, a vector of dimension npoints X 1,to being all zeros angleInDegrees = zeros(npoints,1); % initializes angleInDegrees, a vector of dimension npoints X 1,to being all zeros x=0.47; % initialise x position of planet in AU y=0; % initialise x position of planet in AU v_x=0; % initialise x velocity of planet in AU/yr v_y=8.2; % initialise y velocity of planet in AU/yr alpha=0.0008; for step = 1:npoints-1;
% loop over the timesteps
time(step+1) = time(step) + dt; radius=sqrt(x^2+y^2);
% Increment total elapsed time
% Calculate radius
relativity_factor=1+alpha/radius^2; % Compute Runge Kutta values for the y equations y_dash=y+0.5*v_y*dt; v_y_dash=v_y - 0.5*(4*pi^2*y*dt)*relativity_factor/(radius^3); % Update positions and new y velocity y_new=y+v_y_dash*dt; v_y_new=v_y-(4*pi^2*y_dash*dt)*relativity_factor/(radius^3); % Compute Runge Kutta values for the x equations x_dash=x+0.5*v_x*dt; v_x_dash=v_x - 0.5*(4*pi^2*x*dt)*relativity_factor/(radius^3); % Update positions using newly calculated velocity x_new=x+v_x_dash*dt; v_x_new=v_x-(4*pi^2*x_dash*dt)*relativity_factor/(radius^3); % Update x and y velocities with new velocities v_x=v_x_new; v_y=v_y_new; % Identify semi-major axes in the planetary orbit and draw them on the % plot. I need to monitor the time derivative of the radius and identify when it % changes from positive to negative. Then calculate the angle made % by the vector joining the origin and this point with the x axis. new_radius=sqrt(x_new^2+y_new^2); time_derivative=(new_radius-radius)/dt;
Kevin Berwick
Page 43
% Update x and y with new positions x=x_new; y=y_new; if abs(time_derivative)