Jun 24, 2012 - 2 n-lines possible network topologies ... 4. 5. 6. D e gree of E n dpooin ts. Switched Periods. 0. 5. 10.
Clayton Barrows Ph.D. Candidate – Energy Management & Policy John & Willie Leone Department of Energy & Mineral Engineering Pennsylvania State University
Dr. Seth Blumsack – Penn State Dr. Russell Bent – LANL D-4
Computationally Efficient Transmission Switching: Solution Space Reduction
[email protected] 1 6/24/2012
Optimal Power Flow (DC Model) Total Generation Cost
Voltage Angle Limits Generator Limits Line Flow Limits
Power Balance Linearized DC Power Flow
2 8/22/2011
Optimal Transmission Switching Total Generation Cost
Voltage Angle Limits Generator Limits Line Flow Limits
Power Balance Linearized DC Power Flow Line State
[email protected] 3 6/24/2012
OTS on Test Networks • Optimal Transmission Switching MIP – Integer variables representing line status • 2 n-lines possible network topologies
– IEEE 118- Bus Model E. Fisher et al. • 22% Savings (7 lines switched)
– IEEE RTS 96 Model (73 Busses) K. Hedman et al. • 3.7% Savings over 24 x 1hr periods • Computation time: Over 20 hours per period
• Marginal Transmission Switching in the RTS-96 – Savings are due to switching a relatively small number of lines – The effects of switching a line are somewhat localized
[email protected] 4 6/24/2012
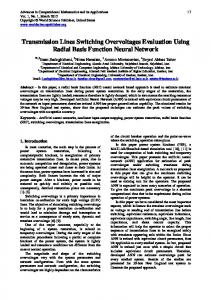
Network Forensics 6 5 4 3
0.4 Ractance (P.U.)
Resistance (P.U.)
0.04
0.02
0
0
2
5 10 15 Switched Periods
0
5
10 Switched Periods
2
15
20
1
0
0.2 0.1
0
5 10 15 Switched Periods
20
0
5 10 15 Switched Periods
20
800
0
5 10 15 Switched Periods
20
Capacity (MW)
1
0.3
0
20
3 Susceptance (P.U.)
Degree of Endpooints
0.06
600 400 200 0
[email protected] 5 6/24/2012
Marginal Switching Analysis
[email protected] 6 6/24/2012
Marginal Switching
[email protected] 7 6/24/2012
Observations • OTS savings are primarily due to the switching actions of a small number of lines a) The lines that contribute most to savings reside in separate areas b) The difference between the sum of Marginal Switching savings and OTS savings is small
The effects of switching a line are somewhat localized
• Problem complexity scales by # of lines considered in optimization (feasible topologies = 2# lines) –
2 Strategies for complexity reduction 1. 2.
Screen for Switchable Lines Network Partitioning
[email protected] 8 6/24/2012
RTS-96 Congestion (Hour 20)
[email protected] 9 6/24/2012
RTS-96 OTS Results (Hour 20)
[email protected]
10 6/24/2012
LODF
[email protected]
11 6/24/2012
∆ABC in the RTS-96: Hour 20
12 8/22/2011
RTS-96 ∆ABC Screen (Hour 20)
[email protected]
13 6/24/2012
RTS-96 Screened OTS Results
[email protected]
14 6/24/2012
RTS-96 ∆ABC Screen (Hour 20)
[email protected]
15 6/24/2012
RTS-96 ∆ABC Screen (Hour 20)
[email protected]
16 6/24/2012
RTS-96 ∆ABC Screen (Hour 20)
[email protected]
17 6/24/2012
RTS-96 ∆ABC Screen (Hour 20)
[email protected]
18 6/24/2012
RTS-96 ∆ABC Screen (Hour 20)
[email protected]
19 6/24/2012
RTS-96 ∆ABC Screen (Hour 20)
[email protected]
20 6/24/2012
RTS-96 ∆ABC Screen (Hour 20)
[email protected]
21 6/24/2012
RTS-96 ∆ABC Screen (Hour 20)
[email protected]
22 6/24/2012
RTS-96 Progressive Screen (Hour 20)
[email protected]
23 6/24/2012
RTS-96 Progressive Screen (Hour 14)
[email protected]
24 6/24/2012
IEEE 118-Bus Network
[email protected]
25 6/24/2012
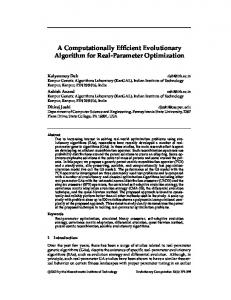
Summary RTS-96 Screen DCOPF
Avg Hourly Total 24hr Solution Savings (Savh > 0) Savings Time 0% 0% 0.76 hr
IEEE 118-BUS (26 SWITCHABLE LINES) Solution Savings Time 0% 0.03 hr
OTS
1.71%
2%
100.93 hr
15.8%*
213 hr*
ΔABC Capacity
2.43% 2.42%
1.98% 1.97%
4.97 hr 216.94 hr
11.3% 2.3%
0.29 hr 2.23 hr
Reactance
0.69%
0.58%
78.5 hr
0.59%
2.58 hr
Centrality
2.21%
1.8%
491.65 hr
2.55%
2.31 hr
Random
1.52%
1.25%
692.22 hr
0.01%
• OTS has large savings potential
*Suboptimal 0.62 hr result
– Problem is too complex to solve quickly 1. Partitioning enables solutions on parallel sub-networks 2. Screening reduces the set of candidate switchable lines and facilitates faster solutions
[email protected]
26 6/24/2012
Ongoing Work •
OTS and Screened OTS application to larger networks • Polish Power Models: ~2000 buses • Eastern Interconnect
•
Network Partitioning – Partition network and apply OTS to distinct sub networks
•
Verify AC power flow feasibility under reconfigured topology
Acknowledgements • This work was supported in part by a student research fellowship provided by LANL and CNLS
References • S. Blumsack, "Network Topologies and Transmission investment Under Electric-Industry Restructuring," PhD Thesis, Carnegie Mellon, 2006. • E. Fisher, R. O'Neill, and M. Ferris, "Optimal Transmission Switching," IEEE Transactions on Power Systems, vol. 23, no. 3, pp. 1346-1355, Aug. 2008 • K. Hedman, M. Ferris, R. O'Neill, E. Fisher, and S. Oren, "Co-Optimization of Generation Unit Commitment and Transmission Switching With N-1 Reliability," IEEE Transactions on Power Systems, vol. 25, no. 2, pp. 1052-1063, May 2010.
[email protected]
27 6/24/2012