Aug 10, 1996 - are as follows: (1) The entire solution path is obtained simultaneously by taking a small number of Newton steps, using analytic derivatives, ...
Computationally E�cient Solution and Maximum Likelihood Estimation of Nonlinear Rational Expectations Models by Je�rey C. Fuhrer and C. Hoyt Bleakley� August 10, 1996
Preliminary. Comments Welcome. Abstract
This paper presents new, computationally e�cient algorithms for solution and estimation of nonlinear dynamic rational expectations models. The innovations in the algorithms are as follows: (1) The entire solution path is obtained simultaneously by taking a small number of Newton steps, using analytic derivatives, over the entire path; (2) The terminal conditions for the solution path are derived from the uniqueness and stability conditions from the linearization of the model around the terminus of the solution path; (3) Unit roots are allowed in the model; (4) Very general models with expectational identities and singularities of the type handled by the King-Watson (1995a,b) linear algorithms are also allowed; and (5) Rank-de cient covariance matrices that arise owing to the presence of expectational identities are admissible. Reasonably complex models are solved in less than a second on a Sun Sparc20. This speed improvement makes derivative-based estimation methods feasible. Algorithms for maximum likelihood estimation and sample estimation problems are presented. (JEL E52, E43) � Vice President and Research Assistant, respectively, Research Department, Federal
Reserve Bank of Boston, Boston, MA, 02106. The views expressed in this paper are the authors' and do not necessarily re ect those of the Federal Reserve Bank of Boston or the Board of Governors of the Federal Reserve System. Please do not quote without permission of the authors.
For a variety of reasons, nonlinear models for macro- and micro- economics have grown in popularity in recent years. In macroeconomics, the recognition that most linear models cannot capture turning points in business cycles, the inherent nonlinearity in the consumer's budget constraint with time-varying interest rates, the presence of nonlinear adjustment costs in investment, and the nonlinearity of the convex production function all require some accommodation of nonlinearity. Researchers have employed a number of alternate strategies for computing the solutions to nonlinear models. Their approaches may be separated into three broad categories. 1. Linearize or log-linearize the system as in Kydland and Prescott (1982). In this case, one can apply the techniques developed for linear models. 2. Solve a reduced form version of the system by numerical integration and iteration using dynamic programming or the nite-element method, as in Christiano (1990) and McGrattan (1996), respectively. 3. Numerically solve for the model-consistent path of expectations (in the case of certainty equivalence) from an initial guess, as in Fair and Taylor (1983). Linearizing models involves approximations that can be evaluated only for simple, analytically tractable cases. Dynamic programming techniques generally require considerably more computing time, often several orders of magnitude greater than linear methods. This paper presents a method that provides a compromise between these two extremes, in the spirit of Fair and Taylor. The method directly solves the nonlinear functions that make up the model. However, it solves a perfect-foresight version of the functions, and thus does not fully incorporate the stochastic features of the model into the solution technique. The algorithm presented here uses Newton's method to jointly solve for the full time-path of nonlinear equations in the model. It utilizes the sparsity of the system to economize on computations (and storage). The method achieves a computational speed that makes derivative-based estimation methods feasible. The results discussed in section 2.3 suggest that, at least for 1
some canonical nonlinear models, the omission of the stochastic features of the model is of second- or third-order importance in solution accuracy. How good an approximation the perfect-foresight nonlinear method is for other models remains a question for further research; we discuss some methods for improving the accuracy of the approximation. The rest of the paper is organized as follows. Section 1 presents the solution algorithm. In section 2, we apply the solution technique to a nonlinear sticky-price model and also to the stochastic growth model. We also compare our solution of the stochastic growth model with results from dynamic programming. Section 3 describes the maximum likelihood estimation procedure using our method, and includes an example. Section 4 suggests several avenues of future research. Section 5 concludes.
1 The Solution Algorithm In an unpublished paper, Anderson and Moore (1986) sketch a solution algorithm for nonlinear dynamic rational expectations models. This section describes a solution algorithm that is related to the work of Anderson and Moore and to undocumented work by Brian Madigan of the Federal Reserve Board. Consider a nonlinear rational expectations model characterized by the system of equations F (x ; x; E (x)) = � (1) where x is an n-vector of endogenous variables, where dependence of the function on lagged x is summarized in x , where E () denotes the expectation operator, and � is an ne-vector of structural shocks to the system; n is not necessarily equal to ne, although ne cannot exceed the number of observed variables in the system. The solution methods discussed in this paper will be, in essence, perfectforesight solution methods. That is, the structural shocks are linearly sepa1
2
1 The viewpoint date for the expectation operator is considered in detail below. 2 If the number of structural shocks exceeds the number of observable variables, the
Jacobian of transformation will not be full rank.
2
rable from the nonlinear structure of the economy. The estimation methods discussed in the second half of the paper will maintain this assumption. Other than this restriction, however, the form of the nonlinearities admitted by the technique can be quite general. In this regard, the solution method follows the spirit of Fair and Taylor's (1983) work. The solution method seeks a sequence of expectations Et v (xt j ); j = 1; : : : ; T such that, given initial conditions, terminal conditions, and these expectations, the function values for every period in the solution trajectory are zero: F (xt ; E (xt )� jxt ) = 0 8t : Now consider a solution path that extends from periods t to T . For any time period s, the Newton step that determines the change in the solution value of x from iteration k to iteration k + 1 may be written +
+
3
�xk
;s
+1
= Jk F (xk ; s) 1
(2)
where Jk is the Newton Jacobian matrix, i.e. the matrix of partial derivatives of the functions F with respect to the vector of variables x. However, one can solve for the entire time path s = t; : : : T of solution vectors at once by writing the stacked set of Newton equations for iteration k as �Xk = Sk F (Xk ) 1
+1
(3)
where Sk is the Newton-Jacobian matrix for the entire solution path as of iteration k, and Xk is the vector of endogenous variables over the entire solution path. F (Xk ) is likewise the vector of function values for the entire solution path, evaluated at the last value of X . 3 The classical de nition of a Newton step for solving a set of nonlinear equations begins with the rst-order Taylor expansion of the functions F around the vector xk
F (xk ) = F 0 (xk )(xk+1
and then solves for xk+1 by inverting the expansion.
3
xk )
1.1 The Structure of the Sk matrix
De ne the maximum lag in the structural model by � and the maximum lead by �. We will denote by Hjs the matrices that contain the derivatives of the set of equations in F with respect to the variables x at lag or lead j evaluated at time period s. Most of the Sk matrix will be composed of Hjs matrices evaluated at di�erent periods s. The structure of Sk will then be a sparse band-diagonal matrix, with number of bands equal to n(� + � + 1): 2 t H � : : : H t 1 H0t H1t : : : H�t 0 0 : : : 6 Sk = 64 0 H t+1� : : : H t+11 H0t+1 H1t+1 : : : H�t+1 0 : : : ..
. For example, consider the simple set of nonlinear equations
3 77 5
(4)
0 0 0 0 ...
::: 7 : : : 77 : : : 777 : : : 775 ...
yt = xt + (1 )Etxt xt = �xt 2
2 +1
1
1
Then the Hjs matrices for s = t and j = 1; 0; 1 would be "
#
= 00 2 x�t " # 1 0 t H = 0 1 " # 0 2(1 ) x t t H = 0 0
Ht
1
1
0
+1
1
and to form the Sk matrix, they would stack up as in equation 4: 2 1 0 0 2(1 )xt 0 0 66 0 2 xt � 0 1 0 0 0 0 66 0 0 2 xt 1 0 0 2(1 )xt Sk = 66 0 0 66 0 0 0 � 0 1 0 0 4 . . . ... ... ... .. .. .. . . . . . . 1
+1
+2
4
3
1.2 Initial and Terminal Conditions It is convenient to fold the initial and terminal conditions for the solution into the Newton problem. The initial conditions are simply the lagged data [xt � ; : : : ; xt ]. Thus including an n� identity matrix in the upper left corner of Sk will assure that these initial conditions hold exactly throughout the solution iterations. The equations require n� terminal conditions for the � leads that \overhang" the end of the solution trajectory. These conditions are obtained by using the stability conditions for the linearized model to solve out for the leads in terms of previous solution values. The stability conditions come from the method of Anderson and Moore (1985) for linear models. That algorithm computes the solution to a linear rational expectations model of the form � X X Hixt i + HiEt (xt i ) = �t : (5) 1
4
0
i= �
+
+
i=1
The algorithm stores the stability conditions in a matrix Q, which satis es
Qx = 0
(6)
+
where x = [xt � ; : : : ; xt ; xt ; : : : ; xt � ] and Q is a n� by n(� + � ) matrix that solves for [xt ; : : : ; x� ] in terms of [xt � ; : : : ; xt ]. Thus we can write the Newton iteration for the terminal conditions as +
+1
+1
+
5
+1
Q�xk = Qxk : +
+
1
(7)
4 The Newton equation for these conditions is simply I �xt = 0; given starting values
for the initial conditions, they will not change over the iterations. 5 A model linearized about its steady state might no longer tend to that steady state. We therefore modify the linearized model to insure that the linearized terminal conditions imply the correct steady state. To do this, we rst compute the steady state, x�t+i , of the model and compute the Hi matrices. (The stationary variables are set to their steady states and the unit-root variables are set to levels consistent with the stationary variables.) P We then adjust the additive constants in the linearized model such that �i= � Hi x�t+i = 0. This insures that the linearized model will attain the same steady state as the nonlinear model.
5
The Newton step for the full set of nonlinear equations, incorporating initial and terminal conditions, is de ned by 2 66 66 66 66 66 4
Ht 0 : : 0
�
In�� 0 0 0 0 0 : : : H t H t H t : : : H�t 0 H t � : : : H t H t H t : : : H�t : : : : : : : : : : : : : : 0 0 ::: Q 1
+1
0 +1 1
1 +1 0
+1 1
+1
0 0 0 : :
::: ::: ::: : :
2 66 3 666 77 666 77 66 77 66 77 66 77 66 5 66 66 66 4
�xt � ... �xt �xt �xt ... �xT �xT ... �xT � 1
+1
+1
+
3 77 2 77 6 77 66 77 66 77 66 77 66 77 = 66 77 66 77 66 77 64 77 5
(8)
1.3 Iteration
For initial guesses of the solution vector X , one can compute the function values F (X ), the derivative matrices Hjs that compose the main body of Sk , and the stability conditions Q that determine the initial conditions. Solution of the Newton step equation 8 yields a new value of X . The derivative matrices, stability conditions, and function values are updated, and the process is iterated until numerical convergence is achieved. For most problems, the convergence criterion is that the maximum of the absolute value of the function values not exceed a critical limit. 0
0
6
1.4 Computational E�ciency Considerations Three elements of the solution algorithm provide substantial gains in computational e�ciency: 6 A Newton step might place you outside the domain of the function being solved. In
such cases, we implemented a line-search algorithm along the direction of the Newton step.
6
0 ... 0 F (xt) F (xt ) ... F (xT ) Qx +1
+
3 77 77 77 77 77 : 77 77 77 5
1. The derivative matrices Hjs are computed analytically, rather than numerically, so that fast functions can be called to evaluate them at each solution iterate, rather than computing them numerically at each iterate; 2. The algorithm keeps track of time-varying and constant elements of the derivative matrices, evaluating only the time-dependent elements at each iteration; 3. The sparsity of the Sk matrix is taken into account, so that the speed of solution of the sparse linear Newton equation is improved by orders of magnitude. The last improvement alone increases the speed for each iteration by more than two orders of magnitude for a model with 10 equations and solution path of length 50. 7
2 Examples and Benchmarking In this section, we apply the solution technique to two models with nonlinear structure. The rst model, discussed in 2.1, contains a nonlinear term structure equation and a boundary at zero on the nominal interest rate in the monetary policy reaction function. Next, in 2.2, we present two stochastic growth models which are substantially \more" non-linear. When evaluating the e�ect of a single shock and using the steady state as the initial solution path, these models solve very quickly (in under one second) on a Sun Sparc20. 7 We have coded the nonlinear solution algorithm in Matlab. In addition, we have
developed a modeling language in which one can express a general nonlinear rational expectations model. Our software parses the model, takes analytic derivatives of the model equations, and writes out Matlab functions that evaluate the derivatives and equation residuals. We have also developed software for likelihood function evaluation and maximum likelihood estimation (described later), which we link to one of Matlab's optimizers to nd the maximum of the constrained likelihood.
7
In all cases, we de ne the convergence criterion to be as above, i.e. max(abs(F )) � tol, and a convergence tolerance of 1 � 10 ensures that we nd very near-zeros of all the functions. 6
2.1 A Nonlinear Sticky-Price Model
We use a simple sticky-price macro model to illustrate the solution algorithm. The model is nearly identical to the model used in Fuhrer and Madigan (1994), and for a full description, the reader is referred to that paper. The two equations with nonlinearities include the real term structure equation that equates the ex ante holding period return to a real consol bond paying real interest rate �t to the real holding period return on a short-term bond, which is just the nominal coupon it less expected in ation �t �t � 1 [�t �t ] = it �t ; (9) t where �t is the backward rst di�erence of the log price level. A conventional linear approximation to this equation is the constant-duration approximation that reduces equation 9 to a rst-order linear equation. The (economically) more important nonlinearity arises in the equation that de nes the policy response of the federal funds rate to deviations of the monetary authority's ultimate goal variables from their targets. A simple way of imposing a non-negativity constraint on the nominal interest rate is to write the policy reaction function as +1
+1
+1
+1
log(it) log(it ) = �� (�t �� ) + �y (yt y�) + �it : 1
(10)
The remaining equations, summarized below, are linear and describe the behavior of sticky prices (due to contracting), aggregate demand, and potential output.
y~t = �y1 y~t + �y2 y~t pt =
X 3
i=0
1
fixt
2
�� (�t
1
i
8
��) + �yt
(11)
vt = xt pt = =
3 X
i=0
3 X
i=0
3 X
i=1
fi(xt
pt i)
i
fiEt (vt i + y~t i) + �xt +
i(xt
i
+
pt i) +
3 X
i=1
iEt (xt
pt i) + �
i
+
+
3 X
i=0
fiEt (~yt i) + �xt +
The rst equation de nes the aggregate demand curve, which makes the output gap y~t a function of two of its own lags and of the lagged long-term real interest rate. The second equation de nes the price index pt as the weighted sum of current and past contract prices xt i , where the weight on contract prices previously negotiated and still in e�ect is denoted fi, and fi = :25 + (1:5 i) s; 0 < s � 1=6; i = 0; : : : ; 3. The third de nes the real contract price index vt as a weighted average of current and past real contract prices. The last two equations express the fundamental contracting equation of the model presented in Fuhrer and Moore (1995b). The convoluted weights i and � in the last two equations are de ned as
i =
3 X
j =0 1
fP j fi
j
+
3 =0
j
� = 1 P f j j 3 =0
fj
2
(12)
2
The number of equations for this model is 7, the maximum lag is 3, and the maximum lead is 3. The model has a well-de ned steady state characterized by in ation at its target (� = ��), output equal to potential, real rates at their long-run equilibrium, and nominal rates obeying the Fisher identity. To solve this model, we set the initial conditions to a 4 percent in ation steady state. The symbolic derivatives of the model equations with respect 8
8 Note that the variables that de ne the price index and the contract price have unit
roots; the steady-state initial conditions have all of these nominal levels growing at the in ation rate.
9
to the endogenous variables are computed, and functions are written to compute the time-varying and non-time-varying derivatives given the current values of the endogenous variables and the parameters. The steady-state in ation parameter in the model is set to 0, so that the simulation will depict the e�ects of an unanticipated disin ation from 4 to 0 percent. For this simulation, we assign the remaining parameters of the model as follows: 9
Parameter Value IS Curve �y1 1.25 �y2 -.42 �� .3 �� .03 Reaction Function �� 1 �y 1.5 Contracting s .08
.005 The initial solution path is computed from the model linearized about the new steady-state values. For a solution horizon of 50 periods, the solution converges in three Newton steps, taking a total of 1:1 seconds. Figure 1 displays the solution trajectories for the disin ation simulation. As the gure illustrates, the variables are quite near their new steady-state values at the end of the solution trajectory, so the rst-order approximation to the model at that point should be good, and the stability conditions that pin down the terminal conditions should be quite accurate for the model.
2.2 Two Stochastic Growth Models
The rst growth model that we examine is the simple single-input stochastic growth model studied in Taylor and Uhlig (1990). The concave production 9 The Maple kernel, called from Matlab, performs these symbolic operations.
10
function f employs end-of-period capital, kt , augmented by the technology level, zt , to produce current output, yt: 1
yt � f (kt ; zt) = zt kt� : (13) The log of the technology is assumed to be rst-order autoregressive ln(zt ) = � ln(zt ) + "t : (14) Current-period utility is isoelastic, ut = ct =(1 ), and total utility is time-separable and discounted at a rate :
1 X c t t Ut = 1 : (15) t Total income comprises the sum of consumption and net investment, yielding the familiar identity yt = ct + kt (1 �) kt : (16) By taking the derivative of the utility function with respect to kt , we derive the also-familiar rst-order condition: Uct = Uct+1 (fk;t + 1 �) : When � is less than one in absolute value, the model implies a stationary steady state for the two state variables kt and zt . Evaluating equations 14, 13, and 16 in the steady state, we obtain steady-state solutions for the technology shock, capital, and consumption: z� = 1 ; ! �1 1 1 = (1 � ) � k = ; � z� c� = z� k�� �k� : To compute a solution path for the model, we set the parameters as shown in the table below, shock the technology by 10 percent, and use the steady state for the model as the initial solution path. We compute a 50-period solution path for the model. 1
1
1
1
1
=0
1
+1
11
Parameter � � � Value 0.99 0.33 0.5 0.1 0.9 The solution path converges in 3 Newton steps with the largest function deviation 1:8 � 10 in 0.17 seconds. The solution paths for capital, technology, and consumption are displayed in gure 2. The second model is the canonical RBC model examined in McCallum (1989). A labor{leisure choice is now included, and utility thus depends on consumption and leisure. The income identity and technology shock evolve as in equations 16 and 14 above. Output is produced according to a two-factor Cobb-Douglas production function: yt � f (kt ; nt; zt ) = zt kt� nt � : (17) Period t utility depends on consumption, ct, and leisure, de ned as 1 nt ; the following Cobb-Douglas utility function is assumed ut = c t (1 nt ) : (18) Taking derivatives, we construct rst-order conditions with respect to capital and labor: uc;t = uc;t (fk;t + 1 �) ; (19) un;t = uc;t fn;t : 11
1
1
1
1
+1
+1
Because we chose Cobb-Douglas functional forms, the rst derivatives of the utility and production functions can be conveniently written: uc;t = (1 c )ut (20) t (1 )ut un;t = (1 nt ) �y t fk;t = k t fn;t = (1 n�)yt t +1
+1
12
Again, for values of � less than one in absolute value, the model implies a stationary steady state. The analytic solutions for the steady-state values of the state variables are z� = 1 (21)
(1 �) n� = 1 � + � � � 1 � 1 1 = (1 � ) � � k = n � 1
( 1) (1 )
We compute a 50-period solution path for the model, setting the parameters in the model as shown in the table below, shocking technology by 10 percent, and using the steady state for the model as the initial solution path. Parameter � � � Value 0.99 0.33 0.5 0.1 0.9 The path converges in 3 Newton steps with a maximum function deviation of 2:2 � 10 in 0:44 seconds. A 20-period solution solves in 3 Newton steps to the same accuracy in 0:18 seconds. The solution paths for capital, labor, technology, and consumption are displayed in gure 3. 10
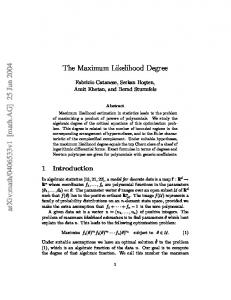
2.3 Comparison with Results from Dynamic Programming We compare our results with similar ones summarized in Taylor and Uhlig (1990) and a simple dynamic programming (DP) exercise. We use as a benchmark the simple stochastic growth model with capital and consumption trade-o� only. This model is presented in detail at the beginning of Section 2.2. Di�erences between our results and the previous work using dynamic programming come from two sources: 1. Dynamic programming methods use a nite-sized grid as an approximation to the state-space, whereas our method works with continuous variables (within machine precision). 13
2. Our method does not account for the e�ect of the distribution of future shocks on today's expectations, whereas dynamic programming explicitly (albeit approximately) incorporates this into the value function iteration. We will address these di�erences each in turn. To test the error introduced by the discretization of the state space, we compare deterministic solution paths generated by both methods, for a large shock to technology. Our solution is as described in section 2.2. Our application of dynamic programming to the stochastic growth model follows Christiano (1990). The standard value function iteration is V (kt ; zt) = fkmax (u(c(kt ; kt; zt)) + Et V (kt ; zt )) ; (22) 3c � g 1
t
t
1
0
+1
where consumption, ct, is implicitly de ned by the budget constraint, and the state-space variables, k and z, are discretized onto a grid. In this exercise the technology level follows a deterministic path and it reverts to its steady state, i.e. ln (zt ) = � ln (zt ) exactly. We take advantage of this property and set the grid for z to be the path followed for 101 periods starting from z = 1:6. The capital grid is set up such that k 2 [3; 30]. The grid is divided into N elements each of spacing 27=N . Therefore, the value function iteration becomes V (kt ; zt ) = fkmax (u(c(kt ; kt; zt )) + V (kt; zt� )) : (23) 3c � g +1
0
1
t
t
1
0
We iterate the value function equation for di�erent values of N until the value function changes less than 10 per iteration. The last period, T , of the path is assumed to be close enough to the steady state that we iterate it upon itself, e.g. V (kT ; zT ) = maxkT (u(cT ) + V (kT ; zT )): 7
Following case 1 in Taylor and Uhlig, the depreciation rate is zero. The parameters and steady state of the model are as follows: Parameter � � � Value 0.95 0.33 0.5 0 0.9 14
The solution of the stochastic growth model using DP is asymptotically equivalent to our method. As the grid becomes ner, the DP solution matches our solution more closely. In gure 4, we display solution paths from our method and two DP exercises: one with a capital grid with N = 100 elements, and another with N = 500 elements. The solution path from DP closely matches the path from our method, when the DP grid has enough elements. This convergence is also illustrated in Table 1, which displays the rootmean-squared di�erence between our solution path and the DP solution for various N . As we make the DP grid ner, the solution path deviates less from our method. Table 1 Root Mean Square Di�erence Between Solution Paths from Dynamic Programming and Nonlinear AIM DP grid size 75 100 200 300 500 RMS Di�. 0.59 0.45 0.21 0.13 0.07 The computation of the deterministic solution path using DP requires hours, whereas our method requires a few tenths of a second. Of course, once the decision rules are computed for a given set of parameters, generating a new solution path is computationally trivial. However, if we are also interested in estimating parameters, recomputing decision rules by value-function iteration becomes very time-consuming. Therefore, for deterministic solution of the stochastic growth model, our method computes the solution path more accurately and in much less time than dynamic programming. We now compare the two solution techniques for a stochastic simulation. Here we expect weaker correspondence because our method does not account for the distribution of future shocks in the formation of expectations. For the stochastic growth model, our method assumes instead that Et (u(ct )) = u(Et(ct )), an assumption which is plainly false for concave +1
+1
15
utility and non-zero shock variance. However, in this case this assumption makes little apparent di�erence for the decision rules. To model the stochastic growth model when it is genuinely stochastic, we make one additional assumption. Recall the equation governing the technology level in this model: ln(zt ) = � ln(zt ) + "t. Following case 2 in Taylor and Uhlig, we simply assume that "t � N (0; �"). This assumption changes nothing about our solution, but changes the way expectations are computed in the value function iteration for DP. In computing the decision rules we use the grid of initial conditions from Taylor and Uhlig: 1
kt
2 f5; 10; 15; 20; 25g zt 2 f:4; :7; 1; 1:3; 1:6g 1
We estimate decision rules from our method by solving for the solution paths for each initial condition. As a benchmark, the dynamic programming results presented by McGrattan (1996) are used. Parameter settings correspond to Taylor and Uhlig's \case 2," i.e. Parameter � � � �" Value 0.95 0.33 1.5 0.1 0.95 .1 It is of note is that �" implies that the technology shock will exceed 10 percent in absolute value about one third of the time. This represents an implausibly large variance for technology. Despite the noisy technology, consumption decision rules from both methods are nearly identical. The computed consumption choice di�ers by less than 1 percent at every point in the grid. Table 2 presents these results. In each case, DP computes decision rules for consumption that are slightly lower than those computed by our method. These results conform to a rough intuition about this simple model. One might expect the optimal consumption path under uncertainty to lie below the path under certainty equivalence due to a precautionary savings motive. As predicted, the decision rules for consumption di�er for this rather noisy technology; however, the di�erences are quite small. 16
Table 2 Decision Rules for Consumption Computed by Dynamic Programming and Our Method
kt
1
5 10 15 20 25 5 10 15 20 25
zt .70 1.00 1.30 1.60 Our Method 0.86 1.12 1.35 1.58 1.79 1.33 1.65 1.94 2.22 2.48 1.73 2.10 2.43 2.74 3.04 2.09 2.50 2.87 3.21 3.53 2.44 2.88 3.27 3.64 3.98 Dynamic Programming 0.86 1.11 1.34 1.57 1.78 1.32 1.64 1.93 2.20 2.46 1.71 2.09 2.41 2.72 3.01 2.08 2.49 2.85 3.19 3.50 2.42 2.86 3.25 3.61 3.95 .40
McGrattan (1996) also presents consumption decision rules computed using the so-called nite-element method (FEM). These consumption decisions correspond to those computed by our method. Figure 5 displays the consumption decision rules computed by both methods. The decision rules for the FEM method lie extremely close to those obtained using our method. Taking these comparisons with two conventional solution methods together, we conclude that our solution method as applied to the standard 10
10 Perhaps of note is that the FEM consumption decisions are not always lower than those
from our method. This is somewhat odd given that the FEM approximation incorporates information about the distribution of future shocks, whereas our method represents the case of certainty equivalence. As noted above, one might therefore expect the FEM solution for consumption to be lower than ours at every point.
17
stochastic growth models is fast (orders of magnitude faster), accurate, and straightforward. Ignoring the e�ect of the distribution of errors on expectations appears to be an acceptable approximation in these cases.
3 Maximum Likelihood Estimation Using our solution method, maximum likelihood estimation for many nonlinear models is now computationally feasible. For this purpose, greater precision is required in the description of the nonlinear equations. Several distinctions are of importance: 1. The expectations viewpoint date is now important; 2. The variables that are not data, i.e. that are de ned by expectational and other identities, must be distinguished from those variables that are data; 3. The equations that are stochastic, i.e. are shocked by a random error term, must be distinguished from those that are not. Thus it will be useful to express one nonlinear equation in the system as f (x ; xD ; xN ; Ek (x )) = � (24) where the vector of current data variables is denoted xD , the vector of notdata variables by xN , the lagged data (initial conditions) are denoted x , and the expectations viewpoint date by the subscript k attached to the expectations operator, Ek . The computation of the likelihood value is detailed in the next subsection. The following subsections describe the constraints imposed upon the likelihood and the procedure for maximizing the likelihood. +
3.1 Evaluating the Likelihood Function Following the standard derivation for simultaneous equations in, for example, Amemiya (1983), we write the likelihood as two components: the (determinant of the) residual covariance matrix, and the Jacobian of transformation 18
from the residuals to the observable variables. Both retrieving the residuals that de ne the covariance matrix and computing the Jacobian of transformation involve the computation of solution paths for the expectations in the model, which is described above. Note that in some earlier linear rational expectations model estimation, notably Sargent (1978), the restricted reduced-form was estimated directly, thus bypassing the need to compute a Jacobian of transformation. In models that include non-trivial identities, this simpli cation is not possible, as the residual variance-covariance matrix for the reduced-form model is not full rank. Here, obtaining a closed-form solution for the reduced-form model is not possible in general. Even in cases where it can be obtained, however, when the model includes identities that render the variance-covariance matrix singular, the \structural" approach must be taken.
3.1.1 Retrieving the structural residuals The t 1-period expectation viewpoint case. The procedure comprises
three steps: (1) Solve for the path of expectations for all the variables in the model, from periods t + 1 to the maximum horizon, given information up to and including period t 1; (2) Given the initial conditions, the period-t data, and the expectations, compute values of the not-data variables that are consistent with the function de nitions; (3) Given initial conditions, expectations, period-t data and period-t not-data variables, compute the residuals of the functions, i.e., �t = f (x ; xDt ; xNt ; xe ) : (25) Step (1) is just the computation of a solution path, as described above, with initial conditions for periods t � to t 1. Step (2) solves the functions for the values of the not-data variables xNt that are consistent with the t period data and the expectations. Step (3) computes the residuals by evaluating the functions at the solved values for xN and xe .
The t period expectation viewpoint case. In the t 1-period view-
point case, the determination of expectations and the determination of notdata variables can be separated into two steps, because the expectations are 19
formed (by de nition) without regard to the t period realizations of the not-data (or the data) variables. In the t period case, this cannot be so. Now expectations must be consistent with data up to and including period t, which must include solutions for the t period not-data variables. As a result, a relatively small modi cation in the algorithm is required. The solutions for the path of expectations and for the not-data variables are computed simultaneously. In practice, for every iteration in the expectations solution step, the not-data variables that are consistent with that step's expectations, lagged data, and current data are recomputed. The process is considered to converge when both expectations and not-data variables have converged.
3.1.2 Computing the Jacobian The Jacobian of transformation from residuals to observables, Jt, is simply @�t : (26) Jt = @x D t We know of no way to compute this Jacobian analytically, so the derivatives are computed numerically, using two-sided nite di�erences to approximate the analytical derivative. Each column of the Jacobian matrix is computed by perturbing one data variable in period t, and recomputing the vector of residuals that arises. In the t 1-period viewpoint case, this simply involves re-solving for the not-data variables and recomputing the residuals, since the expectations are not altered when a t period variable is perturbed. In the t period viewpoint case, the expectations must be recomputed for a perturbed t period data value, and the residuals recomputed, to obtain the derivative estimate. In general, the Jacobian will vary over time, so that the Jacobian must be computed for each period in the sample. In practice, for t period expectations this would increase computation time by a factor equal to twice the number of data variables, since each computation would entail computing the residuals for the covariance matrix and twice again for each derivative required for the Jacobian. As implemented, the algorithm computes the Jacobian at the beginning and end of the sample and averages those estimates. 20
When the Jacobian does not vary too much over the sample, this approximation will do little harm to the precision of the likelihood function. 11
3.2 The Likelihood Function Once both residual covariance matrix and Jacobian are computed, the concentrated log-likelihood is de ned conventionally as $ = T log(kJ k) :5 � log(j j) :
(27)
3.3 Numerical Maximization of the Log-Likelihood
In the discussion above, the dependence of the functions f on the parameters of the model has been suppressed for simplicity. Expressing the likelihood function's dependence on the parameter set , $ = $(x; ) :
(28) The task of the maximum likelihood estimator is to nd values of that maximize equation (28). To do so, we use a sequential quadratic programming algorithm from the Matlab optimization toolbox. As implemented, the algorithm uses numerical two-sided derivatives for both the likelihood gradient and the constraint gradient.
Practical considerations. The evaluation of the likelihood entails many
solutions of the model, and therefore we endeavour to reduce the time required for solution. An initial guess for the solution path should be as \solvable" as possible. To this end, we adopted several strategies. In many cases, initializing the solution path with the steady state of the model was adequate. Some time savings were realized by using an initial path computed with the linearized model. For the model in the estimation example, it is 12
11 Fair (1984) successfully implements this Jacobian approximation method. For the test
example described below, recomputing the Jacobian for every period had a trivial e�ect on the value of the likelihood function. 12 See Anderson and Moore (1985) for details on this method or Fuhrer and Moore (1995a) for a detailed application.
21
necessary to use the linearization about the steady state when initializing the path and computing the terminal conditions, although this is not generally true. Since the likelihood evaluation consists of many solution paths generated sequentially from the data, we use information from the (T i)th period's expectations to aid in e�ciently computing the solution for period (T i +1). We use the converged expectations path from T i as an initial guess for T i + 1, in the hope that the expectations are not changed enormously by the information update. We also reduce the length of the solution path (shorten the horizon) if the system moves close to the steady state well before end of the horizon in the previous period. Finally, a solution path may be di�cult to nd in some regions of the parameter space. Therefore, we have found that limits on the parameters are often helpful for the initial estimations.
3.3.1 Constraints Imposed on the Maximization Problem In implementing a maximum likelihood estimator for linear problems, Fuhrer and Moore impose a \root constraint" on the estimator. For the linear model, the solution will not be unique and stable unless the parameters imply the correct number of roots of modulus greater than one. For the nonlinear model, this condition should hold in a linearization about the steady-state. In practice, we impose the root condition for the linearization of the model about the endpoint of the expectation solution path. The total number of required stability conditions for a model with n equations and � leads is n�. In general, a set of \auxiliary" stability conditions that arise from singularities in the lead blocks of the equations will provide some number ns of the required stability conditions. The remainder come from the spanning vectors (in most cases the eigenvectors) associated with the large roots in the model. For given parameter values, one can compute the number of auxiliary stability conditions ns. For the same parameters, one can compute the roots of the transition matrix for the model, and sort 13
14
13 See Fuhrer and Moore (1995b) for an application of this estimation strategy. 14 See Anderson and Moore (1985) and King and Watson (1995a) for details.
22
them from small to large. The location of the smallest large root will be n� ns , and the location of the largest small root will be one more than this. We set the numerical de nition of a large root to be a number slightly larger than one, in most cases 1 + 1 � 10 . Denoting the upper bound by U , the numerical tolerance for the constraint by t, and the vector of the modulus of the roots by �, the constraint may be expressed as 6
min(U �(n� nsr + 1); �(n� nsr) U t) > 0 :
(29)
This ensures that at the expected break point, the smallest large root is t greater than the upper bound U and that the largest small root is less than or equal to U . The augmented Lagrangian optimization method allows the constraint to be violated during optimization; the constraint Jacobian always points the solution vector back in the direction of the feasible range, and a converged solution always satis es the constraint.
3.3.2 Standard Errors The standard errors for the estimated parameters may be obtained from an estimate of the inverse Hessian. The standard errors may be computed as �q
H^
1
�
i;i
;
the square-root of the diagonal elements of the negative of the inverse Hessian matrix. The optimization algorithm that we employ returns a Hessian estimate based on the BFGS updating algorithm (see Gill, Murray, and Wright (1981)). In practice, a more accurate estimate of the local curvature of the likelihood surface may be obtained from direct numerical second derivatives of the likelihood function.
3.4 A Maximum-Likelihood Estimation Example
While models of the type explored in the solution section can be solved quite rapidly, computing the likelihood for this class of models is solution-intensive. 23
Each evaluation of the likelihood requires at least N solutions, where N is the number of observations in the sample. We estimate the parameters [�� ; �y ; ��; �� ; ��; ] of the model described in section 2.1 on a sample from 1965:QI to 1990:QIV. We use as starting values the estimates from a linear version of the model that employs the constantduration approximation for the term structure equation 9,
�t D[�t
+1
�t ] = it �t ; +1
where D is Macaulay's (1938) duration. The data are as described in Fuhrer and Moore (1995b). The routine converges after 71 steps and 805 function evaluations with a feasible solution. The maximum-likelihood estimates of the parameters are presented in Table 3. The improvement in the likelihood is extremely significant: The likelihood ratio test for the restriction that holds the parameters at their initial values takes the value 134:44, a � random variable with 6 degrees of freedom with a p-value of 10 . Estimating a potentially misspeci ed model on real data is a high hurdle for any estimation technique to clear. A somewhat easier task is to estimate the parameters for a data set for which we know the true model. Thus, we generate a simulated data set using the model of this section and the initial parameter values displayed in column 1 of the above table. We then run the FIML procedure on this data set. We initialize the parameters at some distance from their \true" values. The converged values are presented in Table 4 below. The parameter estimates from this exercise generally 15
2
24 16
17
15 We set �y1 = 1:25 and �y2 = :42, which are estimated for the linear version of the
model by Fuhrer and Moore (1995b). 16 Grid searches, Monte Carlo parameter selection, and genetic methods yield similar results for the example described above. However, the likelihood function examined is apparently smooth enough that derivative-based search methods are most e�cient. 17 We create a series of shock vectors, �t = [�it ; �yt ; �xt]T . These shocks are normally distributed with the following variance-covariance matrix:
2 0:7589
= 4 0:2652
3
0:2652 0:0589 0:8096 0:1367 5 � 10 4 0:0589 0:1367 0:2030
24
Table 3 FIML Estimation Results, U.S. Quarterly Data 1965:QI{1990:QIV Initial Parameter Value �� 0.5 �y 0.5 �� 0.03 �� 0.79 �� 0.032
0.00455 Likelihood value: 1475.65
Lower Bound 0.001 0.005 0.001 0.001 0.005 10 7
Upper Bound 5 0.2 5 1 0.2 0.3
Converged Value 0.303 0.679 0.0412 0.202 0.0559 0.00139
Standard Errors 0.238 0.378 0.0307 0.0925 0.0203 0.00116
t-stat, (H : p = 0) 1.27 1.80 1.34 2.18 2.75 1.20 0
1542.87
lie close to the true values. The estimated standard errors imply that only for the �� parameter could we reject the true value, as indicated in the last column of the table. Thus, for this nontrivial model and data set, the estimator performs quite well.
4 Future Studies We suggest further research into the approximation error introduced by our method's treatment of expectations. In section 2.3, we show that, for the stochastic growth model with noisy technology, our results closely match This is the variance-covariance structure of shocks in the linear version of this model, estimated by Fuhrer and Moore (1995b). We simulate the model with these shocks, using the t 1-period viewpoint date for expectations. (See Appendix A.) So that the initial conditions do not have undue in uence on the estimate, and the \faux" sample begins 100 periods after the initial period.
25
Table 4 FIML Estimation Results, Simulated Quarterly Data 1965:QI{1990:QIV \Truth" Parameter (p�) �� 0.5 �y 0.5 �� 0.03 �� 0.79 �� 0.032
0.0045 Likelihood value: 1839.1
Initial Value 1 1.5 0.04 0.3 0.04 0.005
Lower Bound 0.001 0.005 0.001 0.001 0.005 0.001
1713.35
Upper Bound 5 0.2 6 1 0.2 0.3
Converged Value 0.432 0.503 0.0298 0.361 0.0358 0.0104
Standard Errors 0.034 0.038 0.0021 0.233 0.0030 0.00722
1844.26
those from dynamic programming despite the fact that we use a certainty equivalence approximation. For some models, this approximation may not be so accurate. In these cases it will be necessary to take into account the distribution of future errors in forming model expectations. We now discuss several proposed methods for doing this. Each method involves applying a certain amount of \brute force" to the problem because we must numerically integrate over the probability density of future shocks. The most brutish of the brute force methods would be to use our method as a starting point for dynamic programming. In particular, value and decision functions computed by our method would be the initial guess for the value function equation. Presumably the certainty equivalence solution will be a decent rst approximation and the number of value function iterations required for convergence will be low. In looking for an alternative to dynamic programming methods, we note that Fair and Taylor (1983) propose a Monte Carlo integration method 26
t-stat, (H : p = p�) -1.97 0.08 -0.11 -1.83 1.16 0.81 0
for evaluating expectations with stochastic errors using an extended path method. In particular, many sets of expectations are computed using random draws from the shock distribution over the entire path. These conditional expectations are then averaged to form the unconditional expectation. In e�ect, this method numerically integrates over the probability distribution of shocks for the entire extended path. We view this as a backhanded way to evaluate the multiple integrals over the distribution of shocks. An important aspect of the formation of expectations is that a given shock in period t + i could be followed by many di�erent shocks in t + i +1. Each of these could be followed by many di�erent shocks in t + i +2, and so on. For discrete shocks, these possibilities resemble the branches of a tree. This simulation method, however, takes a single set of shock realizations each time and solves for the expectations conditional on those realizations. The branching phenomenon will only be represented with a very large number of random shocks. While this method asymptotically approximates the unconditional expectation, it is not clear to us that it would converge very quickly. Instead, we propose a \hybrid" method which would approximate the unconditional expectations without completely sacri cing computational ef ciency. We would discretize the shocks into k possible realizations for n periods ahead. All remaining shocks would be set equal to their expected value (presumably zero). For a speci c combination of shock realizations, we would solve for the conditional expectations. This last step would be repeated until we have integrated over all the possible combinations of discrete shocks. For more accuracy, one could expand the number of levels of the nested integral. However, in order to numerically integrate over k possible shock values per period in n periods, we would need to generate kn solutions. It remains to be seen which of these methods are best suited to various nonlinear models. Future research could better articulate the trade-o� between the computational e�ciency of the solution method and the numerical accuracy of the unconditional expectations. In the meantime, our solution method can be safely applied to models for which substantial accuracy is not lost because of the certainty equivalence approximation. 27
5 Conclusion This paper has developed computationally e�cient algorithms for solution and estimation of nonlinear dynamic rational expectations models. The algorithms yield accurate solutions for the models studied here, even when compared to dynamic programming techniques that explicitly account for the distribution of future shocks. The algorithm obtains solutions rapidly, in part by taking advantage of signi cant sparsity in the structure of the fundamental Newton step. The algorithm also accommodates models with unit roots and with singularities of the type addressed for linear models in Anderson and Moore (1985) and King and Watson (1995a,b). An important advantage of the rapid solution algorithm is that it makes derivative-based estimation methods feasible. A single computation of the likelihood function might take hours using existing methods; with our algorithm a likelihood evaluation takes on the order of one minute for moderatesized models and data sets. This allows a researcher to estimate a nonlinear rational expectations model via maximum-likelihood estimation in hours, rather than days or more. Our hope is that this will allow more extensive empirical analyses of many classes of nonlinear rational expectations models.
28
Appendix A: Stochastic Dynamic Simulation In section 3.4, we use stochastic simulations to generate \faux" data to test the estimator. This appendix describes the computations required for a stochastic simulation using our solution method. The simulation method di�ers somewhat depending upon the viewpoint date of the expectations. We perform the simulation sequentially, shocking and solving for the tperiod, incorporating the solution for xt into the initial conditions for the (t + 1)-period, and so on. In the case of the t-period viewpoint date, our method forms expectations based on the x's up to t 1 and conditional on �t . (The realizations of xt and �t are, of course, not independent.) This is functionally equivalent to taking the conditional expectations using the t 1period information and given �t . In particular, instead of solving for the zeros of F (xt ; xt ; E (xt )), we nd xt and E (xt ) that satisfy F (xt ; xt ; E (xt )) = �t . Therefore the full Newton step is now +
2 66 66 66 66 66 4
Ht 0 : : 0
�
+
+
In�� 0 0 0 0 0 t t t ::: H H H : : : H�t 0 H t � : : : H t H t H t : : : H�t : : : : : : : : : : : : : : 0 0 ::: Q 1
+1
0 +1 1
1 +1 0
+1 1
+1
0 0 0 : :
::: ::: ::: : :
2 66 3 666 77 666 77 66 77 66 77 66 77 66 5 66 66 66 4
�xt � ... �xt �xt �xt ... �xT �xT ... �xT � 1
+1
+1
3 77 2 0 77 6 ... 77 66 77 66 0 77 66 77 66 F (xt ) �t 77 = 66 F (xt+1 ) 77 66 ... 77 66 77 64 F (xT ) 77 Qx+ 5
+
Note that it is equivalent to the original Newton step (equation 8) except for the t-period shock. Performing a dynamic simulation using the t 1-period information set requires additional modi cation to our solution method. In this case, the expectations, E (xt ), are formed prior to the realization of the shock, �t . We compute these using our usual method (as in section 1), with xt as initial conditions. +
29
3 77 77 77 77 77 : 77 77 77 5
The period t \data" are generated by nding the xt that solves the equation F (xt ; xt ; E (xt )) = �t , taking the expectations and shock as given. To do this, we use a single-period Newton's method solution. The t 1 expectations are held xed, inducing an n� � n� identity matrix in the bottom block of the Jacobian. There is one \stack" of Hit derivative matrices, since we are solving for xt . The shock is fed into the system as a function residual as above. The full Newton step is, therefore, +
2 66 t In� �n� t 4 H � ::: H 1
0
0
0
2 66 3 666 0 0 0 0 7 66 H0t H1t : : : H�t 75 66 66 ::: In��n� 66 64
�xt � ... �xt �xt �xt ... �xt �
1
+1
+
30
3 2 3 0 77 66 77 ... 77 66 77 77 66 77 0 77 66 7 77 = 66 F (xt ) �t 777 : 77 66 77 0 77 66 77 ... 5 4 5
0
References [1] Takeshi Amemiya. Non-linear regression models. In Zvi Griliches and Michael D. Intriligator, editors, Handbook of Econometrics, chapter 6, pages 333{89. North-Holland Publishing Company, Amsterdam, 1983. [2] Gary Anderson and George Moore. A Linear Algebraic Procedure for Solving Linear Perfect Foresight Models. Economics Letters, 17:247{52, 1985. [3] Gary Anderson and George Moore. An e�cient procedure for solving nonlinear perfect foresight models. Working Paper, January 1986. [4] Lawrence J. Christiano. Solving the stochastic growth model by linearquadratic approximation and by value-function iteration. Journal of Business and Economic Statistics, 8(1):23{26, January 1990. [5] Ray C. Fair. Speci cation, Estimation, and Analysis of Macroeconometric Models. Harvard University Press, Cambridge, MA, 1984. [6] Ray C. Fair and John B. Taylor. Solution and maximum likelihood estimation of dynamic nonlinear rational expectations models. Econometrica, 51(4):1169-85, July 1983. [7] Je�rey C. Fuhrer and Brian R. Madigan. Monetary Policy When Interest Rates are Bounded at Zero. Federal Reserve Bank of Boston Working Paper #94{1, forthcoming Review of Economics and Statistics. May 1994. [8] Je�rey C. Fuhrer and George R. Moore. In ation Persistence. Quarterly Journal of Economics, 110:127{59, February 1995a. [9] Je�rey C. Fuhrer and George Moore. Monetary policy trade-o�s and the and the correlation between nominal interest rates and real output. American Economic Review, 85:219{39, March 1995b. 31
[10] Joseph E. Gagnon. Solving the stochastic growth model by deterministic extended path. Journal of Business and Economic Statistics, 8(1):35{36, January 1990. [11] Philip E. Gill, Walter Murray, and Margaret H. Wright. Practical Optimization. Academic Press, Inc., 1981. [12] Robert G. King and Mark W. Watson. The Solution of Singular Linear Di�erence Systems Under Rational Expectations. Working Paper, April 1995a. [13] Robert G. King and Mark W. Watson. System Reduction and Solution Algorithms for Singular Linear Di�erence Systems Under Rational Expectations. Working Paper, May 1995b. [14] Finn E. Kydland and Edward C. Prescott. Time to build and aggregate
uctuations. Econometrica, 50(6):1345{1370, November 1982. [15] Frederick R. Macaulay. Some Theoretical Problems Suggested by the Movements of Interest Rates, Bond Yields, and Stock Prices in the United States Since 1856. National Bureau of Economic Research, 1938. [16] Bennett McCallum. Real business cycle models. In Robert J. Barro, editor, Modern Business Cycle Theory, chapter 1, pages 16{50. Harvard University Press, Cambridge, MA, 1989. [17] Ellen R. McGrattan. Solving the stochastic growth model with a nite element method. Journal of Economic Dynamics and Control, 20(1{ 3):19{42, January 1996. [18] Thomas J. Sargent. Estimation of Dynamic Labor Demand Schedules under Rational Expectations. Journal of Political Economy, 86, No. 6:1009{1044, December 1978. [19] John B. Taylor and H. Uhlig. Solving nonlinear stochastic growth models: A comparison of alternative solution methods. Journal of Business and Economic Statistics, 8:1{17, January 1990. 32
Figure 1
Nonlinear Sticky Price Model: Unanticipated Disinflation Federal Funds Rate 0.1 0.08 0.06 0.04 0.02 0 Output Gap 0.02 0.01 0 −0.01 −0.02 −0.03 −0.04 Inflation 0.05
0
−0.05
0
2
4
6 Years
8
10
Figure 2
One−Sector Stochastic Growth Model: 10% Technology Shock to Steady State Levels Consumption 1.3 1.28 1.26 1.24 1.22 1.2 Capital 5.6 5.5 5.4 5.3 5.2 5.1 Technology 1.1 1.08 1.06 1.04 1.02 1
0
2
4
6 Years
8
10
Figure 3
Two−Sector Stochastic Growth Model: 10% Technology Shock to Steady State Levels Consumption 0.65
0.6
0.55 Capital 3 2.8 2.6
Labor 0.54 0.52 0.5 0.48 Technology 1.1
1.05
1
0
1
2
3 Years
4
5
Figure 4
Our Method versus Dynamic Programming Deterministic Solution Path 60% Initial Technology Shock 22 Our Method DP, N=100 DP, N=500
21
20
19
18
17
16
15 0
10
20
30
40
50 Quarters
60
70
80
90
100
Figure 5
Consumption Decision Rules for the One−Sector Stochastic Growth Model: Finite Element versus Our Method 5 Our Method Finite Element Method 4.5 k(t−1) = 27.88
4
Consumption (c(t))
3.5
k(t−1) = 14.02
3
2.5 k(t−1) = 6.957
2
k(t−1) = 3.353
1.5
k(t−1) = 1.515
1 k(t−1) = 0.5779
0.5
0
k(t−1) = 0.1
0.4
0.6
0.8
1 1.2 1.4 Technology Level (z(t))
1.6
1.8
2