www.ijcrt.org
© 2017 IJCRT | Volume 5, Issue 4 November 2017 | ISSN: 2320-2882
COMPUTER AIDED PROCESS PLANNING AND OPTIMIZATION OF SPIKE SUPPORT Dr J.V.R.Ramesh1 , K.Yogesh2 1
2
Professor, Dept of Mechanical, S ITS, Kadapa, AP, Indi a. Assistant Professor, Dept of Mechanical Engineering, SAITS, Rajampet, AP, India.
ABSTRACT- In manufacturi ng, the goal is to produce components that meet the design specificati ons. The design specification ensures the functi onality aspect. Spike support is used in a fourth-generation manportable fire-and-forget anti-tank gui ded missile with tandem-charged heat warhead, developed and designed by the ISRAELI company and in service with some nations. As it is a missile component, it shoul d be light in weight at the same ti me strength shoul d be more. Aluminum material is used for spike support due to its best materi al properties. Due to this thin wall thickness, there is more chance of rejecti ons and reworks. Nowadays rejecti on is a serious problem that has been arising in every manufacturing industry. Due to this reason, the manufacturing s ector is advancing into losses. There are many factors responsi ble for rejecti on and reworks, such as human errors, machine errors, process planning, material errors etc. CAD/CAM/ CAE systems play a crucial role in design opti mization and process opti mization of any component and it is helpful in reducing the reworks and rejections. By considering the above important aspect, this project is taken up for reducing the rejections to the least values. The aim of the project is to reduce and maintain the rejection rate bel ow six percent which was previ ously 9 percent and reduces and keep the rework rate below 10 percent which was previously 15% . Initi ally, the opti mum cutting s peed of the tool is evaluated by doing the harmonic anal ysis in the CAE system using ANS YS software. Once the cutting speeds are determined, manufacturing process plan will be devel oped in cam system using the NX-CAM software. Process optimization was also carried out by using the mandrel for a job hol ding to reduce damage to the component while machining operati on is running.
I. INTRODUCTION 1.1 COMPUTER-AIDED DES IGN (CAD) Co mputer-aided design (CAD), also known as computer-aided design and drafting (CAD), is the use of computer systems to assist in the creation, modification, analysis, or optimization of the design. Computer-aided drafting exp lains the process of creating and developing a technical drawing with the use of specialized co mputer software. CAD software is used to increase the productivity of the designer, improve the quality of design and involves the improvement of commun ications through documentation, and helps out in the creation of the database for progressive manufacturing. CAD output is often referred in the form of electronic programmed files for print or various machining operations. CAD software takes advantage of either vector based graphics to portray the objects of traditional drafting, or to produce raster graphics
IJCRT1704146
showing the overall image of designed objects. CAD often involves more than just shapes. As in the manual designing and drafting of engineering drawings, the 'output of cad' must fetch information, such as materials, dimensions, and tolerances, processes, according to application-specific conventions. CAD may be used to design figures and curves in two-dimensional (2D) space, surfaces, or curves, and solids developed in three-dimensional (3D) space. 'CAD is an important industrial art' which is extensively used in many applications such as shipbuilding, including automotive, prosthetics, aerospace industries , industrial, architectural design, and much more. CA D is also widely used to produce computer animation for special effects in movies, advertising and technical manuals. Because of its enormous economic importance and use, cad has been a major driving force for research in computational geometry, computer graphics which involve both hardware and software, and discrete differential geometry. 1.2 COMPUTER-AIDED MANUFACTURING (CAM) Co mputer-aided manufacturing is the computer software used to control machine tools and related mach inery in the manufacturing of work-p ieces. CAM may also refer to the use of a computer to assist in all operations of a manufacturing plant, management, including planning, storage and transportation. Its main purpose is to create a faster rate of production process and components and to tool with more precise dimensions and material consistency, which in some cases, uses only the required amount of raw material, while simu ltaneously lower energy consumption.
1.3 COMPUTER NUMERICAL CONTROL Co mputer numerical control (CNC) is a unique one, in which the mot ions and functions of machine tools are controlled using a prepared program containing coded alphanumeric data. CNC can control the motions of the work p iece or tool, the input parameters such as speed, depth of cut, feed, and the functions such as turning the spindle on/off, turning coolant on/off.
II. LITERATURE SURVEY ON FIXTURES POLLACK 1976 [1] - a fixture is a work-piece locating and holding device used for machine tools, inspection, welding and assembly; it does not control the position of the tool or instrument which is being used. • Elements of the jig or fixture must also be present which support the work and items, called locators, which position the work. • Once located and positioned, the work is clamped so that it will not move off the supports or locators. B URLEY AND CORB ETT 1998 [2]- a jig is defined as a manufacturing support that either holds a part
International Journal of Creative Research Thoughts (IJCRT) www.ijcrt.org
1141
www.ijcrt.org
© 2017 IJCRT | Volume 5, Issue 4 November 2017 | ISSN: 2320-2882
or is itself fixed on the part and is built-in with devices to escort a cutting tool ensuring the correct position of the mach ining path relative to the co mponent. • a fixture is defined as a manufacturing support for holding and locating parts during assembly operations or machining, which does not provide definitive guidance on the cutting tools. • tooling is used as the generic name for jigs and fixtures and also the tools set from the master gauges for calibrating jigs and fixtures. • Hence, jig less assembly is assembly without the use of jigs; it requires that parts are manufactured to sufficient accuracy to ensure correct assembly; it is not necessarily fixtureless [or tool less] assembly. J. C. TRAPPEY AND C. R. LIU 1990 [3]fixture design can be classified as a part of process planning. The task is the description of process planning specifically states that "'fixture design for each work piece set-up" is an integrated planning task. However, the automation of fixtu re design has been overlooked in most research into automated process planning.
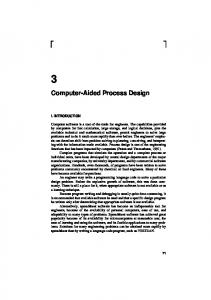
Fig : sketch of spike support Final 3d model of spike support.
III. 3D MODELING 3.1 SPIKE S UPPORT 2D DRAWING A 2D drawing is used to design a 3D model of our component using Uni-graphics NX 7.5 CAD software. Below shows the 2D drawings of the spike support with all the required dimensions for manufacturing the component without any errors.
Fig : final 3d model of spike support
IV. FINITE ELEMENT ANALYSIS OF SPINDLE
Fig: 2D input of spike support 3.2 STEPS INVOLVED IN 3D MODELLING OF SPIKE S UPPORT 3D model is designed by using NX CAD software. SKETCHING Below is the sketch that is required to obtain the 3D model of the spike support fro m the above 2D drawing. Below image shows the sketch of the spike support.
IJCRT1704146
4.1 HIGH-SPEED MOTORIZED SPINDLE A high-speed spindle is an important unit which influences significantly on the dynamics of the machin ing process. Spindle unit has its natural frequencies, and during the machin ing process, the forcing frequency at which mach ining is done should not be the natural frequency of the spindle unit to avoid the resonance. Hence determin ing the natural frequency of the spindle unit is very necessary for selecting the spindle speed for machin ing. This analysis discusses the free vibration analysis of the spindle unit. Spindle unit is modelled, and the modal analysis is performed to determine the natural frequencies and mode shapes of the spindle.
International Journal of Creative Research Thoughts (IJCRT) www.ijcrt.org
1142
www.ijcrt.org
© 2017 IJCRT | Volume 5, Issue 4 November 2017 | ISSN: 2320-2882
[email protected] HZ
[email protected] HZ Fig : isometric view of high-speed spindle model 4.2 MODAL ANALYS IS - AN INTRODUCTION Modal analysis is regularly used to determine the vibration characteristics such as natural frequencies and mode shapes of a structure or a machine component while it is being designed. It is noted that it can also be a starting point for another more detailed analysis such as a transient dynamic analysis, a harmonic response analysis or a spectrum analysis.
Fig : finite element meshed model of the high-speed spindle unit.
Mode5@ 16.93 HZ
[email protected]
Figures below show the different mode shapes of the spindle unit.
[email protected] [email protected] HZ
IJCRT1704146
International Journal of Creative Research Thoughts (IJCRT) www.ijcrt.org
1143
www.ijcrt.org
[email protected] h z
© 2017 IJCRT | Volume 5, Issue 4 November 2017 | ISSN: 2320-2882
[email protected] z
Fro m the vibration analysis of the high-speed spindle unit, it is recommended that the frequencies listed above should be avoided during a mach ining process.
V. FINITE ELEMENT ANALYSIS OF SPIKE SUPPORT COMPONENT The spike support structure having thin wall is considered here for performing harmonic analysis to predict the stable speed ranges. The spike support structure is modelled, and modal analysis has been done to find out the natural frequencies followed by harmonic analysis has been performed. 5.1 BOUNDARY CONDITIONS: Displacements are constrained parameters at the nodes where the spike is mounted on the work piece holder. Some modes to expand is given as ten so that the first ten mode shapes of the structure can be obtained.
[email protected] h z
[email protected] z
Fig : boundary conditions for modal analysis Figures below show the different mode shapes of the spindle unit.
[email protected] HZ
IJCRT1704146
[email protected] HZ
International Journal of Creative Research Thoughts (IJCRT) www.ijcrt.org
1144
www.ijcrt.org
© 2017 IJCRT | Volume 5, Issue 4 November 2017 | ISSN: 2320-2882
[email protected] h z
[email protected] z
[email protected] HZ
[email protected] HZ
[email protected] h z
mode5@ 24.48 hz
IJCRT1704146
[email protected] z
[email protected] z
International Journal of Creative Research Thoughts (IJCRT) www.ijcrt.org
1145
www.ijcrt.org
© 2017 IJCRT | Volume 5, Issue 4 November 2017 | ISSN: 2320-2882
By maintaining this stable speed, spike co mponent is prepared on CNC machine. The main objective of the project is to reduce reject ion and reworks rate. 6.1 A MET HODOLOGY US ED IN THE MANUFACTURING OF SPIKE S UPPORT IS AS MENTIONED B ELOW Identifying suitable machine. Selecting suitable tools for manufacturing the thin walled co mponent. Designing fixture/ mandrel to support spike component for external operations. Listing down the sequence of operations performed on spike component. Generating tool path at specified cutting speed. Generating NC p rogram using the nx-cam software. 6.2 STEPS INVOLVED IN 3D MODELLING OF MANDREL 3D model is designed and developed by using NX CAD software. SKETCHING -below is the sketch required to obtain the 3d model of the mandrel fro m the above 2D drawing. Below image shows the sketch of the mandrel. Fro m the vibration analysis of the spike support component, it is recommended that the frequencies listed above should be avoided during the machining process. 5.2 HARMONIC ANALYS IS OF THE SPIKE SUPPORT COMPONENT Any sustained cyclic load will produce a sustained cyclic response (a harmonic response) in a structural system. Harmon ic response analysis gives you the ability to predict the sustained dynamic behaviour of your structures, thus enabling you to verify whether or not your designs will successfully overcome resonance, fatigue, and other harmful effects of forced v ibrations. "peak" responses are then identified on the graph and stress reviewed at those peak frequencies. The spike support component is segregated into three zones according to the thickness, and the loads are applied to various zones for performing harmonic analysis fro m wh ich stable frequency range for each zone is predicted.
Fig : sketch of mandrel Below image shows a final 3D model of a mandrel.
Fig : final 3D model of mandrel
Fig : segregation of zones based on the thickness of the component
VI. COMPUTER-AIDED MANUFACTURING Fro m the above fin ite element analysis, it is concluded that the stable speed range for machining the spike support component is 10-30HZ, i.e. (600-1800 rp m).
IJCRT1704146
6.3 CAM OPERATION IN NX-CAM BASIC CAM S ETUP In NX, the NC machin ing is referred to the setup. The set up for the machining jobs should be decided by looking at all the environmental information fro m four viewpoints: program, method, geometry, and tool. These four viewpoints were designed to mimic the thought process that can be used when planning the NC program.
International Journal of Creative Research Thoughts (IJCRT) www.ijcrt.org
1146
www.ijcrt.org
© 2017 IJCRT | Volume 5, Issue 4 November 2017 | ISSN: 2320-2882
Each viewpoint organizes the informat ion for the operation in a manner relevant to that particular viewpoint.
GEN ERATING TOOL PATH ON SPIKE S UPPORT The series of movements made by the tip of a cutting tool. X and z codes indicate a tool path within a part p rogram. The path through space that the tip of a cutting tool follows on its way to producing the desired geometry of the work piece. Set_up_1 tool path generation below image shows the creation of facing operation on spike model maintain ing speed at 1200rp m and feed 0.25 mmp r. Below image shows the creation of od_rough operation on spike model maintaining speed at 1200rp m and feed 0.25 mmp r.
The above figures show surface roughness and scratch on the surface of spike support Fig : od_rough_turn operation Below image shows the verificat ion of drilling operation
VII. REDUCTION OF REJECTION RATE AND REWORKS RATE Reducing reject ion rate and reworks rate using 5-why (or) why-why analysis which helps in increasing production rate of the industry.
Fig : verification of drilling operation Final model obtained after generation of tool path FINAL COMPONENT AFTER MANUFACTURING
IJCRT1704146
5-WHY ANALYS IS (OR) WHY-WHY ANALYS IS It is a method of questioning that leads to the identification of the cause(s) of a problem. A why-why is conducted to identify solutions to a problem that address its root cause(s). Rather than taking actions that are merely band-aids, a why-why helps to identify how to prevent the issue from happening again. A why-why is most effective in a team setting or with more than one person involved. Capture the input on a flipchart or a simp le spreadsheet like the one below. First, start with the problem like to solve. Then ask, "why is x taking place?" you will end up with some answers. Jot these down. Repeat the process for each of the answers to the first question. Repeat the process for each of the answers to the second ‘why' and continue until you've asked why five times. When you've hit the 5th why you usually have determined some root causes. Now you can identify specific action plans to address those root causes. Involve the right people – it helps to have those that are familiar with the process and the problem in the roo m,
International Journal of Creative Research Thoughts (IJCRT) www.ijcrt.org
1147
www.ijcrt.org
© 2017 IJCRT | Volume 5, Issue 4 November 2017 | ISSN: 2320-2882
so they can answer why something happened. It is also helpful to have someone with a fresh eye participate – often they ask questions that help those involved in the problem ext ract the real reasons something happened. Avoid blaming – look for systemic problems. You are looking for systematic solutions to the problem. Blaming an individual ends up only making people feel bad. If someone didn't turn the right valve, ask the question "what could have helped the person turn the right valve?" could improvements in a procedure or labelling the valve have helped the individual? Get creative – what systematic solutions might address the problem? Allow people to brainstorm and identify potential actions to address the issue. Later, go through the potential actions to identify the solutions that will yield the most effective results. 7.1 SEQUENCE OF OPERATIONS MAIN CAUS ES OF REJ ECTION RATE IN INDUSTRIES 1. Operator's negligence at work place and their poor knowledge in manufacturing. 2. Rejection rate also increased due to equipment such as component setup, assigning improper tools, fixture design problems. 3. Another cause of the increase in rejection rate is due to the procedure of machin ing like mistakes in the sequence of operations (turning, milling and drilling). 4. Another cause is following the norms or rules of the company in impossible conditions of machining the component.
VIII. RESULTS
Fig: frequency vs amplitude in y-dir Stable speed range between 20-100h z i,e (1200-6000 rp m) in x-d irection and stable speed range is between 14-24hz i,e (840-1440 rp m),25-64h z i,e (1500-3840 rp m)and 70-80hz i,e (4200-4800 rp m) in y-direction respectively.
Fig: frequency vs amplitude in z-d ir graph fo r zone1 Fro m the above graph, it is concluded that the stable speed range is between 20-100hz i,e (1200-6000 rp m) Zone2-harmonic analysis has been carried out in the frequency range of 10-100h z (600-6000 rp m).fro m the analysis results graph of frequency vs amp litude in x,y and z directions have been plotted and shown below.
Results are represented graphically to specify the quality control of spike support component. GRAPHICAL REPRES ENTATION OF HARMONIC ANALYS IS ON SPIKE S UPPORT Zone 1-harmon ic analysis has been carried out in the frequency range of 10-100h z (600-6000 rp m).fro m the analysis results graph of frequency vs amp litude in x,y and z directions have been plotted and shown below.
Fig : frequency vs amplitude in x-d ir
Fig : frequency vs amplitude in x-d ir
Fig : frequency vs amplitude in y-d ir
IJCRT1704146
International Journal of Creative Research Thoughts (IJCRT) www.ijcrt.org
1148
www.ijcrt.org
© 2017 IJCRT | Volume 5, Issue 4 November 2017 | ISSN: 2320-2882
Stable speed range between 20-70h z i,e (1200-4200 rp m) in x- direction and stable speed range between 10-80hz i,e (600-4800 rp m) in y-direction respectively. The co mponent will be free of vibrations, and good surface finish can be achieved.
Fig : frequency vs amplitude in z-dir graph for zone2 Fro m the above graph, it is concluded that the stable speed range is between 14-80h z i,e (840-4800 rp m) Zone 3- harmonic analysis has been carried out in the frequency range of 10-100h z (600-6000 rp m).fro m the analysis results graph of frequency vs amp litude in x,y and z directions have been plotted and shown below
Fig : frequency vs amplitude in z-d ir graph for zone3 Fro m the above graph, it is concluded that the stable speed range is between 10-50h z i,e (600-3000 rp m) GRAPHICAL REPRES ENTATION OF REJ ECTION AND REWORKS RATE Below graphs shows the rejection and reworks rate before why-why analysis and after why-why analysis. Results before why-why analysis
Fig : frequency vs amplitude in x-d ir Results after why-why analysis These four causes for reject ion wh ich are mentioned above is rectified by using why-why analysis. The following graph indicates rejection rate after why-why analysis.
Fig: frequency vs amplitude in y-dir Stable speed range between 10-80hz i,e (600-4800 rp m) in x-direction and stable speed range between 10-30hz i,e (600-1800 rp m) y -direct ion. The co mponent will be free of vibrations, and good surface finish can be achieved.
IJCRT1704146
International Journal of Creative Research Thoughts (IJCRT) www.ijcrt.org
1149
www.ijcrt.org
© 2017 IJCRT | Volume 5, Issue 4 November 2017 | ISSN: 2320-2882
Fro m the above result graphs, it is concluded that the reworks and rejection rate is decreased from 9% to 6% after using why-why analysis.
IX SUMMARY By considering 2d inputs 3d model is generated using nx-cadsoftware. Model analysis has been done on the spindle to find out the frequencies to be avoided while machin ing the component. Harmonic analysis has been done on the spike support to find out the cutting speed ranges at which the component is free fro m v ibrations. Tool path is generated on spike support using the nxcam software. Non-expandable mandrel has been designed to support the component for external operations. By using the non-expandable mandrel, the rejection rate is more due to the gap between the mandrel and spike. The expandable mandrel is designed to overcome the rejection rate. Use of expandable mandrel results in less rejection co mpared to before mandrel. By using why-why analysis rejection and rework rate is reduced. Graphical representation of harmonic analysis on spike support is shown in results. Graphical representation of reject ion and reworks rate before and after why-why analysis is shown in results.
IJCRT1704146
International Journal of Creative Research Thoughts (IJCRT) www.ijcrt.org
1150