Computer-Assisted Morphometry: A New Method for Assessing and Distinguishing Morphological Variation in Wild and Domestic Seed Populations 1 IRWIN ROVNER 2'* AND FERENC GYULAI 3 2Binary Analytical Consultants, 1902 Alexander Road, Raleigh, NC 27608, USA.; e-maih
[email protected]; telephone: 919-834-1921 3Szent Istvan University, Department of Land Use and Landscape Management, H-2103 G6d6116, Hungary *Corresponding author, e-maih
[email protected]; telephone: 919-834-1921
Computer-Assisted Morphometry: A New Method for Assessingand Distinguishing Morphological Variation in Wild and Domestic Seed Populations. Morphometry is the science of measuring two-dimensional and three-dimensional aspects and parameters of object morphology, including size, shape, and tomography. Compared to conventional measurement, computer-assisted morphometry is exponentially faster, more accurate, more precise, and more efficient while providing a substantially broader spectrum of measurements of morphological parameters. Objective quantification replaces subjective, perception-based typology in the analysis of variation. Morphometric data from seed reference populations representing more than 1,000 taxa were used to study patterns of morphological variation and to assess related analytical assumptions and basic protocols. Many assumptions about the nature of seed morphology were found suspect and current minimum standards for representative reference seed types and control populations are inadequate and unreliable. Standard plots of area size distributions of wild and domestic seed populations revealed a consistent difference in histogram shape. Conventional descriptive statistical values were insensitive to the differences. Subjecting the histograms to morphometric shape measurements revealed specific shape factors that provided consistent values sensitive to the difference. A new quantitative method for distinguishing wild and domestic seed populations based on measurements of the shape of the distribution of morphological variation, rather than on typology or increase in mean size, was developed and initially tested. It is potentially applicable to the assessment of archaeological seed assemblages in studies of the history of ethnobotany and especially agriculture. Key Words: Seeds,morphometry, typology, variation, sampling, domestication index.
Introduction Applications of interactive, computer-assisted image analysis and morphometry, the measurement of two-dimensional and three-dimensional size, shape, and other morphological parameters of objects, have demonstrated robust and powerful capabilities in the study of seed morphology and variation. Under an ongoing Hungary-U.S.
1Received 17 May 2006; accepted 15 December 2006.
collaboration in archaeobotanical research, a major seed reference collection from the Hungarian Institute for Agrobotany was studied to create a morphometric database. To date, this database includes nearly 1,500 discrete seed populations, representing more than 1,300 taxa and uses a sample standard of 100 (or more) seeds or all seeds present if there are fewer than 100 for each population. In less than two months of intensive effort with the use of a digital camcorder, a standard desktop personal computer, and a commercially available image analysis software system, two investigators developed data files of 20 simul-
Economic Botany, 61 (2), 2007, pp. 154-172.
9 2007, by The New York Botanical Garden Press, Bronx, NY 10458-5126 U.S.A.
2007]
ROVNER AND GYULAI: COMPUTER-ASSISTED MORPHOMETRY
taneous two-dimensional measurements (size and shape) on about 150,000 individual seeds, totaling an estimated 3 million measurements. Initially, we sought to apply morphometric analysis to enhance taxonomic identification and classification of fossil seeds. In the course of exploring, manipulating, and interpreting twodimensional measurement data, several unanticipated aspects of the nature of morphological variation in seed populations were revealed. These exposed problems and questions regarding the validity of assumptions and standards currently used in the conventional study of seed morphology including adequate sampling, use of parametric statistics, and the validity of conventional morphotype (i.e., typological) constructs. Although these observations were not the intended goals of the original study, their significance in seed analysis mandated exploration for further evaluation and discussion. As a result, the original goal of developing a computer-based method of taxonomic identification of seeds was suspended pending resolution of these other problems. Emphasis was shifted to the study of patterns of morphological variation in seed populations identified by conventional taxonomic methods. To date, studies of seed morphology typically rely on a few conventional size measurements made with rulers and calipers or eyepiece reticules in dissecting microscopes, combined with the experience and memory of specialists and aided by reference collections, conventional atlases, and/or artificial identification keys. This is often a slow, tedious, and labor-intensive process subject to human error, inexperience, faulty memory, and statistically inadequate standards of sample size. To enhance accuracy, efficiency, and cost effectiveness in the study of seed morphology and variation, and in the analysis of modern and "fossil" seeds, exploratory tests were conducted using the Prism Image Analysis and Measurement software program created by John C. Russ (Analytical Vision, Inc.), which had been designed to operate only on Macintosh computers. The Prism program has since been superseded by the upgraded programs, Image Processing Tool Kit (IPTK) and Fovea Pro as created by John C. Russ and J. Christian Russ (http://www.ReindeerGraphics.corn). These programs operate in Macintosh or Windows environments as a drop-in accessory to popular image processing programs, most prominently Adobe Photoshop. There are
155
several other, similar software programs commercially available as well as freeware programs, such as NIH-Image. These are readily available for acquisition by individuals as well as institutions, operating in virtually all current standard personal computers, including laptops. Observed patterns of morphological variation departed significantly from our initial expectations. Histograms of measurements of size and shape did not conform to expected normal, i.e., bell-shaped distributions. Mean and modal values of replicate seed populations were consistently inconsistent. Distinctive and patterned differences in the configuration of distributions of morphometric data in replicate seed populations were not revealed coherently in conventional statistical descriptive summaries. As a result, our analyses shifted from single point mean and modal values of seed population measures to an analysis of the distribution and configuration of morphometric variation at the population level. Morphometric measurement of these distribution patterns revealed significant comparative aspects of seed variation not expressed in current methods or in statistical descriptions, especially the existence of the apparently quantifiable differences between the configurations of wild versus domestic seed populations. This provides a potential application to distinguish quantitatively between domesticated and wild seed assemblages from archaeological contexts. As with any new procedure, there is the potential for other significant applications. This report is an initial and preliminary discussion of what has been observed to date in order to call attention to the issues raised and to encourage exploration of the potential of morphometric analysis of seed assemblages. Fundamentals of Morphometry Morphometry is the quantitative measurement of size and shape. It offers robust and operatorindependent parameters employed in statistical, analytical, and classification routines. Object morphometry and object recognition are achieved using five parameter categories: dimension of size, dimensionless ratio of shape, harmonic analysis, fractal dimension, and topology (Rovner 1995; Rovner and Russ 1992; Russ 1990:175-318; Russ 1989, 1994; Russ and DeHoff2002; Russ and Rovner 1989a, 1989b). The shape of a distribution plot derived from such measurements easily shows if the distribution is
156
ECONOMIC BOTANY
continuous, normal (i.e., Gaussian, bell-shaped), non-parametric, or multimodal. Measurement of morphological parameters is methodologically and fundamentally different from standard measurements based on conventional Euclidean geometry. Computer-assisted measurements use digital (and digitized) images of one or more, often many more, objects in an image field. Edge-finding algorithms, usually based on threshold discrimination of objects selected by color or gray-scale contrast with the background and/or unwanted objects, isolate each object by its true configuration and convert it to a binary image, i.e., all black pixels (picture elements) against an all-white background. A calibrated pixel size provides the basis for simultaneous recording of up to 40 (or more) size and shape measurements of each two-dimensional binary object in the image field and/or of orientation, density, spacing, clustering, and other positional aspects. When disarticulated, individual objects, such as seeds, are arbitrarily and more or less randomly dispersed in an image field, positional measurements have no significance or effect on the morphology of the objects and are, therefore, ignored. Morphological measurements are based on pixel counts occurring within the margin of each binary object multiplied by calibrated pixel size with adjustments for specific measurements. For example, an area measurement is based on the number of complete pixels within an object margin plus an adjustment made for marginal (perimeter) pixels. The true margin is assumed to intersect a portion of each marginal pixel, which, if random and sufficient in sample quantity, will average half a pixel, that is, as many marginal pixels are less than half as are marginal pixels more than half. Thus, the number of marginal pixels is multiplied by 0.5 times the calibration size and then is added to the area calculated from the number of full pixels within the margin to achieve the area measurement. The result is a highly accurate approximation of true area, whether the object shape is a regular or an irregular polygon. This contrasts with conventional area measurement based on Euclidean geometry. Most objects are (de facto) placed on a coordinate grid, distances along the X- and Y-axes are measured, and the two values multiplied to yield area. However, in reality, this is not the area measurement of the object itself; rather, it is the measurement of the rectangular box the objects fits
[VOL. 61
snugly into. If the two-dimensional object is not rectangular or if it is irregular in any way, the Euclidean area value contains an inherent systematic error--the true area is smaller than the measured area. The degree of error increases directly with the degree of irregularity. Computer length is obtained by finding the longest chord or straight line of pixels between any two points on the perimeter of an object. This is an inelastic measurement that is precisely replicated regardless of object irregularity or orientation. Euclidean length uses placement on a coordinate grid and is therefore orientationdependent, a potential source of error. Euclidean length need not be the longest straight-line dimension of an object; rather, it is typically the length of the longer (longest) side of the snugly fitting box, usually measured along the X-axis. Moreover, if the object itself is a perfect rectangle, the length (i.e., the longest straight-line measurement within the object perimeter) is not the X-axis distance along the longer edge, but is the diagonal distance between a lower corner and the opposite upper corner. Again, such Euclidean measurements are subject to systematic error. The situation is no different if the objects appear to be round in binary image. Euclidean measurement is derived from the snug round box the object fits into, as compared to size calculation based on calibrated pixel counts. In reality, it is rare that such objects are perfectly round, an aspect that can be determined by computer measurements of shape, such as Roundness. In general, Euclidean measurements of irregular objects are not direct measurements of the objects; instead, the measurements are of the nearest simple Euclidean polygon that fits around the object. Shape factors are based on ratios of selected measurements of size and designed to be dimensionless, that is, size independent. The shape of every square, for example, is the same whether it is a large square or a small square. Perhaps the simplest shape factor to understand is Aspect Ratio, i.e., length divided by breadth, which measures an aspect of elongation of an object. Roundness measures the degree of departure from a circle of an object's two-dimensional binary configuration. This is based not on a visual image or an estimate of shape; rather, it is based on the mathematical fact that, in a circular object with a fixed area, an increase in the length of the
2007]
ROVNER AND GYULAI:COMPUTER-ASSISTED MORPHOMETRY
object causes the shape to depart from a circle. The Roundness calculation is constructed so that the value of a circle equals 1.0, while departures from a circle result in values less than 1.0 in direct proportion to the degree of deformation. Such quantitative objectivity can be enlightening as, for an example counter to intuitive perception, a square mathematically has a relatively high degree of roundness. Formfactor is similar to Roundness, but emphasizes the configuration of the perimeter rather than the length relative to object area. It is based on the mathematical fact that a circle (Formfactor value constructed to equal 1.0), compared to all other two-dimensional shapes (regular or irregular), has the smallest perimeter relative to its area. Since every object has a perimeter length and an area, this mathematical relationship can be used to quantify the degree to which an object's perimeter departs from that of a smooth circle, resulting in a value less than 1.0. Curl, which is calculated as length divided by center line distance (a.k.a., fiber or skeleton length), measures the degree of departure of an object from a straight line, which usually is applied to irregular lines or long, narrow (squiggly) objects. Solidity and Convexity are based on ratios of the area or perimeter of the true object to the area or perimeter, respectively, of a snug polygonal box fitted around the object. The degree of difference between the object and its fitted box is a quantitative measure of the degree of irregularity of the object; irregularity itself become a quantifiable aspect of morphology. Computer morphometry includes many more measurements of quantitative morphology, including surface texture, fractals, number of loops and branches, number of holes, hole size and shape, etc. (For further and more detailed discussion of measured parameters, see Russ 1990, 20O2; Russ and Dehoff 2002). Combinations and permutations of ways to quantity attributes of size, shape, texture, and topology, many of which simply are not feasible using common manual methods, can address analytical problems made difficult by individual, irregular, and perceptually stochastic morphological variation. The conventional description of seed morphology normally combines a few standard size measurements, e.g., length, width, and thickness, with qualitative or anecdotal shape terms (Corner 1976; Martin and Barkley 1961; Montgomery 1977; Schermann 1966). Shape is
157
described by picture stereotypes (e.g., "hatshaped," "cigar-shaped," "kidney-shaped") or by qualitative terms, such as nearly round, irregular, indented, sinuous, etc. Such conventions not only obscure Darwinian variation, but objects such as hats and cigars come in a wide variety of morphological configurations, making the visualized reference standard and qualitative terms subject to variations of individual perception. The result is lack of replication among experts and arguments over the reality of suggested archetypal configurations. Since the observer arbitrarily constructs such configurations, nature's assemblages cannot fulfill the parameters of an archetype as long as natural populations are governed by Darwinian variation at the individual level. To expect nature to constrain a natural Darwinian population to the parameters of a subjective type is a teleological concept.
Previous Seed Studies Using Computer Morphometrics Contrasted with the general trend of increasing computer use and in spite of substantial progress in the power and sophistication of morphometric computer programs in recent years, there are few instances of computer-assisted studies of seed morphology. For example, in an otherwise significant study of domestic seed development focusing on the increased size of domestic seeds during the Near Eastern Neolithic period, Willcox (2004:146) used an image-processing program to measure only two parameters, breadth and thickness. Basically, he used the computer to replicate standard manual measurements of cereal grains and plotted his data in conventional scatter diagrams. Previous computer-assisted studies tended toward creating methods of morphological matching for purposes of taxonomic identification. Computer assistance usually was oriented toward two general categories of application: data management and data generation. Gunn and Seldin (1977:1), for example, used computers for data management. They numerically coded and entered conventional qualitative and quantitative data into data banks as data matrices, allowing computer programs to match data from unknown seeds with matrices of reference data. This automated or "smart" system has two limitations: first, data are derived entirely by conventional means (i.e., descriptive and qualitative attributes with a few manual measurements) and second, data are
158
ECONOMIC BOTANY
coded for, not generated by, the computer. Since subjectivity, labor intensity, human error, etc., are not excluded, such a system is only as good as the conventional measurements and the perceptionbased subjective observations fed to it. Gunn and LaSota (1978) similarly applied a coded matrix automated procedure to their image data generated using scanning electron microscopy (SEM), but still relied heavily on subjective, qualitative observations, with a few size measurements. However, they suggest procedures to enhance data generation by using computer imaging, videotape, digitizing images by optical scanner, and/or interfacing directly with the computer that "would require sophisticated component interaction..." (Gunn and LaSota 1978:255). Contemporary image analysis and morphometric programs are far more robust, providing such "sophisticated component interaction" and more. Draper and Travis (1984) and Travis and Draper (1985) pieced together components and programs to create an image processing and morphometric system. Typical for its time, it is rudimentary compared to current systems. It made only four size measurements: area, perimeter, length, and width (Travis and Draper 1985:815); it did not make shape measurements. Size data were extracted to calculate one "Shape Factor" (a.k.a., Formfactor). Mthough simple, the system proved highly successful. Seeds of 7 cultigens and 42 associated weed contaminants were processed using a standard sample of only 30 seeds per taxon. Results were plotted on a two-way graph using Formfactor by length variables. "The results . . . show that five of the seven crop species can be distinguished from their major contaminants at the 95% level of confidence and most of the weed species can be distinguished from each other" (Travis and Draper 1985:815). These authors forcefully advocate the use of computer-assisted image analysis. They wrote the following. The problem of describing the shape of biological structures has occupied taxonomists for many years and, in 1962, the SystematicsAssociation published a chart of proposed standard forms of simple plane shapes. . . . However, visual assessment of shape by matching seeds with standard reference figures is laborious and subjective. In contrast the technique described.., allows quantitative measurement of dimensions and shape. It is rapid in operation and can be done by untrained staff. (Travis and Draper 1985:819)
[VOL. 61
Decker and Wilson (1986) used a relatively simple morphometric program to test seeds of three New World squash taxa, Cucurbita pepo, C. pepo vat. ovifera, and C. taxana. Using a 10-seed standard, their species-level seed identification success rate was 86% (Decker and Wilson 1986:601). We were encouraged by these earlier reports using computer assistance in seed identification to initiate tests of more advanced morphometric systems in pursuit of effective taxonomic identification of seeds. A major goal of the original study was to develop a computer-automated smart system for seed taxon identification using computerbased methods of object recognition (Russ 1990, chapter 9) incorporating 20 simultaneous computer measurements of two-dimensional size and shape in images of groups of seeds. In theory, this is essentially similar to OCR (optical character recognition) programs that identify numerals, alphabetic letters, and punctuation marks despite variations in fonts. If identification could be achieved using computer-generated measurement data from digitized images of groups of individual unknown seeds, then unsorted seed assemblages-with as many as 20 to 50 seeds per image field--could be classified taxonomically in a matter of minutes. Some success was achieved. A small assemblage of archaeological wheat seeds, previously identified only to genus, was identified to species by an untrained observer (Rovner) using computer assistance (Rovner 1995, Table 5.2). In several tests of the competence of computer assistance to identify individual seeds in mixed populations derived from 10 (or fewer) taxa, the computer did very well: 90% to 100% accuracy at the species level. However, in specific cases, notably Chenopodium and Amaranth--two archaeobotanically important taxa--the computer-based results often were inaccurate, even at the genus level. The computer placed single taxon assemblages in the entirely wrong genus; much less what it did with mixed assemblages. It is no consolation that these can be problem genera when using conventional methods. We hoped to do better, not merely as well (or as poorly) as conventional methods. Identifications were done faster, but not necessarily better or more accurately. The goal of effective, computer-based seed recognition and taxonomic identification has not yet been fully achieved given the limitations of two-dimensional images. For example, a sphere, a hemisphere, and a lozenge all project the same
2007]
ROVNER AND GYULAI:COMPUTER-ASSISTED MORPHOMETRY
two-dimensional, circular shape in binary image and cannot be distinguished. Useful features, such as the location of a rachis attachment, are not observable in the binary image. Threedimensional rotation requires either laborious and time-consuming manual rotation, a process that reduces imaging to one object at a time, or the use of complex and expensive laser imaging. Such problems remain unresolved. As a result, we have suspended our pursuit of this goal until accessible three-dimensional imaging and image processing systems become available. On the other hand, the problems, limitations, and failures that arose in trying to create an object recognition system for seed identification forced us to address aspects of morphological variation in our measurement data. Subsequent study of seed variation using computer morphometry revealed many frankly unanticipated observations that challenged the validity of basic assumptions we initially applied to seed analysis.
Morphometric Study of MorphoFogical Variation in Seed Populations The first problem investigated had to do with the minimum and optimum number of seeds in a representative reference population needed to provide sufficient data to the computer to identify unknown seeds accurately. Montgomery (1977) provided a testable reference standard for seed size, e.g., averages of three separate measurements of 10 seeds each. Computer precision precludes the need for three separate measurements and the speed of data generation readily allows for measuring substantially larger samples. The resulting data were plotted in standard histograms at increasing population sample size intervals to reveal the adequate minimum and the optimum sample sizes of a representative population. Our goal was to determine how many seeds were required to achieve the stable, normal bellshaped (Gaussian) curve that we had assumed would serve as the indicator of an adequate reference standard. Test results proved to be far more complex and interesting than anticipated. We selected seed populations from different species within the genus Pinus obtained from the North Carolina State University (USA) herbarium for the initial study of area measurement. As anticipated, histogram distribution plots of area measurements for the statistically small 10-seed standard in two species of Pinus did not ap-
159
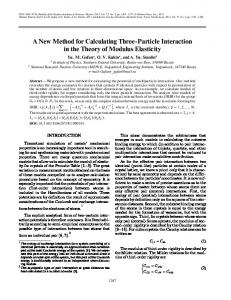
proach a normal, bell-shaped configuration and clearly appeared to be poor representatives for a natural population. However, area plots for populations on incrementally increased sample sizes revealed an unanticipated problem with our assumption. Larger samples did not result in normal distributions. Populations of 50, 100, and more than 150 in both taxa, and one population of more than 200, did not approach normality, appearing non-Gaussian and typically multimodal. The problem was our assumption that seed morphology should correspond to a normal distribution of variation. Inasmuch as a normal bell curve was not achieved, no conclusions regarding adequate representative reference sampling were reached. To verify the initial results obtained from pine seed populations, measurement data for a population (n= 207) of Chenopodium aristatum L. (syn. Teloxys aristata (L.) Moq.) seeds were subjected to incremental study of area measurement distribution. Since the seeds were placed in unstructured groups of 25 or more for imaging and further randomized by the computer arbitrarily numbering individual seeds, the data were considered unbiased and random. Starting with data for the first 10 seeds measured, data for the next 40 seeds (n = 50) were added to the first 10, and so on. Ultimately samples of 10, 50, 100, 150, and 207 were created for a graphic histogram display (Figure 1). The purpose was to determine the minimum sample population needed to achieve an expected normal, bell-shaped distribution. Unexpectedly, all incremental populations provided non-Gaussian, essentially multimodal distributions. Again, the expected bell curve was not achieved. We have since found that nonnormal (i.e., non-parametric) size distributions are present in many, if not all, wild seed taxa and probably should be the expected morphological configuration in seed analyses. Therefore, any untested assumption of a Gaussian size distribution in such seed populations is suspect and may introduce systematic errors in analytical assessment. By extension, exclusive use of parametric statistical tests in assessing seed size data may be inappropriate; previous statistical studies of seeds employing only parametric statistics may be similarly afflicted. The search for an optimum, representative sample size was also tested using a population of 412 seeds from a single gourd of Cucurbita moschata (Duch. ex Lam.) Duch. ex Poir, from
Fig. 1. Test results of histograms of distribution of size (i.e., area) measurements for incrementally increased seed populations of a wild taxon, Chenopodium artistatum (n = 207) to determine an adequate sample assuring a normal, bell-shaped distribution. Histograms of randomly chosen samples of 10, 50, 100, 150, and all 207 seeds were persistently muhimodal, failing to provide an originally expected normal curve. Conventional descriptive statistical summaries were generally insensitive to changes in the configuration of each multimodal curve while morphometric shape factor measurements indicate greater sensitivity to changes in the configuration of the distribution curve. A. (n= 10). B. (n = 50). C. (n= 100). D. (n= 150). E. (n = 207).
2007]
ROVNER AND GYULAI: COMPUTER-ASSISTED MORPHOMETRY
161
Fig. 2. Area size distribution and mean values for standard population sample of 10 seeds compared to total population of 412 seeds taken from a single gourd of Cucurbita moschatavat. Waltham (butternut, winter squash). A randomly selected standard population of 10 poorly represents the parent population in this case. Mean value of the small standard sample occurs far out on the tail of the distribution plot (see arrow) of the larger parent population. A. n = 10; mean = .76cm 2. B. n = 412; mean = .62 cm2.
which a subset of 10 was randomly selected and tested for similarity against the parent population (Figure 2). The distribution histogram, n= 10, was far from normal. The mean value of 0.76 square centimeters (cm 2) and modal value of 0.79cm 2 for the population of 10 were quite different compared to values obtained for the population of 412, plotting rather far out on the tail of the distribution of the parent population (Figure 2). Clearly, this is not an accurate representation of the parent population. At present, we have no firm basis for recommending a minim u m or standard population sample that is confidently representative of a taxon, except to state categorically that a population of l0 is unreliable and clearly inadequate. More concerns arose when computer-generated size measurements--mean, range, minimum, and maximum values--of large seed populations were compared against reference data (Table 1) based
on smaller samples presented in a conventional seed atlas (Schermann 1966). Given the round-tooval nature of most seeds, computer and Euclidean length measurements should be virtually equal or very close. However, in a majority of taxa tested, manual measurements of length and Aspect Ratio (length divided by width or breadth) presented in the atlas were substantially different from comparable computer-generated sizes and variation in larger sample populations. Replication was poor overall. Generally, size ranges of the atlas samples were substantially restricted compared to the size ranges of the larger sample populations measured by computer. The mean size values of several computer-measured populations fell near or beyond, sometimes far beyond, the minimum or maximum value, that is, outside the range of the atlas' populations. For example, the mean length value (by computer) of seeds of Lupinus palyphyllus (n = 106) was .46 centimeters
162 TABLE 1.
ECONOMIC BOTANY
[VOL. 61
COMPUTER MEASUREMENTS OF SEED POPULATIONS VS. REFERENCE ATLAS DATA. 1 COMPUTER-
MEASURED DATA OF GENERALLY LARGER POPULATIONS ARE POORLY REPLICATED BY REFERENCE ATLAS DATA BASED ON SMALLER SAMPLE POPULATIONS. ATLAS DATA SIZE RANGES~ TYPICALLY SMALLER AND MORE RESTRICTED, ARE LESS LIKELY TO BE ACCURATE REPRESENTATIONS IN COMPARATIVE STUDIES OF SEED POPULATIONS. N . B . ATLAS POPULATION SIZE (N) NOT SPECIFIED.
SPECIES
Comus mas Gingko biloba Lupinus polyphyllus Malusgermanica Prunus spinosa Prunus spinosa Sambucus nigra Sambucus racemosa Solanum dulcimara Sorbus acuparia Sorbus domestica Tiliaplatyphyllos Viburnum lantana
Computer (n)
76 4 106 30 21 14 75 79 132 89 28 88 19
Computer LENGTH(ram)
9.69-14.0 21.18-21.90 3.60-5.53 10.4-13.3 11.8-14.3 8.26--10.05 2.81-4.56 3.47-4.94 1.98-2.97 2.97-4.95 6.60-8.75 6.46-12.56 6.44-9.91
Atlas* LENGTH(ram)
11-16 16-20 3.8-4.8 8-12 7-9 3.5-4.5 2.2-3.2 2.2-2.6 3.4-4.8 6-7 7-10 6-7
Computer A' RATIO
1.50-2.50 1.44-1.72 1.10-1.90 1.18-1.55 1.20-1.54 1.09-1.33 1.38-2.40 1.09-1.65 1.00-1.56 1.71-2.55 1.28-1.81 1.00-1.75 1.14-1.71
Atlas*
A' RATIO
2.2-3.0 1.2-1.4 1.5-1.8 (?)-1.8 1.5-1.6 1.8-2.2 1.8-2.2 (?)-1.5 (?)-3 1.4-1.5 (?) 1.1-(?)
1Schermann, S. 1966. A Magismeret Atlasza, Mez6gazdas:lg K6nyvkiadii, Budapest.
(cm), very near the maximum length value (atlas) of .48cm (Table 1). Likewise, Malus germanica seeds (n = 30) resulted in a computer length mean value of 1.19 cm compared to the maximum value of 1.2 reported in the Schermann Atlas. The computer mean length value of .41 cm for seeds of Sambucus racemosa (n = 79) fell substantially outside the atlas range of .22 cm to .32 cm. Such discrepancies predict that nearly half to more than half of randomly recovered populations will measure larger than the published atlas reference value--assuming all these populations have a normal distribution, which is not likely. This only further complicates the problem. In terms of archaeobotanic applications, the reliability of mean size value increase as evidence sui generis of domestication is brought into question. More critically, ranges of variation of computermeasured populations often exceeded, even far exceeded, published data, a result that, frankly, is expected when large samples are compared to inadequately small samples. For example, the length range of one population of Prunus spinosa (n=21), 1.18cm to 1.43cm, fell beyond the atlas range of .7 to .9 cm with no overlap. A second population of P. spinosa (n= 14) overlapped at the high end of the atlas range. Mean values of both populations, 1.3 and .91, respectively, fell outside the maximum of the range reported in the atlas (Table 1). Ranges of variation of Aspect Ratio val-
ues as calculated by computer similarly replicated poorly when compared to atlas data. Mean values and size ranges that vary so substantially between atlas reference data and replicate computer population data will probably vary likewise between reference atlas data and archaeobotanic population data--an obstacle to accurate assessment of archaeological seeds, for example, in distinguishing wild from domestic populations if based primarily on size difference.
Meaningless Mean Values of Size and Shape Measurements of Morphological Variation in Seed Populations The non-Gaussian, multimodal configuration of seed size variation challenged the significance of mean and modal values used pervasively in describing seed populations. In a normal curve, there is one primary mode with the mean and primary modal values usually coinciding. In our multimodal seed size distributions curves, the mean and the primary mode did not necessarily coincide and frequently did not. This raised the questions of what significance these values hold in such distributions and what they represent in comparative analysis of seed populations. The presence of several cases of redundant accessions of seeds from the same species in our database allowed their use as replicate populations
2007]
ROVNER AND GYULAI: COMPUTER-ASSISTED MORPHOMETRY
to test the stability of mean values of seed size and shape. Images of these seed populations had been digitized and similarly measured. Although differences in environmental context existing between replicates were not known, the collection of them in different years from different locations was assumed to incur a high incidence of environmental modulation, which could effect changes in seed morphology. Montgomery (1979:9) suggests that, with regard to environmental variations, seed size will vary while "ratios (of size - the basis of shape factors) are usually constant." Therefore, statistical comparisons of replicate populations were expected to show instability in comparisons of mean size parameters, while stability of mean shape parameters should be maintained, reflecting close genetic control of seed shape in spite of differing ecological contexts. For each pair of the 50 replicate populations, mean values of eight measures of size (400 cases) and 10 measures of shape (500 cases) were compared using the Statview statistical program to test for Unpaired t, a parametric test, and MannWhitney (Wilcoxon), a non-parametric test. As expected, mean values of size were dissimilar in an overwhelming number of cases. O f the 400 size cases tested, only seven--less than 2 % - - p r o vided P values above the 90% confidence level for similarity of the mean. These few are easily attributed to random statistical variation. Contrary to expectation, mean values of shape measurements provided statistically similar results. O f 500 cases of mean values of shape compared by Unpaired t, only 15 (3%) provided P values above 90% confidence levels. Mann-Whitney results were slightly better by a trivial degree and clearly confirmed the results of the first battery of tests. Results of pair-wise comparisons of three replicate populations of seeds from cucumber (Cucumis sativus L.) serve to illustrate the general condition (Table 2). The probability of similarity of the mean was less that one in 10,000 for 17 of 24 cases (71%) of size pairs and 12 of 30 cases (40%) of mean shape pairs. The best single result for a mean size parameter was only 28% probability of similarity and only 55% probability for the best single shape parameter tested. All other cases of size and shape were no better than one chance in four for similarity. These results strongly suggest that mean values of both size and shape measurements are unstable and may be virtually meaningless as representative standards in systematic comparisons of seed population morphology
163
TABLE 2.
U N P A I R E D T - - T E S T RESULTS OF 8 SIZE PA-
RAMETERS
AND
SIMILARITY OF POPULATIONS SEEDS.
10
SHAPE
PARAMETERS
MEAN VALUES IN T H R E E OF
SIMILARITY
(CucuMIS
CUCUMBER OF
THE
FOR
MEAN
IN
THE
REPLICATE
SATIVUS) REPLICATE
P O P U L A T I O N S IS P O O R IN VIRTUALLY ALL CASES FOR ALL 1 8 M O R P Y I O M E T R I C PARAMETERS T E S T E D .
Cucumir sativus (popl, n= 94 : pop 2, n= 94; DF=186) Parameter
Mean Dll~
Area (mm 2) 1.028 Convex Area (mm 2) 0.647 Perimeter (ram) -1.361 Convex Perim. (mm) 0.302 Length (mm) 0.114 Breadth (ram) 0.077 Fiber Length (ram) -0.376 Width (ram) 0.095 Formfactor 0.082 Roundness 0.006 Convexity 0.06 Solidity 0.015 Extent 0.005 Compactness 0.004 Aspect Ratio -0.017 Elongation -0.178 Curl 0.039 Fractal Dim -0.042
t-Value
P-Value
2.337 1.464 -4.14l 1.474 1.079 1.972 -2.228 2.686 9.541 1.177 9.724 10.761 1.529 1.107 -0.575 -3.506 4.851 -9.902
0.0205 0.1449