Instrument System for Sequential Chemical .... (a) The physician-pathologist ... is used o specify analytical procedures. (follow-up tests) based on chemical.
CUN.
CHEM.
24/4.
555-561
(1978)
Computer-Controlled Instrument System for Sequential Testing Ill. Application to Liver Assessment George S. Cembrowski,2’#{176}Frank and E. Clifford Toren, Jr.5
We used the previously (1973)] and evaluated
C. Larson,1’2’3
Robert
described [C/in. Chem. 19, 1114 [Clin. Chem. 19, 1122 (1973)]
computer-controlled instrument system for sequential chemical testing to select and perform tests of hepatic status, to aid the clinician in the diagnosis of liver disease. Results for total bilirubin, aspartate aminotransferase, and alkaline phosphatase obtained from the continuous-flow analysis (SMA 12/60) admission screen were used by the instrument system to determine selectively the values for -y-glutamyltransferase, alanine aminotransferase, creatine kinase, and total and direct bilirubin. Kit methods for the latter four tests were evaluated on the system; results were similar to manual procedures. A software, enzymatic ratemeter was found to be better than the previously described hardware ratemeter. The follow-up tests of serum prescribed by the system are compared to clinician-prescribed follow-up tests and discharge diagnoses. In 10 of 19 cases, the system and clinician ordered similar follow-up tests; in three cases follow-up differed, and in six cases, the system ordered follow-up tests and the clinician ordered none. AddItIonal Keyphrases: liver disease monitoring treatment and its follow up stays by more effective diagnosis
kit methods shortening hospital .
In many hospitals it is a standard procedure to draw blood for a battery of hematological and chemical tests as part of the admission procedure. The survey results are examined later the same day or the next day by the attending physician, who may then order follow-up tests. The cycle of evaluation of tests results by the clinician and the ordering of new tests is repeated until a working diagnosis is made or a satisfactory treatment program decided on. This cycle has been described by Altshuler et al. (1) as the “ping-pong” relationship be-
1
Department
of
Medicine,
2
Department
of
Pathology,
and
Clinical Laboratories, Medical School, University of Wisconsin-Center for Health Sciences, Madison, Wis. 53706. 5 Department of Pathology, University of South Alabama, Mobile, Ala. 36688. 6 Present address: University of Calgary Medical School, Calgary, Alberta, Canada. Present Hospital,
Address Received
address: Madison,
Department Wis.
of Pathology,
53715.
correspondence to E.C.T., Jr. Nov. 11, 1977; accepted Jan. 17, 1978.
Madison
Genera!
W. Huntington,
111,2,3Joseph
Chemical
H. Selilken,
Jr.,4’7
tween the clinician and laboratory. A time delay is inherent in this system, so sometimes a patient may occupy a hospital bed for a long time without treatment. Occasionally the significance of follow-up laboratory results may be obscured by treatment started in the hospital. Altshuler et al. (1) accelerated laboratory diagnosis by instituting the Programmed Accelerated Laboratory Investigation admission option. This system requires a 50-ml blood sample and an admission diagnosis. Twenty-one tests are run on the specimen. A pathologist reviews the results, considers the admission diagnosis, and then orders follow-up tests. This system has several advantages. Among these are: (a) The physician-pathologist adds his expertise to that of the clinician in interpreting the data. (b) This interpretation can be made sooner. (c) Because the admission specimen is used for subsequent tests, there is no need to return to the patient for an additional specimen. (d) Use of the admission specimen eliminates or decreases concern for the effect of treatment on laboratory test results. We believe that in many instances a computer program designed by pathologists could direct the sequential ordering of follow-up tests and thereby even further accelerate the diagnostic process. We designed and briefly tested a program to order and, in fact, carry out follow-up tests for hepatic status via a computercontrolled analytical system described earlier (2-4) (POLAC, a Problem Oriented Language for Analytical Chemistry).8 Paper I described the instrumentation, interfacing, and software of the system (2), and paper II initially evaluated the instrumental performance of the system (3). Further refinements in the system were described (4, 5). This paper describes the ability of the system to selectively generate follow-up tests in the diagnosis of liver 8Nonsdard
abbreviations
used:
POLAC,
Problem
Oriented
Language for Analytical Chemistry; LABLOGIC, Laboratory Logic language; AST, aspartate aminotransferase (L-aspartate:2-oxoglutarate aminotransferase, EC 2.6.1.1); ALP, alkaline phosphatase (orthophosphoric acid monoester phosphohydrolase, EC 3.1.3.1); GGT, ‘y-glutamyltransferase (EC 2.3.2.2); ALT, alanine aminotransferase (L-alanine:2-oxoglutarate aminotransferase, EC 2.6.12); and CK, creatine kinase (EC 2.7.3.2). CLINICAL
CHEMISTRY,
Vol. 24, No. 4, 1978
555
disease. POLAC (2, 4) is used to program analytical procedures and the LABLOGIC language (2,4) is used o specify analytical procedures (follow-up tests) based on chemical data from admission screening. The chemistry survey used in this study was that provided by the standard SMA-12/60 continuous-flow analyzer (Technicon Instruments Corp., Tarrytown, N.Y. 10591).
Methods
and Material
The POLAC System (2-4) is a programmable analyzer capable of most typical clinical chemical analyses. It is programmable at two levels: the medical technologist level for setting up analyses and the pathologist level for implementation of medical logic. A new software ratemeter has replaced the hardware ratemeter previously (3, 4) documented. This ratemeter collects 250 absorbance readings per 30s for periods of 30, 60, 90, or 120 s, the period depending on the magnitude of the absorbance change. A rate calculation is initiated after 120 s or after an absorbance change of 50 mA is measured. The reaction rate is calculated from the slope of the regression line through the absorbance-time data. Chemical
Methods
The chemical tests that were run by the POLAC system to aid in determination of hepatic status included total and direct bilirubin and the enzymes y-glutamyltransferase (EC 2.3.2.2), alanine aminotransferase (EC 2.6.1.2), and creatine kinase (EC 2.7.3.2). Prepackaged kits were used for the enzyme determinations. The bilirubin analyses were performed by accepted methods. The automated chemical procedures were programmed so that they closely resembled the manual procedures. To assess the performance of the automated chemical procedures, we analyzed serum samples both manually and by the POLAC system. Volumes of reagent and serum and order of mixing were identical for the manual and automated enzyme procedures. For the manual methods, serum and reagent were added to the temperature-controlled cuvet (5) with the absorbance monitored on the strip-chart recorder. For ease of analysis the reaction mixtures for the man ual bilirubin assays were mixed concurrently and then transferred to the cuvets. ‘y-Glutamyltransferase was assayed by a method described by Szasz (6). The “C-system GGT kit” was used (lot no. 15794; Boehringer Mannheim, Indianapolis, md. 46250), 0.16 ml of serum being mixed with 2.4 ml of buffer-substrate and the rate of appearance of p-nitroaniline measured at 405 nm. Alanine aminotransferase was assayed by a method of Henry et al. (7) as modified by the Worthington Biochemical Corp. (8). The “Statzyme GPT” kit was used (lot no. 73N379; Worthington Diagnostics, Freehold, N.J. 07728). A volume of 0.16 ml of serum was mixed with 2.24 ml of buffer-substrate and the disappearance of NADH was measured by monitoring at 340 nm. 556
CLINICAL
CHEMISTRY,
Vol.
24,
No. 4, 1978
Creatine kinase was measured by the coupled enzymatic assay system of Oliver (9) as modified by Rosalki (10). The “CPK Stat Pack kit” was used (lot no. 333124; Calbiochem, La Jolla, Calif. 92037). A sample volume of 80 ,il was mixed with 2.40 ml of buffer substrate, and the rate of appearance of NADPH measured at 340 nm. Total bilirubin was assayed by the Jendrassik-Grof procedure (11) as modified by Doumas et a!. (12). Manual bilirubin assays were run with use of sample and reagent volumes identical to those of Doumas et al. Ten minutes was allowed for the azobilirubin color to develop before the alkaline tartrate was added. The absorbance of the final reaction mixture was measured at 600 nm vs. a water blank. The bilirubin assays were calibrated with a lyophilized control (Versatol Pediatrics, lot no. 2018013; General Diagnostics, Division of Warner-Lambert Co., Morris Plains, N.J. 07950). For the automated assay the sample volume was decreased from 0.50 ml to 0.18 ml; reagent volumes were decreased proportionally. To shorten analysis time, the azobilirubin solution was quenched with the alkaline tartrate 3 mm after initial mixing. Nosslin’s (13) method for direct bilirubin was adapted to the total bilirubin method of Doumas et al., 50 mmol/liter HC1 being substituted for the caffeine reagent. Three minutes were allowed for color development, after which 0.1 ml of ascorbic acid solution (40 g/liter) and 3 ml of alkaline tartrate were added (manual assay). As in the automated assay of total bilirubin, the sample volume was decreased from 0.50 ml to 0.18 ml, and the volume of the reagents was decreased proportionally. Diagnostic
Logic
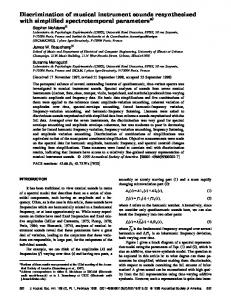
A “decision tree” was developed for the differential diagnosis of liver disease by laboratory tests, which was based on standard references on the subject: Zimmerman (14), Coodley (15,16), Trip eta!. (17), Konttinen et al. (18), Sherlock (19), and Sunderman and Sunderman (20). The logic is seen in the flow chart of Figure 1. If a pure obstructive type of jaundice is indicated by the initial screening survey (high alanine aminotransferase value and low aspartate aminotransferase), a y-glutamyltransferase assay is done. [Other enzymes, notably 5’-nucleotidase (EC 3.1.3.5) or leucine aminopeptidase (EC 3.4.11.1), could be used.] If a pure hepatocellular disease is indicated (low alkaline phosphatase and high aspartate aminotransferase), an alanine aminotransferase assay is performed. Bilirubin fractionation is only done if the value for total bilirubin is abnormally high in the survey. If only aspartate aminotransferase is increased, either creatine kinase (to check for myocardial infarction) or alanine aminotransferase assay, or both, are done, depending on the aspartate aminotransferase activity and the age of the patient.
Results Evaluation Evaluation
of Ratemeter of the POLAC
system
by use of the hard-
Figure
1. “Decision
tree”
for ordering
follow-up
Units for the enzymes are U/liter (37 #{176}C). except for aNcaline for hepatocellular damage. a is re.entry point
tests on the liver-disease phosphatase
whIch
ware ratemeter has been documented (3). It has since been shown to be somewhat electronically unreliable; therefore, a software ratemeter was implemented and was tested by using both electronic and enzymatic signals. Linear ramps (i.e., linear changes in voltage with respect to time) were generated by a standard operational amplifier integrator circuit and measured both by the ratemeter and with a strip-chart recorder. Five replicates were run at six different ramps, which ranged from approximately 2 to 200 mV/mm. The chart rate values were obtained by graphical estimation of the slopes of the recorder traces. The results are presented in Table 1A. These statistical data indicate that the performance of the software ratemeter is equivalent to that of the hardware ratemeter previously described (3). The rate signal generated by the -y-glutamyltransferase assay was measured both by a strip-chart recorder and the software ratemeter (Table 1B). The spectrophotometer produces a 1-V output for 1 A. Under lab-
Table
1. Experimental
are
patients
UI deciliter.
In
on the basis of a chemistry
The unitsfor blllrubln are mgI deciliter.
survey HOD Is an abbrevIatIon
oratory conditions a reasonable estimate of the absolute accuracy of the ratemeter would be 0.8% relative, with an absolute precision of 0.89 mV/mm. The accuracy and precision of the hardware ratemeter previously described (3) were 1.7% and 2.2 mV/mm, respectively. These results indicate that the software ratemeter is better than the hardware ratemeter. Evaluation
of Procedures
Precision was measured at two different levelswithin normal, and greatly above normal-for each different method and compared to the precision obtained manually. Within-run precision was studied by using lyophilized control products. Table 2 summarizes the results. For ‘y-glutamyltransferase and creatine kinase the coefficients of variation of the automated assays were lower than the CV’s obtained from the corresponding manual assays. For alanine aminotransferase the coefficients of variation were relatively large and were due to the
Method
Evaluation
Results
a Rang.,
L.ast-squar.s rgrsslon
Exp.rlm.nl
A B
Software Software
ratemeter
vs. chart
ratemeter
vs.
chart
rate for linear ramps
y
for enzyme-generated
rate
=
auto or
linear .quatlon
1.002x +0.35
y
1.008x-O.19±0.89
± 0.67
No.
Units
manual
mV/mm
2-200
30
mV/mm
2-200
32
0-200
34
0-235
25
points,
n
signal
C
Automated
GGT vs. manual
y
1.000x+1.01
±
D E
Automated Automated
GGT vs. manual
y y
=
F
Automated
total
y
=
1.OOlx+1.11 O.988x +0.39 0.918x +1.70
± 2.35 ± 4.19 ± 1.90
a
The
least-squares
CK vs. manual linear
bilirubin regression
vs. manual equation
is of the form y
=
mx
+ b ± SE where y is automated
m is the slope, b is the y.intercept, and SE is the standard error of the estimate. The units are units n is the number of data points observed within the range.
of
results,
2.43
U/liter U/liter U/liter mg/liter
x is the corresponding
0-600
26
0-120
37
‘standard”
y and x. The range is the approximate
CLINICAL
CHEMISTRY,
or manual
range of results
Vol.
24,
result,
obtained.
No. 4, 1978
557
Table
2. Comparison
of Within-Run
Precision
for Manual
and Automated
Assays Automated
Manual
Test
Control
n
‘y-Glutamyltransferase
WSP-l
15
-y-Glutamyltransterase
METRIX
Alanineaminotransferase Alanine
aminotransferase
Mean
SD
CV
n
Mean
27.1
0.65
2.4
15
27.2
0.32
17
103.3
1.81
1.8
17
101.5
1.10
1.1
WSP-l
15
31.6
1.54
4.9
13
31.0
1.57
5.1
106.8
2.78
2.6
17
106.7
2.62
2.5
1.55
2.1
8
1.25
1.6
6.15
1.9
8
WSP-ll
16
Creatine
kinase
WSP-l
8
Creatine Bilirubin
kinase
WSP-II
8
VERS-l
18
8.3
0.15
1.8
24
VERS-lI
18
15.1
0.30
2.0
18
Bilirubim
74.5
322.6
73.7 323.1
SD
CV
1.2
4.48
1.4
8.9
0.27
3.0
15.7
0.35
2.2
Enzyme units are U/liter. Bilirubin units are mg/liter. Controls were Dade Wis. Soc. Pathol. Control Service, Chemistry, Levels I and II (WSPI and WSPII), lot no. SPXL-3361 and SPXP-531 1, respectively; Metrix Normal Clinical Chemistry Control Serum, lot, no. 5456 (Metrix, Chicago, lii. 60601); and twodilutions of Versatol Pediatrics (VERS-l and VERS-Il), lot no. 2018013 (Dade. Miami, Fla. 33152).
high initial absorbance (1.6 A) of the combined serum buffer-substrate mixture. The electronic noise at that absorbance was considerably higher than the noise for absorbances less than 1 A. After reconstitution, the creatine kinase deteriorated very rapidly. Hence only eight replicates were measured for the manual and automated comparisons. Because the manual total bilirubin assays were run almost parallel in sets of 10, with 30-s timing intervals, the precision of the manual bilirubin technique was better than that for the automated sequential assay. Because the direct and total methods were so similar, their precision and accuracy were thought to be about the same. Hence, we did not assess the precision and accuracy of the direct bilirubin method. Overall, the precisions of the automated methods are equivalent to the precisions of their manual counterparts. Statistically significant measures of long-term precisions are not available. Comparisons
on Patients’
Sera
Split samples of patient sera were assayed both by manual and automated methods. Because of an insufficient numbers of serum samples containing abnormal creatine kinase and alanine aminotransferase activities, reconstituted “Hyland Multienzyme C” (lot no. 3057G001A1) was added to some patients’ serum samples. The patient-comparison data were plotted and analyzed by use of linear regression (21), as illustrated in Table 1. The performance of the automated enzyme assays as compared to that of the manual procedures is acceptable; the intercepts are small and the slopes are close to unity. Total bilirubin, on the other hand, has a relatively large nonzero intercept and a slope (0.918), quite different from unity. The nonzero intercept was caused by a blank problem in the automated assay. The automated bilirubin analysis was run 10 times with saline replacing the serum. An average blank measurement of 8.6 ± 0.17 mA was obtained and corresponded to a bilirubin concentration of 1.1 ± 0.2 mg/liter. The value of the slope was attributed to the difference in waiting times for color development (3 mm vs. 10 mm for the automated and manual technique, respectively). We 558
CLINICAL
CHEMISTRY,
Vol.
24, No. 4, 1978
used blanks and “Versatol Pediatrics” control sera to calibrate the automated assay and to overcome the problems of a nonzero blank and a nonunity slope. Off-line
Evaluation
Data on patients’ liver biopsy (kindly provided by Dr. Stanley Goldfarb, Department of Pathology, University of Wisconsin) were analyzed off-line to evaluate the liver decision tree. Values for aspartate aminotransferase, alkaline phosphatase, and total bilirubin were known for all patients. One of us (R.W.H.) specified follow-up tests for 43 of these patients. The same data were analyzed with the decision tree. The follow-up tests required by the two different procedures were then compared. When the biopsy data were analyzed off-line with the decision tree, 19 additional tests, 13 y-glutamyltransferases and six alanine aminotransferases, were ordered. The follow-up tests were identical, except in two cases, with those suggested by R.W.H. For those cases, R.W.H. requested no follow-up test, but the liver decision tree requested values for y-glutamyltransferase. On-line
Evaluation
Serum samples with high survey aspartate aminotransferase, alkaline phosphatase, or total biirubin were selected for sequential on-line analyses. Nineteen samples were run through the system and were followed-up with creatine kinase, alanine aminotransferase, ‘y-glutamyltransferase, bilirubin fractionation, or no test. Control sera were run to assure the quality of the test results, one control for every five or six patient samples. Of 19 patients, 14 had their follow-up tests done on serum remaining from their admission screen. The other five had follow-up tests done on serum from their next chemical survey, collected no more than two days after admission. Results of the follow-up tests are presented in Table 3. The screening values for aspartate aminotransferase, alkaline phosphatase, and total bilirubin are included if they were abnormal. Follow-up tests, both by system and physician, are shown as well as principal discharge diagnoses and drugs used prior to admission.
Table AST,
ALP,
0/
0/
liter
liter
Pt, Nm
Aae
1
33
F
2
45
U
118
3
30
H
82
Sex
Total bilir,,bin
314
3. Results Followup tests ordered by system
of the Online
Follow-up
Follow-up
Disease
tests
ordered
by
Principal diagnosis
nhwiei.n
Lymphoina to abdomen
GOT
GGT-l25
for Hepatlc
CK-429
discharge
with
Drugs used to admission
spread
X-ray therapy2, vincristine,
Carcinoma of colon with metastasis to abdomen Cell mediated ininunity
prior
cyclophosphainide’ prednisone
.2,
5-Fluorouracil Steroids,
transfer
factor
138 syndrome
4
57
F
112
261
5
73
U
103
125
ALT-17
LD CE?
6
52
H
39
155
GGT263
GOT
7
68
U
89
573
GGT8O
Acid tase
Phospha-
Carcinoma metastasis
8
72
H
156
GGT-18
Acid tase,
Phosphaamylase
Abdominal pain, renal Stone
paraplegia,
9
33
F
112
Psychoneurosis, pelvis
fractured
10
66
U
36
177
11
32
U
172
180
12
47
N
151
178
13
71
F
Obesity, ,
ALT, GOT
GGT-24’
GOT
Carcinoma alcoholism
ALT51*
ALT
Chronic pulmonary
ALT-28’
ALT,
pain
Ethanol2
(4-8
leukemia. derma-
Digoxin, (6 drinks
furosemide, daily)
of prostate to bone
of
with
Ethanol2
24
U
15
33
F
16
69
N
30.1
17
24
U
55
18
42
F
78
19
37
F
128
(large
of
Thyroxine,
X-ray (2-3
uterus
therapy drinks
161
00T276
Depression, seizures,
159
001-39
Carcinoma diabetes ureteral
of colon, mellitus, obstruction
LD_
Depressive (suicide
Neurosis attempt)
(lOT
Carcinoma metastasis
of breast to liver,
with bone
Cyclophosphamide1 5-fluorouracil, vincristine
CX
Carcinoma metastasis
of breast to bone
with
Vincristine, 5-f luorouracil,
A missing result for aspartate aminotransferase, that the attending physician had ordered the same 15. tipper limits of normal for the follow-up tests creatine kinase, 52 U/liter for females, 86 U/liter transferase (ref. 23). The result for direct bilirubin
alanine
aminotransferase, of normal for
test.
Limits
are:
-y-glutamyl
and
total
transferase,
for males; direct bilirubin, 4.0 for patient no. 14 should read
It can be seen that in six cases the system ordered the same test as did the physician. In two cases neither the system nor the physician ordered any follow-up. For patient 17 the system did an alanine aininotransferase assay; the physician ordered an LD5, the “liver” chromatographic fraction of lactate dehydrogenase (L-lactate:NAD oxidoreductase, EC 1.1.1.27). Both are indicators of hepatic status and may be regarded as roughly equivalent (22). Thus for nine-i.e., about half-of the patients the system and the physician acted similarly. For six other patients the system ordered tests, the physician none. In three other cases, system follow-up differed from physician follow-up. Two physicians (R.W.H. and J.H.S.) reviewed all the patients’ charts and attempted to appraise the worth of the follow-up to the patient. They concluded that in
indicates
aminotransferase
30
U/liter
mg/liter.
‘6.0
for
females
can elevate mg/liter.”#{149}
(8
drinks
2 , ethanol weekly)
Diphenylhydantoin’ thioridazine2,
psychomotor tremor
bilirubin
aspartate
spirin1’2,
ethanol2
Acute hemiparesis, etiology unknown
ALT15
1
daily)
mild
Direct bilirubin 0.6
178
digoxin, phenacetin (1 drink
active hepatitis. embolism
Carcinoma
ALT-42
daily) ethanol2
quantities)
X-ray therapy2, antacid, ethanol
ALT-158 14
drinks
Meperidine,2aspirin1’2, flurazepan ‘ , codeine, glutethimide. ethanol2, daily)
lung,
Hypothyroidism, acute alcoholic hepatitis, diabetes mellitus
GOT
CK-65,
122
back
myelogenous peptic ulcer,
Minimal cirrhosis, atrial fibrillation, chronic obstructive pulmonary disease
ALT-37
15.9
low
Acute acute titis
2
2, primidpn. amitriptyline
Ethanol2
(1
drink
daily)
Overdose
of
ethanol2,
partial
that were
46
the
result
0-35, U/liter
alanine
was within alanine
for
males;
2 prednispn, methotrexate
methotrexate’ megestrol
normal
range.
alanine
.2,
Asterisks
0-110,
aminotransferase
aminotransferase;
barbiturates2
() signify total bilirubln
aminotransterase. 2
39 U/liter;
can elevate aspartate
amino-
spite of the further information about hepatic status, both the therapy and outcome would not have been affected. A notable exception might have been patient 13, a 71-year-old woman who presented at University Hospitals for further x-ray therapy for uterine cancer. Her admission screen showed an abnormal result for aspartate aminotransferase, 122 U/liter. Two weeks earlier and two months later her aspartate aminotransferase results were within normal limits. The pathologists thought that the aspartate aminotransferase should have been followed to rule out a myocardial infarction. System follow-up of the creatine kinase and aspartate aminotransferase indicated that the increase in aspartate aminotransferase was probably attributable to enzyme from the liver, not from the heart. There was no comparable physician follow-up. CLINICAL
CHEMISTRY,
Vol.
24,
No. 4, 1978
559
Discussion Our results indicate that the instrumentation and software described earlier (2-4) can do automated sequential chemical testing with acceptable accuracy and precision. This system proceeds without human intervention once it has been presented with a specimen and the results of the admission tests. The system (a) can analyze specimens for particular contituents and (b), based on the known laboratory test values of the specimen, can proceed with further tests, and (c) can continue iteratively until (in principle) the analytical potential of the specimen is exhausted. This is the principle of automated sequential testing. The objective of this work is to provide the physician with additional, relevant, and timely laboratory data as soon as possible after his patient is admitted. Based on the results of the admission test battery and, subsequently, the results of follow-up tests, the system selects and performs additional tests one at a time until it derives all the diagnostic information from the specimen. This approach to laboratory diagnosis contrasts with the trend toward larger initial batteries with use of multichannel instruments. The modern clinical laboratory can provide hundreds of different tests. Until quite recently, the clinician, after completing his examination of a patient, decided which test to order to assist him in the diagnosis. In recent years there has been an increasing tendency to provide the physician, in advance of his examination, with certain laboratory data that he is likely to request. By anticipating these laboratory requests, the time required for a diagnosis is shortened, the hospital stay is abbreviated, treatment is initiated sooner, and medical costs are reduced. The most popular approach used to accomplish this purpose is to use admission screening batteries. The selection of the tests to be included in these batteries has been based on (a) tests most frequently affected by common disorders, (b) the probability of detecting a disease not likely to be diagnosed during a history or physical examination, and, to some extent, (c) the ease with which the analysis can be automated. The number of tests to be included in such batteries is (or should be) limited by cost-benefit considerations. It is not possible to do all of the many hundreds of tests offered by clinical laboratories; yet, if there exists in a patient a certain disease that can quickly be recognized from results of the appropriate test, the procedure most certainly should be performed. The system described here was conceived with this dilemma in mind. How can we seek out the important abnormal tests while at the same time avoid the expense of doing all possible tests? The approach to the solution offered here is to use information gained from an initial battery of tests to decide which tests should be added to further define the nature of the disease. It is believed that many, if not most, of the decisions that are made in selecting test sequences can be programmed into a computer, thus increasing the decision (and analytical) rate while decreasing the cost. 560
CLINICAL
CHEMISTRY,
Vol.
24,
No. 4, 1978
One extreme might be to do a profile of about 100 tests and sort out the relevant information, as opposed to starting a sequence as described with one or two carefully selected tests. In any event, it is clear that not all tests can be done and that a sequence or any other logic scheme would operate best with more input data than one or two tests. The work described in this paper was based on 12 tests. More research in sequential testing is required to find the optimal test input. University Hospitals is primarily a referral center with secondary-care and, in many cases, tertiary-care patients who have been previously diagnosed and treated. The system would work better and would provide the physician with more relevant information in a primary-care center in which the patient is first seen and not likely to be already diagnosed or to have already been placed on treatment, e.g., a drug regimen that may interfere with laboratory tests. The decision-making logic described in this paper has the virtue of being relatively simple, easily understood, and readily implemented on a mini-computer; however, it also is too simplistic. A more sophisticated patternrecognition scheme, either probabilistic or a priori, is required with a larger data base, because, as illustrated in Table 2, the computer system may be considered guilty of ordering too many tests. It, unlike the physician, has no access to the results of the physical examination or the patient history. It does not know that the patient has been previously diagnosed, or, for example, that there is a history of alcoholor drug-abuse, or that the patient is on a hepatoxic drug regimen. The system should and could have more interaction with and external control from the physician and the laboratory to make it more effective. This work was mainly supported by NIH Grant No. GM-10978 and in part by grant GM-244521. The assistance of the personnel of the Clinical Laboratories, Stanley Goldfarb, and J. LeRoy Sims is gratefully acknowledged.
References 1. Altshuler,
C. H., Bareta, J., Carfaro, A. F., et al., The PALl and the Crit. Rev. Clin. Lab. Sci. 3,381(1972). 2. Toren, E. C., Jr., Carey, R. N., Cembrowski, G. S., and Schirmer, J. A., Computer-controlled instrument system for sequential clinical chemical testing. I. Description of instrumentation and system features. Clin. Chem. 19, 1114 (1973). 3. Toren, E. C., Jr., Mohr, S. A., Busby, M. G., and Cembrowski, G. S., Computer-controlled instrument system for sequential clinical chemical testing. H. Evaluation of instrumental performance. Clin. Chem. 19, 1122 (1973). 4. Cembrowski, G. S., Cottrell, D. B., and Toren, E. C., Jr., POLAC, a problem oriented language for analytical chemistry. Comput. Chem, 1,45 (1976). 5. Busby, M. G., Cottrell, D. B., Cembrowski, G. S., and Toren, E. C., Jr., A versatile temperature-controlled reaction cuvet. Clin. Chem. 21, 1175 (1975). 6. Szasz, G., A kinetic photometric method for serum y-glutamyl transpeptidase. Clin. Chem. 15, 124 (1969). 7. Henry, R. J., Chiamori, H., Colub, 0. J., and Berman, S., Revised SLIC
systems.
spectrophotometric
oxalacetic transaminase, acid dehydrogenase.Am.
methods
for
the
glutamic-pyruvic J. Clin.
8. Procedure manual, Statzyme Corp., Freehold, N. J., 1972.
Pathcil,
GPT,
determination
transaminase 34, 381 (1960). Worthington
of
glutamic-
and
lactic
Biochemical
9.
Oliver,
of creatine (1955).
I. T., A spectrophotometric
phosphokinase
and
method myokinase.
for the Biochem.
10. Rosalki, S. B., An improved procedure for serum phokinase determination. J. Lab. Clin. Med. 69,696 11. Jendrassik, L., and Methoden zur Bestimmung (1938).
determination
J. creatine (1967).
61, 116 phos-
Grof, P., Vereinfachte photometrische des Blutbilirubins. Biochem. Z. 297, 81
17. Trip, J. A. J., van Dam, H., Eibergen, R., and Que, G. S., Investigations on correlations between serum enzymes and histological findings in liver disease. Acta Med. Stand. 193, 113 (1973).
18. Konttinen, hepatobiliary
A., Hupli, V., and Salmenkivi, K., The diagnosis of diseases by serum enzyme analyses. Acta Med. Scand.
189, 529 (1971). 19. Sherlock, S., Diseases of the Liver and Biliary F. A. Davis Co., Philadelphia, Pa., 1968.
System,
12. Doumas, B. T., Perry, B. W., Sasse, E. A., and Straumfjord, J. V., Jr., Standardization in bilirubin assays: Evaluation of selected methods and stability of bilirubin solutions. Clin, Chem. 19, 984
20. Sunderman, F. W. and Sunderman, F. W. Jr., Eds., Diagnosis of Liver Diseases, W. H. Green Inc., St.
(1973).
1968.
13. Nosslin, B., The direct reaction of bile pigments in serum. Experimental and clinical studies. Scand. ,J. Clin. Lab. Invest. 12, SuppL 49 (1960). 14. Zimmerman, H. J., in Clinical Diagnosis by Laboratory Methods, 15th ed., I. Davidsohn and J. B. Henry, Eds., W. B. Saunders Co., Philadelphia, Pa., 1974, pp 804-836.
21. Westgard, J. 0., and Junt, M. R., Use common statistical tests in method-comparison 19,49 (1973).
15. Coodley, E. L., Enzyme troenterol. 56, 413 (1971).
16. Coodley, Philadelphia,
E. L., Ed., Pa., 1970.
diagnosis
Diagnostic
in hepatic Enzymology,
disease. Lea
J. Gas& Febiger,
4th ed.,
Laboratory Louis, Mo.,
and interpretation studies. Clin.
of Chem.
22. Nathan, L. E., Jr., Feldbruegge, D., and Westgard, J. 0., Application of an automated determination of isoenzyme-5 of lactate dehydrogenase to the diagnosis of hepatic disease. Clin. Chem. 19,1036 (1973). 23. Young, on clinical issue.
D. S., Pestaner, laboratory
L. C., and Gibberman, tests. Clin. Chem. 21,
CLINICAL
CHEMISTRY,
V., Effects 1D (1975).
of drugs Special
Vol. 24, No. 4, 1978
561