Computer Generated Transformer Zones as Part of. Township Electrification Design Software. Thurairajah Rajakanthan, Alan S. Meyer, and Barry Dwolatzky.
IEEE TRANSACTIONS ON POWER DELIVERY, VOL. 15, NO. 3, JULY 2000
1067
Computer Generated Transformer Zones as Part of Township Electrification Design Software Thurairajah Rajakanthan, Alan S. Meyer, and Barry Dwolatzky
Abstract—To assist with the large scale rural electrification program in South Africa, special CAD based software is being developed for the design process. A new tool is presented to further reduce design time. Manually delineating suitable distribution transformer locations and their service areas (transformer zones) is still a time consuming activity. Delineation of optimum transformer zones, minimizes cable lengths and improves transformer utilization. The software routine described in this paper, delineates such transformer zones rapidly producing near optimum solutions. This module can be used to speedily investigate various alternative design strategies. Testing has been done on real maps and the final layouts were found to require only minor adjustment. Software cannot ever produce completely acceptable solutions due to the complexity in township layouts. A sample computer design is presented and discussed. Index Terms—Optimization software, rural electrification design, transformer zones.
I. INTRODUCTION
T
HE ELECTRIFICATION drive in South Africa presently connects approximately a 1000 consumers a day. Most of these newly connected consumers earn minimum wages and therefore their energy consumption is low. Thus, the time taken to recover the electrical infrastructure costs is excessive. Skilled labor and time is necessary to optimize designs so that capital and running costs can be reduced. The SED (Software for Electrical Distribution) Group at the University of the Witwatersrand has for a number of years been involved in the development of software modules that optimize various aspects of rural distribution design [1]–[3]. The ultimate goal of this group is to develop an integrated software package, called ASED, that can rapidly produce optimum designs with minimum user intervention. ASED stands for Automated Software for Electrification Design. This paper discusses a new module that will further reduce design time. Manually, determining optimum transformer locations and service areas is a time consuming activity. Optimized transformer locations and service areas will minimize cable lengths and maximize transformer utilization. Furthermore, as the size of the township increases, the time taken to manually delineate cost effective zones increases exponentially. Computer routines for determining the optimum location of distribution transformers exist but most of them require the Manuscript received December 28, 1998; revised November 9, 1999. T. Rajakanthan is with Technical Support/Software Development, Terrain Software Systems (Pty.) Ltd., Johannesburg, South Africa. A. S. Meyer and B. Dwolatzky are with the Department of Electrical Engineering, Witwatersrand University, Johannesburg, South Africa. Publisher Item Identifier S 0885-8977(00)08135-8.
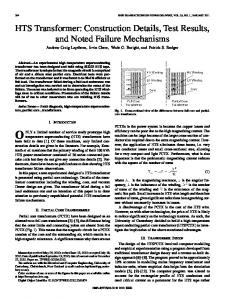
Fig. 1. Square extraction process [17].
specification of potential sites from which the most suitable are found [4]–[10]. In urban areas, the potential sites are well established through master developmental plans. However, in rural areas there are many feasible locations especially since pole-top transformers are used extensively. Some of these techniques require additional data such as possible feeder networks [4], [5]. This level of information is not readily available and it will be time consuming and expensive to generate. In some cases, a constant consumer density throughout the township is a prerequisite [11]. Most townships in South Africa do not satisfy this prerequisite. A comparative evaluation done by Willis et al. [12] of some techniques lead them to the conclusion that some sitting models had an upper limit of 25 transformers. There are many townships in South Africa where significantly greater number of transformers are required. A further criticism on some of the previous work was that optimization was based on models linearized from nonlinear cost functions [10]. Sumic et al.’s work takes into account various parameters in the definition of zones including the street layout, but operates within one GIS environment [13], [14]. The level of information required for this algorithm is enormous and the pre-processing required would be labor intensive. In the majority of the cases, GIS maps are not available in South Africa. Artificial Intelligence (AI) [15] and expert system (ES) techniques [16] for load allocation and expansion planning were found to be unsuitable for domestic design requirements. Grimsdale et al.’s [17] algorithm was found to operate with minimum data and did not require the specification of potential transformer sites. Initial transformer positions are calculated using an approximation procedure which ignores the road layout. This is accomplished by first breaking up the town into small squares as shown in Fig. 1(a). Then the specified number of square blocks (representing the transformers that would be used) are placed within the shape of the township starting from the bottom right [Fig. 1(b)]. The sizes of the blocks are increased sequentially until all the blocks can be just contained within the
0885–8977/00$10.00 © 2000 IEEE
1068
IEEE TRANSACTIONS ON POWER DELIVERY, VOL. 15, NO. 3, JULY 2000
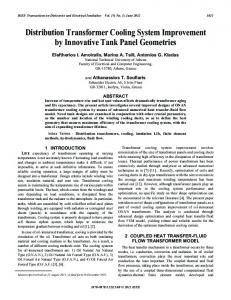
township as shown in Fig. 1(c). The centroid of each block is assumed to be the initial position of the transformer. Every consumer is then allocated to the nearest transformer, using the straight line (shortest) distance principle. Better positions are located by moving the transformer from the approximate initial position to the calculated center of gravity of load for each zone. Every consumer is then reallocated to the nearest transformer and new centers of gravity are calculated for each zone. This process of consumer allocation and movement of the transformer to the centroid of that allocation is repeated until there is no significant difference in transformer positions for two successive iterations. When this algorithm was tested, it was found that it required a fairly uniform consumer load density which is not typical of rural areas. Results produced by this technique are not suitable for domestic requirements for the following reason. To minimize capital and maintenance costs when designing low cost schemes, minimum number of transformers are used, often loaded to their maximum rated capacity. In urban areas, overloading is not an issue as large transformer are always used. Nevertheless, Grimsdale’s algorithm was considered a good starting point from which further techniques can be developed to advance the solution to an acceptable stage. This paper focuses on the development of those techniques. The solution could have been advanced using either an AI/ES or an algorithmic technique. AI/ES techniques were found to be unsuitable. “An AI or ES technique can provide a satisfactory solution but it does not guarantee an optimal solution. If an algorithm exists that optimizes the solution, use it” [18]. The algorithmic technique developed is not based on any linearized function. II. INITIAL TRANSFORMER ZONING PROCEDURE Prior to the delineation of transformer zones the following parameters have to be established. 1) The ADMD (after diversity maximum demand) for the township. The ADMD represents the statistical simultaneous demand of all the consumers in a township. 2) Transformer and its rating. It is common practice to use a single sized transformer and other sizes are used only in cases where it is economically justifiable. 3) Maximum zone limit. This is the absolute maximum number of consumers allowed per transformer. For delineating transformer zones, the location of every consumer and their respective load is required. This information is extracted from a database [19] created for use by ASED. This database assumes that the location of the load point coincides with the location of the text labels indicating the land parcel numbering on the original map. The algorithm proposed by Grimsdale et al. [17] is firstly executed. An example is given in Fig. 2 of a township with just over 1100 consumers (represented by each dot) and 8 transformers with their respective zones. Dashed lines are used to represent the roads in the township. The township is approximately 2.7 km in width and 2.3 km in length. Superfluous map information has been deliberately omitted as they only clutter the map. The number of consumers allocated within each zone
Fig. 2.
Map of Township after execution of Grimsdale’s algorithm.
is displayed. A small “ ” symbol is used to represent the idealized transformer locations. It can be seen that the zones delineated using Grimsdale’s algorithm are all approximately uniform in area. In a township with varying load densities, this results in a vast difference in consumers allocated per transformer as can be seen from Fig. 2 , standard deviation ). (avg III. THE SCANNING ALGORITHM The scanning algorithm was developed with the intention of re-allocating consumers from overloaded zones to others so that all transformers become evenly loaded. An assumption here is that the transformers being used will be of uniform rating. (Standardized transformer sizes are preferred since costs do not vary significantly with size and there is no problems with availability.) The basis of this algorithm is that it uses a heuristic approach to minimize the following objective function without violating the zone limit (ZL). The zone limit represents the maximum number of consumers that can be contained within each transformer zone. TCL
for
zone limit
(1)
Where –( ) position of transformer , –( ) position of customer , – number of transformers, – number of consumers for a particular zone, – represents the scalar distance between and . TCL in (1) is defined as the sum of all the straight line distances from each transformer to every consumer assigned to it in meters. This function is formulated on the logic that when the TCL is minimized for a given number of transformers, the distance to all the consumers has been minimized. Actual road routes are ignored, since informal townships typically have well interconnected pathways. A “sweep” is an iteration of the scanning algorithm. Theoretically, a sweep can take place in any direction. However, for simplicity, the sweeping was restricted to the positive and negative directions along the and axis (total of four directions). The algorithm is described below for the case when it is “sweeping” to the right. The “ ” symbol is used to represent the transformer locations.
RAJAKANTHAN et al.: COMPUTER GENERATED TRANSFORMER ZONES AS PART OF TOWNSHIP ELECTRIFICATION DESIGN SOFTWARE
1069
Fig. 3. Line AB “sweeping” to the right.
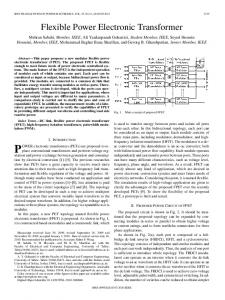
The imaginary line AB shown in Fig. 3 moves to right and transformers are processed in order as it makes contact with that line. When an overloaded transformer is encountered the following steps are executed: 1) All transformers located within 1.3 times the distance of the nearest transformer, on the right hand side of this overloaded transformer, are identified (regardless of whether they are overloaded or not). A radius multiplier of 1.3 was intuitively selected and proved adequate in selecting suitable transformers. 2) The consumer that measures the shortest distance to one of the selected transformer is re-assigned. 3) The previous step is repeated until the transformer being processed has shed all the consumers who were overloading it. The next overloaded transformer is identified and the above procedure is repeated. By transferring consumers from one transformer zone to another, the consumer allocations will eventually even out. New centers of gravity for all zones are calculated at the end of the sweep. The flowchart for the sweeping algorithm is given in Fig. 4. Load re-allocation can sometimes be accomplished with a single sweep in one or more directions. However, in cases where the zone limit approaches the average, several sweeps may be necessary to converge at a solution. Since multiple sweeps may be necessary, a means of selecting the best direction for every sweeps was required. Such a means would lead the program along the most “promising” path and avoiding the combinatory explosion which would otherwise result. This is accomplished by performing simulation sweeps in all four directions which allows the total number of overloaded consumers to be calculated at the end of every sweep. The direction that resulted in the least number of overloaded consumers is selected for the actual sweep. This is then regarded as the starting point for the subsequent sweep. The process is repeated with the simulations sweeps followed by the actual until a solution is reached, whereby there are no zones with overloaded consumers. A simplification rule is that there cannot be two successive sweeps in the same direction. Often, there may be more than one minimum in the number of overloaded consumers after the simulation sweeps. When this occurs, the TCL is evaluated to determine the best direction for the actual sweep. The TCL after the execution of Grimsdale’s
Fig. 4.
Algorithm for a single “sweep.”
algorithm is taken as the reference. The direction with the least increase in TCL is considered the best direction for the actual sweep. The flowchart for the scanning algorithm as a whole is given in Fig. 5. IV. ZONE REFINEMENT PROCESS An inherent flaw in the sweeping algorithm when multiple sweeps are executed is that it results in the severe distortion of the transformer zones. This results in consumers being assigned to transformers that are not the nearest. An algorithm was evolved to improve the consumer assignment and its basis of operation is described briefly. Assume that there are two consumers at positions and who are allocated to transformers at and , respectively. If the mathematical condition in (2) is true for the specified positive scalar distances: (2) then the allocations are swapped so that the consumer at is while the consumer at is supplied by the transformer at supplied by the transformer at . This routine does not alter the number of consumers allocated per zone, since consumer assignments are being swapped. Once again, the percentage increase or rather decrease in TCL with respect to the reference will be used to measure the degree of improvement. The refinement algorithm was found to produce notable improvement to the TCL and a significant improvement to the transformer zones that were delineated.
1070
IEEE TRANSACTIONS ON POWER DELIVERY, VOL. 15, NO. 3, JULY 2000
Fig. 6.
Fig. 5. Scanning algorithm.
V. COSTING FORMULA The ability to determine the optimum number of transformers required for a particular project is useful to a designer. Increasing the number of transformers used does not necessarily increase the cost but may result in a decrease since shorter cable runs will then be required. A nonlinear relationship was empirically found to exist between the TCL and the actual feasible conductor distances for varying zone limits. In order to model this relationship, several secondary designs were actually done on a typical informal township with varying zone limits. For each of those cases, the TCL and the actual conductor route distances were recorded. The derivation of the TCL correction factor (TCLCF) was based on the data gathered and is shown in (3). TCLCF (3) The TCL must be divided by the TCLCF to obtain a better estimate of the feasible conductor distance for a particular Zone Limit (ZL). The costing formula (4) incorporates this relationship and was used to estimate the Total Project Cost (TPC). The first component in the formula is for estimating the cost of the secondary while the second component accounts for the transformer and primary feeders. TPC
TCL TCLCF(ZL)
Where LVCCF TCF
LVCCF
XFRS(TCF MVCCF) (4)
Low voltage cable cost factor Transformer Cost Factor
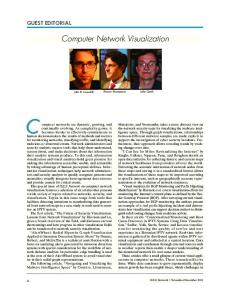
Graph of cost vs number of transformers.
MVCCF Medium voltage cable cost factor XFRS Number of transformers The TCF constitutes the actual cost of the transformer, its associated fittings and labor in South African Rands (SAR). An additional fixed fee in SAR is added to the cost of the transformer to represent the cost of the typical length of the MV cabling (MVCCF) and pole fittings required to feed that transformer. Once the cost of the transformers and the MV cabling have been accounted for, the remaining cost of the scheme must clearly be for the low voltage cabling and associated street furniture. The low voltage cable cost factor (LVCCF) was empirically determined so that the total project cost would be similar to an actual designed electrification layout. The LVCCF is in SAR per meter and is an average figure that accounts for the pole costs and a variety of different conductors that are typically used for feeders and service connections. A systematic investigation can then be done starting from the minimum number of transformers required to the maximum, with the specification of the average zone limit for each run of the program. Although a higher zone limit can be specified, the factor that accounts for the relationship between the TCL and the feasible routes in the formula is valid only for the average. The user is then presented with a curve of the results and the one for the sample township is given in Fig. 6. In this example, the effect of 6–60 transformers starting from a zone limit of 186–19 was explored. The user can then closely examine a few of the minima and choose the one deemed best conforming to some criteria practiced by that particular drafting office. An example of a good design as calculated by the software is ). given in Fig. 7 which was 8 transformers (avg The following empirically determined factors were used and are applicable to most rural areas in South Africa: LVCCF TCF MVCCF
SAR/m SAR/transformer SAR/transformer
VI. EVALUATION OF PROGRAM Comparing the differences in TCL between Grimsdale’s and the scanning algorithms, a notable difference can be observed between the two depending on the size of township. Generally, as the size of the township increase, the difference in TCL decreases. For the sample township, there was a 1.8% increase in TCL. Despite the increase in TCL, the fact that must be established is that the zones delineated and the transformer locations identified using the proposed technique has minimized the TCL without exceeding the specified zone limit. This implies that the transformer utilization is maximized in conforming to
RAJAKANTHAN et al.: COMPUTER GENERATED TRANSFORMER ZONES AS PART OF TOWNSHIP ELECTRIFICATION DESIGN SOFTWARE
1071
REFERENCES
Fig. 7. The best transformer zone layout.
the designer’s criterion. In satisfying this requirement, this program makes an indisputable solution advancement to the one proposed by Grimsdale. It was found that the TCL may be further reduced if this technique is applied to maps in their inverted and/or rotated state. Using the proposed transformer zones as a guide, a designer is expected to make some modifications to arrive at an acceptable layout. These modification can be done only after a detailed site visit. The best transformer location proposed may not be viable as it may be within a consumer’s premises. At present, the user will be required relocate the transformers to viable locations. Another limitation is that only a single sized transformer can be position for a single execution of the program.
VII. CONCLUSIONS A module is presented for rapidly delineating a first draft of transformer zones given the required number of customers per zone. This tool can be used to suggest the number of transformers that would provide the cheapest total project cost. The most notable feature is that it produces results with minimum information. The transformer zones produced require minor modifications to create acceptable solutions to satisfy design requirements in South Africa. The tool is equally usable in any large scale electrification projects in developing countries. In the developed world, it is believed that the use of this tool would be restricted to special applications such as new large scale urban housing projects. The objective function proposed is based on spatial minimization which ignores all obstacles and land parcel boundaries. Consequently, the transformer locations and zoned determined are idealized. The typical existence of well interconnected pathways ensures that the feasible conductor routes evolved from the suggested transformer positions are sufficiently near optimum. Tests done so far indicates that distribution design time can be significantly reduced by the use of this tool especially for large regions that have well over a 1000 consumers. It has been difficult, however, to show that cheaper designs can be produced. This module relieves the user of a laborious task and will prove valuable if it is fast and ensures that the degree of user intervention required is low.
[1] A. S. Meyer and B. Dwolatzky, “The effective computer generation of designs for township electrical distribution,” in Proceedings of the IEEE Power Engineering Society. Dallas, TX, September 1991. [2] N. A. West, B. Dwolatzky, and A. S. Meyer, “Terrain-based routing of distribution cables,” IEEE Computer Applications in Power, vol. 10, no. 1, p. 42, January 1997. [3] J. Apostolellis, B. Dwolatzky, and A. S. Meyer, “The evolution of CADbased optimization tools for distribution network design,” IEEE Africon, vol. 1, p. 496, September 1996. [4] D. M. Crawford and S. B. Holt, “A mathematical optimization technique for locating and sizing distribution substations, and deriving their optimal service areas,” IEEE Transactions on Power Apparatus and Systems, vol. PAS-94, no. 2, March/April 1975. [5] D. L. Wall, G. L. Thompson, and J. E. D. Northcote-Green, “An optimization model for planning radial distribution networks,” IEEE Transactions on Power Apparatus and Systems, vol. PAS-98, no. 3, May/June 1979. [6] , “A branch and bound model choosing optimal substation locations,” IEEE Transactions on Power Apparatus and Systems, vol. PAS-100, no. 5, May 1981. [7] D. I. Sun, D. R. Farris, P. J. Cote, R. R. Shoults, and M. S. Chen, “Optimal distribution substation and primary feeder planning via the fixed charge network formulation,” IEEE Transactions on Power Apparatus and Systems, vol. PAS-101, no. 3, March 1982. [8] T. H. Fawzi and S. M. El-Sobki, “A new planning model for distribution systems,” IEEE Transactions on Power Apparatus and Systems, vol. PAS-102, no. 9, Semptember 1982. [9] M. A. El-Kady, “Computer-aided planning of distribution substation and primary feeders,” IEEE Transactions on Power Apparatus and Systems, vol. PAS-103, no. 6, June 1984. [10] M. Ponnavaiko, K. S. Prakasa Rao, and S. S. Venkata, “Distribution system planning through a quadratic mixed integer programming approach,” IEEE Transactions on Power Delivery, vol. PWRD-2, no. 4, October 1987. [11] E. Ben-Dov, R. G. Harley, and W. J. Seymore, “Design of an optimal reticulation system for a residential area,” IEEE Transactions on Power Systems, vol. PWRS-2, no. 1, February 1987. [12] H. L. Willis and J. E. D. Northcote-Green, “Comparison of several computerised distribution planning methods,” IEEE Transactions on Power Apparatus and Systems, vol. PAS-104, no. 1, January 1985. [13] Z. Sumic, S. S. Venkata, and T. Pistorese, “Automated underground residential distribution design—Part 1: Conceptual design,” IEEE Transactions on Power Delivery, vol. 8, no. 2, p. 638, April 1993. [14] Z. Sumic, T. Pistorese, H. Males-Sumic, and S. S. Venkata, “Automated underground residential distribution design—Part 2: Prototype implementation and results,” IEEE Transactions on Power Delivery, vol. 8, no. 2, p. 644, April 1993. [15] K. P. Wong and H. N. Cheung, “Artificial intelligence approach to load allocation in distribution substations,” IEE Proceedings, pt. C, vol. 134, no. 5, September 1987. [16] C. Jiann-Liang and H. Yuan-Yiu, “An expert system for load allocation in distribution expansion planning,” IEEE Transactions on Power Delivery, vol. 4, no. 3, p. 1910, July 1989. [17] R. L. Grimsdale and P. H. Sinclare, “The design of housing estate distribution system using a digital computer,” Proceedings of the IEE, vol. 107A, pp. 295–305, 1960. [18] M. S. Fox, “AI and expert system myths, legends and facts,” IEE Expert, pp. 8–20, February 1990. [19] T. Rajakanthan, A. S. Meyer, and B. Dwolatzky, “Smart maps streamline distribution design,” IEEE Computer Applications in Power, vol. 11, no. 1, p. 48, January 1998.
Thurairajah Rajakanthan received his B.Sc. (Eng) in electrical engineering from the University of the Witwatersrand, Johannesburg, South Africa, in 1995. He then proceeded to obtain his M.Sc. at the same University in 1999. He is currently employed by Terrain Software Systems where he is involved in the development of software tools to assist designers with the rapid production of low voltage electrification schemes. His area of interest is in developing optimization software to solve power engineering problems.
1072
Alan S. Meyer is a Senior Lecturer in the Department of Electrical Engineering at the University of the Witwatersrand. He obtained a B.Sc. (Eng) degree in 1952 and a M.Sc. (Eng) in 1968. He returned to the university after a long and career in industry and consulting engineering practice. During this time, he worked initially as a Designer of electric machines, then as General Manager of GEC Large Machines Company in South Africa and as Director of GEC Power Distribution with responsibility for technical development. This latter included equipment for power distribution. After leaving this organization, he became the Electrical Partner in the multidisciplinary consulting engineering firm.
IEEE TRANSACTIONS ON POWER DELIVERY, VOL. 15, NO. 3, JULY 2000
Barry Dwolatzky received his B.Sc. (Eng) in electrical engineering and Ph.D. from the University of the Witwatersrand. He is an Associate Professor in the Department of Electrical Engineering at the same university. For 25 years, he has been involved in research and development into computer applications that solve engineering problems. During the 1980s he spent several years doing postdoctoral research at UMIST, Manchester, and at Imperial College, London. His major current area of interest is in the design of software tools for use in the design of low-cost electrical distribution networks in developing countries.