164
IEEE TRANSACTIONS ON POWER DELIVERY, VOL. 21, NO. 1, JANUARY 2006
Transformer Tank Vibration Modeling as a Method of Detecting Winding Deformations—Part II: Experimental Verification Belén García, Member, IEEE, Juan Carlos Burgos, Member, IEEE, and Ángel Matías Alonso, Member, IEEE
Index Terms—Condition monitoring, failure early detection, power transformer, tank vibration, winding deformation.
was a 1500-kVA, 15 000/400-V unit constructed as a reduced scale model of a 60-MVA 220-kV transformer. The transformer was installed into a test facility in which the load was applied following the opposition method described in the IEC 60 076-2 standard, allowing load and power factor variation over a wide range. Vibrations were measured and calculated over a great variety of loads, power factors, and temperatures. In a first set of tests, calculated vibrations were compared with measured ones to verify the model accuracy when the transformer works in normal condition. After these tests, a winding deformation was provoked in the test transformer to verify the capability of the model to detect this deformation. Finally, the model was used to predict tank vibrations on four 30–40 MVA (one of 45/16 kV, another one of 132/16 kV, and two that were 132/66 kV) inservice grid transformers during several months. A very good agreement between the predicted and the measured vibrations was observed in these real transformers.
I. INTRODUCTION
II. MODEL VALIDATION OVER THE EXPERIMENTAL TRANSFORMER
N the companion paper [1], online tank vibration monitoring was proposed as a method to detect winding deformations in power transformers. The proposed method makes use of a vibration model that calculates transformer tank vibrations in healthy conditions. Any significant difference between calculated and measured vibrations is an indicator of a change in transformer geometry. Vibration monitoring can be applied online so it can be used as a complement to other offline techniques, such as frequency-response analysis. There is no need to install internal probes to use the proposed vibration model, so the method is easily applicable to both new and inservice transformers. In the companion paper, the theoretical foundations of the model are reported. The model’s ability to calculate transformer tank vibrations when the transformer is healthy and also to detect winding deformations was tested in a test transformer. The test transformer
Using a test transformer to evaluate the developed model has many advantages. First of all, it allows to do in-depth testing of the model in a wide range of working conditions, as transformer load and power factor can be varied at will which is not possible to do in an on-service transformer. A second advantage is the possibility of fitting the transformer with internal and external accelerometers allowing to gain knowledge about internal vibrations and how they are transmitted to the transformer tank. This information has been useful in the development of the model. Finally, having a test transformer allows provoking controlled winding deformations to evaluate the model’s ability to detect failures. Nevertheless, a test transformer cannot reproduce all of the response characteristics of the real units as the relative dimensions are very different. So model validation over real transformers is also necessary.
Abstract—In Part I of the paper, a tank vibration model was proposed as a method to detect the winding deformations in power transformers. This model is incorporated in a model-based monitoring system for power transformers. In this paper, the experimental verification of the proposed model that calculates vibration on the transformer tank is reported. The model was validated in a 1500-kVA experimental transformer constructed as a reduced scale model of a 60-MVA 220-kV unit. In order to load the test transformer, the opposition method described in IEC 60076-2 Standard was used allowing to vary the load and power factor over a wide range. Sensors to measure vibrations and temperature were installed in the test transformer. The model was validated under different test transformer operating conditions. In order to verify the model’s ability to detect failures, a deformation was provoked in the test transformer winding. Model predictions were compared with the measured vibration in that situation. The model has also been applied to four (30–40 MVA) grid transformers. Some results of this field validation are presented in this paper.
I
Manuscript received October 13, 2004; revised January 18, 2005. This work was supported in part by by the Spanish utility Unión Fenosa and in part by the Spanish Ministry of Science and Technology (MCYT) under Project no. DPI2002-04 473-C02-01 of the “Plan Nacional de Investigación Cientófica, Desarrollo e Innovación Tecnolígica.” Paper no. TPWRD-00483-2004. B. García and J. C. Burgos are with the University Carlos III of Madrid, Madrid 28911, Spain (
[email protected]). A. M. Alonso is with the Polytechnical University of Madrid, Madrid 28003, Spain. Digital Object Identifier 10.1109/TPWRD.2005.852275
A. Test Transformer The test transformer is a 1500-kVA, 15 000/400-V unit so as constructed to be a real reduced scale model of a 60-MVA, 220-kV one in the main winding aspects (disk-type winding, oilpaper insulation, voltage gradients between disks). It includes an oil circulation pump that can be switched on or off to get oil natural/air natural (ONAN) or oil forced/air forced (OFAN) cooling.
0885-8977/$20.00 © 2006 IEEE
GARCÍA et al.: TRANSFORMER TANK VIBRATION MODELLING—PART II: EXPERIMENTAL VERIFICATION
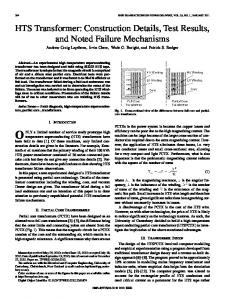
Fig. 1. Winding vibration measurement.
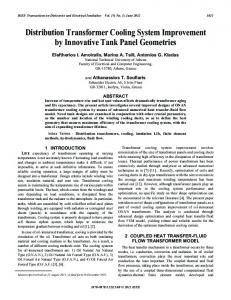
During the experimental stage, a great number of sensors, both external and internal, were fitted into the transformer. Vibration sensors were placed on the windings, on the core and on several points of the tank. As the companion paper reports, the comparison of internal and external measurements allows to find those points of the tank where the best correspondence between internal and external vibrations appears. This information, besides assessing the most suitable point of the tank to measure vibrations, also gives good insight into how the transformer vibrations are generated, the factors influencing them, and how the vibrations coming from different sources are superposed. Piezoelectric charge accelerometers were used for the measurement of vibrations. The results obtained in [2] were taken into account for this choice. Ten Brüel and Kjaer 4371-V accelerometers were fitted inside the test transformer and four were installed on the transformer tank. The accelerometers had a grounded metallic chassis, so to avoid high potential gradients, they were placed on the bottom of the windings (grounded neutral side). Moreover, all of the accelerometers were mounted on pressboard insulating plates. Sensors were installed to measure winding vibrations on axial and radial directions (Fig. 1), on the central phase, and on one of the side phases, and to measure vibrations in the three directions of the core (Fig. 2). Also, four accelerometers were installed at four different points of the tank to measure external vibrations. During the test temperatures, voltages and currents were also measured on the transformer. For temperature measurement, PT100 probes were fitted on different internal and external points of the transformer. To measure voltages and currents, instrument transformers and Hall probes were used. B. Test Facility The test transformer was installed in a test facility incorporating two auxiliary units: a phase-shift transformer and a load recovery transformer according to section 5.2 of the IEC 60 076-2 Standard (Fig. 3). These transformers are provided with a tap changer that allows the test transformer to be loaded with varying loads and power factors. The phase-shift transformer is a 2000-kVA, 15 000/15 081-V transformer with a variable phase angle between the primary
165
Fig. 2. Core vibration measurement in the radial direction in a plane parallel to the sheets.
Fig. 3. Test facility electrical scheme.
and secondary voltages. The shift can be varied by selecting the proper tap. The load recovery transformer is a 2000 kVA 13 980/400 V with a variable primary voltage between 12 975 and 15 000 V. By changing the load recovery and phase-shift transformers taps, the active and reactive power through the test transformer can be changed. These auxiliary transformers return the power being conveyed by the test transformer to the grid, so the test facility only consumes the power losses of the three transformers. C. Experimental Tests Vibrations were measured on the healthy test transformer (i.e., without winding deformation) in different working conditions. • Different loads: Twenty-five different loads were achieved by selecting different taps of the auxiliary transformers. • Different voltages: The test transformer was supplied with variable voltage. • Different power factor: Measurements were performed with the transformer operating at the constant load and different power factors. • Different temperatures: Vibration variation while the transformer was heating up with constant load was analyzed to study how vibration is affected by temperature. • Different refrigeration modes: Vibrations were measured with the transformer operating at the same load and the pump switched on and switched off, respectively, to study vibrations changes.
166
IEEE TRANSACTIONS ON POWER DELIVERY, VOL. 21, NO. 1, JANUARY 2006
In addition, to analyze if tank vibrations are sensitive to winding deformations, this condition was provoked on the test transformer. Vibrations before and after the deformation under the same transformer operating condition were compared. Simultaneously with internal and external vibrations, currents and voltages were also measured. Fourier transform of all these variables was performed, and real and imaginary parts of vibrations up to 800-Hz frequency were obtained. Zero crossing of the 50-Hz fundamental voltage in the high-voltage side was taken as the phase origin. For accurate computation of fast Fourier transform (FFT), the signals were sampled during 1 s with a sampling rate of 4 ksamples/s. The signals coming from the accelerometers were filtered with a hardware 10-Hz high-pass filter and a 10-kHz low-pass filter. To avoid phase shifts between harmonics due to a data-acquisition process, a simultaneous data-acquisition board was used. III. EXPERIMENTAL RESULTS As was reported in the companion paper, the model algorithm is (1) is the 100-Hz frequency tank vibration, and are the 100-Hz harmonic of the current and is the oil temperature voltage squared, respectively, and measured at the top of the tank. As was explained, all of these quantities (except temperature) are complex numbers. Besides these input variables, the model equation has some parameters , and that are also complex and shall be estimated before using the model to monitor vibrations of a transformer. To adjust these parameters, a least-squares algorithm shall be applied to the model equation using a set of input and output data measured in the transformer that is going to be monitored. The model has been adjusted and validated using vibration data measured on the test transformer during the healthy-condition tests described in the previous section. To take into account the oil circulation pump influence on vibrations, the model was tested separately for both ONAN and OFAN refrigeration modes. where
Fig. 4. A 100-Hz vibration in real and imaginary parts measured and calculated in the adjustment period for ONAN cooling. TABLE I MODEL PARAMETERS FOR ONAN COOLING
A. Natural Oil Circulation 1) Model Adjustment: To make the model adjustment, the Matlab System Identification Toolbox was used. A set of input and output data was used, corresponding to a period where the transformer worked with the oil circulation pump switched off with variable load, supply voltage, power factor, and temperature. It is important that the data set used to make the parameter adjustment includes data corresponding to different operating conditions in order to accurately characterize the dependence of the vibrations on the different input variables. Fig. 4 shows the results of the model in the adjustment period in real (top graphic) and imaginary part (bottom graphic). In both figures, 100-Hz-measured vibration is plotted in a solid line and the estimated vibration is plotted in the dotted line. In the bottom of every graphic, the difference between the model outputs and the measured values1 is shown. The parameters re1This
difference is denominated as error in the following.
TABLE II VIBRATION MODEL AVERAGE AND MAXIMUM ERROR ADJUSTMENT PERIOD FOR ONAN COOLING
IN THE
sulting from the model adjustment are shown in Table I and the maximum and medium error obtained in Table II. 2) Model Validation: Once the parameters were calculated, the model was applied to calculate tank vibrations on the transformer when operating in conditions different from those considered in the adjustment and after the calculated vibrations and the measured ones were compared. Fig. 5 shows some results corresponding to a period in which the test transformer load and power factor were suddenly changed, maintaining every operating condition for a few minutes. A good agreement can be
GARCÍA et al.: TRANSFORMER TANK VIBRATION MODELLING—PART II: EXPERIMENTAL VERIFICATION
Fig. 5. A 100-Hz vibration in the real and imaginary part measured and estimated in the validation period for ONAN cooling. TABLE III MODEL VALIDATION AVERAGE AND MAXIMUM ERROR FOR ONAN COOLING
observed between the measured vibration (plotted in the solid line) and the calculated one (plotted in the dotted line), being the maximum and average error obtained (Table III) below acceptable limits. B. Forced Oil Circulation The same process described in the previous section was repeated for the case of the transformer working with forced oil circulation (OFAN) using for the model adjustment and validation data corresponding to periods in which the transformer operated with the oil circulation pump switched on, also obtaining good results [3].
167
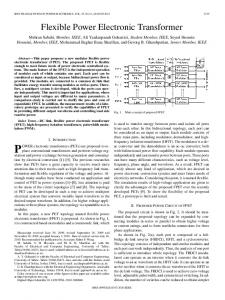
Fig. 6. Test transformer winding after (top) and before (bottom) the deformation.
windings. Fig. 6 shows the transformer winding before (bottom) and after (top) the deformation. Fig. 7 compares the spectrum of the vibrations measured on the bottom of the tank before and after the deformation for the same operating conditions. As can be seen, the 100-Hz vibration amplitude increases significantly, but small variations appear on higher order harmonics. This result proves the feasibility of detecting winding deformations by measuring tank vibrations and, on the other hand, confirms that the 100-Hz vibration is the best choice as model input. Fig. 8 shows the vibration measured and calculated by the model when the transformer was submitted to variable load after provoking the deformation. Table IV compares the average and maximum error of the model in this condition versus those obtained when the transformer was healthy and submitted to similar operating conditions. As can be seen in Table IV, the error of the model in this case is much higher that in the cases without deformation.
IV. MODEL VALIDATION IN FAILURE CONDITION As has been pointed out, the model’s main objective is to detect changes in the transformer windings geometry. To test if the model is able to detect this kind of failure, an axial deformation was provoked in one of the test transformer high-voltage (HV)
V. VALIDATION OVER A GRID TRANSFORMER The model is being applied to monitor four grid in-service transformers (30–40 MVA) owned by a Spanish utility since October 2003. Industrial accelerometers were placed in the bottom
168
IEEE TRANSACTIONS ON POWER DELIVERY, VOL. 21, NO. 1, JANUARY 2006
Fig. 7. Vibrations at the bottom of the tank before and after simulate the deformation.
of the tank to measure tank vibrations. Also, electrical quantities (currents and voltages) and temperature are measured simultaneously to vibrations. In Fig. 9, some results are shown corresponding to one week of the model working over one of these monitored transformers (40 MVA, 132/66 kV). In this transformer, three accelerometers were placed to monitor tank vibration, one under every core leg. The results shown correspond to the model fed with data taken over the central leg. It should be noted that to apply the model to monitor the vibrations of the different columns, parameter adjustment must be done with the data coming from the corresponding accelerometer. As before, at the top of the figure, real 100-Hz vibrations are plotted and, in the bottom, 100-Hz imaginary vibrations. In both figures, calculated vibrations are plotted in the dotted line. A good agreement can be seen between measured and calculated vibrations. As can be noticed, vibrations in the power transformer connected to the network present daily cycles which result from a vibration dependence on the load. VI. CONCLUSION In this work, a model has been proposed to monitor transformer tank vibrations. In the companion paper, the theoretical foundation of the method was shown and the model algorithm was obtained. In this paper, the experimental validation of the model was reported. The main goal of the model is to allow the early detection of deformations in transformer windings.
Fig. 8. A 100-Hz real vibration measured versus estimated with deformation for ONAN cooling. TABLE IV ERROR WITH
THE DEFORMATION VERSUS ERROR THE DEFORMATION. ONAN COOLING
WITHOUT
The model calculates how the transformer tank should vibrate if it was healthy and by comparing the calculated and measured vibrations it determines if something abnormal happens inside the transformer. The main advantage of the model is that it can be applied for online monitoring without installing any internal sensor in the transformer. Model experimental validation was first made over a 1500-kVA test transformer constructed as a real reduced scale of a 60-MVA unit. This transformer was fitted with internal and external accelerometers to compare internal and external vibrations; the comparison of these data was very useful during the model development. Test transformer load and power factor
GARCÍA et al.: TRANSFORMER TANK VIBRATION MODELLING—PART II: EXPERIMENTAL VERIFICATION
169
out in the Electrical Engineering Department of the Universidad Carlos III de Madrid. REFERENCES [1] B. García, J. C. Burgos, and A. Alonso, “Transformer tank vibration modeling as a method of detecting winding deformations—Part I: Theoretical foundation,” IEEE Trans. Power Del., vol. 21, no. 1, Jan. 2006. [2] M. A. Sanz-Bobi, A. Garcia-Cerrada, R. Palacios, J. Villar, J. Rolan, and B. Moran, “Experiences learned from the on-line internal monitoring of the behavior of a transformer,” in Proc. IEEE Int. Electric Machines Drives Conf. Rec., Milwaukee, WI, May 1997. [3] B. García, “Contribución al desarrollo de un sistema de mantenimiento predictivo para grandes transformadores de potencia mediante monitorización continua bassada en modelos,” Ph.D. dissertation, Elect. Eng. Dept., Univ. Carlos III Madrid, Madrid, Spain, Dec. 2002.
Belén García (M’02) was born in Madrid, Spain. She received the M.Sc. degree in physics from the Universidad Complutense de Madrid, Madrid, Spain, in 1998 and the Ph.D. degree in electrical engineering from the University Carlos III of Madrid, Madrid, Spain, in 2002. Currently, she is an Assistant Professor with the University Carlos III of Madrid, where she has been since 1998. Her main area of interest is power transformers life management.
Fig. 9. A 100-Hz real vibration measured versus calculated in a grid transformer.
can be varied easily at will by means of two auxiliary transformers which allows validating the model over very different operating conditions. Once the model is validated in normal conditions, its ability to detect winding deformations was tested. For this purpose, an axial deformation was provoked on the test transformer winding and the response of the model and the measured vibrations with that deformation were compared. Finally, in addition to the model validation over the test transformer, some results obtained with the model applied to a real in-service grid transformer are shown. ACKNOWLEDGMENT The authors would like to thank Union Fenosa for their interest and the support of the work. This work has been carried
Juan Carlos Burgos (M’01) was born in 1955. He received the Ph.D. degree from the Escuela Tecnica Superior de Ingenieros Industriales de Madrid, Madrid, Spain, in 1987. Currently, he is an Associate Professor with the University Carlos III of Madrid, Madrid, Spain, where he has been since 1994. His main area of interest is power transformer monitoring. Dr. Burgos is a member of CIGRE WG A2.24 on Thermal Performances of Power Transformers.
Ángel Matías Alonso (M’00) was born in Oviedo Asturias, Spain. He received the B.S.E.E. degree from ETSII of Madrid, Madrid, Spain, and the Ph.D. degree from the Polytechnical University of Madrid, Madrid, Spain. He joined Compagnie Génerale d’Electricité, Paris, France, as an engineer. In 1967, he joined the ISOLUX Company, Madrid, where he has worked for the last seven years as Technical Manager. Currently, he is a Professor in the Department of Electrical Engineering of the Polytechnical University of Madrid, where he has been since 1977. He has presented about 80 papers and articles, has written three books, and has directed six Ph.D. theses. He has been Principal Investigator or Director of Research in 45 research projects mainly for industrial companies. He holds three patents. Dr. Alonso received the Gold Medal of UPM, the Covadonga award of AMIC and Lillehammer award EUREKA of European Union. He is a member of IEC WG2 and WG16 of TC2 chairman of TC202 and WG2 of the Spanish Standard Organization AENOR. He is a member of VDE and CIGRÉ.