Science Journal of Education 2016; 4(1): 1-8 Published online January 9, 2016 (http://www.sciencepublishinggroup.com/j/sjedu) doi: 10.11648/j.sjedu.20160401.11 ISSN: 2329-0900 (Print); ISSN: 2329-0897 (Online)
Computer Modeling for Science, Technology, Engineering and Mathematics Curriculum in Kenya: A Simulation-Based Approach to Science Education James Sifuna, George Simiyu Manyali, Thomas Sakwa, Alima Mukasia Computational and Theoretical Physics Group (CTheP), Physics Department, Masinde Muliro University of Science and Technology, Kakamega, Kenya
Email address:
[email protected] (J. Sifuna)
To cite this article: James Sifuna, George Simiyu Manyali, Thomas Sakwa, Alima Mukasia. Computer Modeling for Science, Technology, Engineering and Mathematics Curriculum in Kenya: A Simulation-Based Approach to Science Education. Science Journal of Education. Vol. 4, No. 1, 2016, pp. 1-8. doi: 10.11648/j.sjedu.20160401.11
Abstract: Developed countries have appreciated the importance of Science, Technology, Engineering and Mathematics (STEM) for scientific and technological development. STEM subjects have been posting low results in the Kenya Certificate of Secondary Examinations over the years and we have linked the deteriorating standards to the inappropriate teaching approaches that mainly tend to be teacher-centered and hence compromising the learner-centered approach. Due to the poor teaching methods, we ought to incorporate simulation in science education to foster good grades and this formed the basis of this research. Computation techniques have been applied in many subject areas in tertiary institutions with promising results that tend to be in agreement with experimental data. Our research is a quasi-experimental study and thus we have employed the Solomon-Four-Quasi-Experimental design that enabled us to involve a comparison between two computational groups and two control groups. The control groups served to reduce the influence of confounding variables and allowed us to test whether the pre-test had an effect on our objective. Purposive sampling technique was used to select three schools (A boy school, a girl school and a mixed sex school). Each school was expected to have a computer for simulation. The three schools were further split into four groups (single boy’s school, single girl’s school, boys from the mixed and girls from the mixed school). Each school provided the form one class and a total of 150 students participated. We taught the concept of the periodic table to all the students, the computational groups were taught using the simulations while the control groups were taught using the regular methodology. After we had taught for a period of one month, all the four groups were tested using a tool verified by KurderRichardson 21 Formula and the data analyzed using t-test, ANOVA and Origin 9.0. The results showed that the computation groups posted higher scores in the concept of the periodic table. This research points to the fact that there is an urgent need to re-design the teaching of Science, technology, Engineering and Mathematics fields, by incorporating computation techniques to enhance STEMs.
Keywords: STEM, Simulation, Solomon-Four-Quasi- Experimental Design, Kurder-Richardson 21 Formula, T-test, ANOVA, Origin 9.0, Purposive Sampling
1. Introduction We define a computer simulation as a program that is run on a computer and uses stepwise methods to explore the approximate behavior of a designed mathematical model. Computer simulation was pioneered as a scientific tool in meteorology and nuclear physics in the period directly following World War II (Barberousse and Ludwig, 2009), and since then, it has become indispensable in a growing number
of disciplines. The list of sciences that make extensive use of computer simulation has grown to include astrophysics, particle physics, materials science, engineering, fluid mechanics, climate science, evolutionary biology, ecology, economics, decision theory, medicine, sociology, epidemiology, and many others. There are even a few disciplines, such as chaos theory and complexity theory, whose very existence has emerged alongside the development of the computational models they study (Barberousse and Ludwig, 2009). In existence, there are two types of computer
2
James Sifuna et al.: Computer Modeling for Science, Technology, Engineering and Mathematics Curriculum in Kenya: A Simulation-Based Approach to Science Education
simulation: Equation-based simulations and agent-based simulations. Computer Simulations of both types are used for three different general sorts of purposes: Prediction, understanding, and exploratory purposes. In Kenya, STEMs play a key role in scientific progress and discoveries. Their fundamental role lies in their applications in the society since they have improved the standards of living in Kenya. The learners of STEM, tend to possess a problem solving technique that equip them with the speedy radical changes in health, industry, climate, information technology and the economic environment (John et al., 2014). For Kenya to achieve its vision 2030 (Republic of Kenya, 2007), it ought to invest heavily in the STEM subjects and encourage high enrollment in STEMs. STEMs have been perceived negatively by the students due to the traditional methodologies employed by the instructors. There has been a decline in the number of students seating for STEMs at Kenya Certificate of Secondary Education and the few that seat the STEM exams post dismal results (KNEC, 2015). Among the factors that lead to the dismal performance include; poor attitude, perceived abstract nature, subject content and the traditional teaching methods. In regard to Tanel and Erol (2008), the regular teaching methods do not improve the teaching in STEMs. We also realized that content delivery in Kenya is usually teacher centered and this gives the students fewer opportunities for active participation. We anticipate eliminating this by having a simulation approach to Science Education in Kenya. STEMs do require well built and equipped Laboratories and this has not been met in Kenya due to insufficient funds. We found out that having a Virtual Lab is more advantageous since it is economical, uses less space, experiments can be paused and later on continued, faster and accurate. In the traditional laboratory, Chemicals ought to be purchased, setting up of the experiment again takes time, the students enter the laboratory in shifts since they are many and the room is small. There are environmental effects like temperature and moisture that may lead to adsorption or absorption. There is also the danger of reactive elements and this makes the students at risk in the laboratory if left alone. Our study tends to foster the inception of Simulation in Science education in Kenya. There are many types of Computation techniques that students can engage in when left alone; simulations, tutorials, drills and practice, educational games and hypermedia (John et al., 2014). We adopted simulation in this research. Simulations are effective than regular instructional practices to enhance quality education (Smetana and Bell, 2012). We performed simulation with animated color graphic images that were able to represent the dynamic nature of the elements on the Periodic table. This research was purely based on the use of simulation in teaching the concept of the periodic table.
teachers. Teachers ought to embrace technology and improve the teaching approaches to be student centered and hence better results. Computation techniques have been applied in different spheres of knowledge and time has come for the same to be incorporated in STEM here in Kenya. STEMs in Kenya can benefit a lot if teachers and students embrace simulation. No study has been done to investigate the effectiveness of simulation in teaching and learning of the Periodic table. We intend to fill this gap by writing a program on the periodic table that will aid in teaching and learning, then evaluate the students and see its effectiveness. The following null hypothesis was tested at a significance level of 0.05. Ho1: There is no statistically significant difference in the understanding of the concept on the periodic table between students’ exposed to simulation and those taught using traditional methods.
2. Statement of the Problem
5. Instrumentation
The enrollment of students taking STEM subjects at KCSE has been declining as years go by. A keen observation also is the poor performance associated with STEMs. We linked the poor performance to the teaching methods used by the STEM
Scientists from the Computational and Theoretical Physics group (CTheP) of Masinde Muliro University of Science and Technology prepared an achievement test that was used to assess students’ academic understanding of the concept on
3. Methodology We employed the quasi-experimental research involving Solomon Four Non-equivalent control group design. In this design, we used the two computational groups and two control groups. One control group and one computational group were given a pre-test and a post-test while the remaining two groups were given a post-test only (Sekaran, 2010). The purpose of the pre-test was to indicate to us whether the students were initially at the same level, while the post-test was to indicate the effect of simulation. The test tool was reliably tested by the Kurder-Richardson 21 Formula. T-test, ANOVA and Origin 9.0 were used to analyze the data and represent data.
4. The Sample Here, purposive sampling was applied. Purposive sampling is one that is selected based on the knowledge of a population and the purpose of the study. We used purposive sampling since we needed to reach a targeted sample quickly. Sampling for proportionality was not the main concern in this study. A total of 150 form one students from 3 schools served as the subject of this study. For the results of an item analysis to be reliable and interpretations of the item analysis to be valid, large number of people (P > 100) must have taken the test as stipulated by Ted et al., 2016. A large number is essential since all the ability levels are apt and represented. The subjects were randomly selected to form four groups that were comparative enough in terms of number, age and quality of learning facility available in their schools. The pretest analysis showed no significance difference on all the dependant measures (Thiong’o, 2013).
Science Journal of Education 2016; 4(1): 1-8
the periodic table. This instrument was developed basing on the Blooms taxonomy of education objectives entailing knowledge, comprehension, application, analysis, synthesis and evaluation. It was reviewed by experts knowledgeable in Science and science education. It consisted of 12 well structured questions on the periodic table and it was marked out of 24 marks. A reliability coefficient was determined using the Kurder-Richardson21 Formula. We could also use KR20 (Coefficient Alpha) or spearman-Brown formulae but our questions in the test had approximately the same difficulty i.e. the mean score of each question was approximately equal to the mean score of each other questions. The formula applied was,
n M × (n − M ) KR 21 = × 1 − (Tedetal., 2016) (1) n − 1 n × Variance
3
12 11× (12 − 11) KR 21 = × 1 − 12 × 25 12 − 1
(5)
11 KR 21 = [1.091] × 1 − 300
(6)
KR 21 = [1.091] × [1 − 0.03667 ]
(7)
KR 21 = 1.0
(8)
From the calculation above, we used a large data of 121 people and the reliability obtained was 1.0 and this proved that the instrument that we designed was valid for use since the reliability coefficient obtained was higher than that suggested by Fraenkel et al., (2011) of 0.70.
6. Results and Discussion
Where: KR21: is the estimated reliability of the test n: is number of questions M: is the Mean score on the test Variance: is the square of the standard deviation But we had to recall that standard deviation is given by
6.1. Results of the Pre-test
(2) This solely implies clearly that Variance was to be obtained by
The Solomon-Four-Quasi- Experimental design allowed us to exert a complete control over the variables since it allowed the researchers to confirm that the pre-test did not influence the results. The Solomon four group tests is a standard pre-test-post-test two-group design and the posttests only control design. This test was sat by the 37 computational group 1 students and 40 control group 2 students. The scores in the raw form were recorded in Table 2 and Table 3 below. Table 2. Showing the Pre-test scores the 37 Computational group 1 students.
(3)
Before the test being administered, there was need to pilot it and see its reliability. We used a sample value of 121 students in the pilot project and their raw scores were as shown in Table 1 below.
Computation group 1 6 5 9 6 9 6 7 17 1 9 4 6 15 14 15 13 15 4 20 18
10 9 8 16 14
6 14 12 4 6
3 16 2 10 18
4 13 Mean= 10.0 standard dev = 5 Variance = 25
Table 3. Showing the Pre-test scores the 40 Control group 2 students. Table 1. A table showing the raw scores in the pilot project with a Mean mark of 11.0, Standard Dev of 5.0 and Variance of 25. 14 14 15 4 5 5 14 5 19 6 2
15 6 7 20 13 14 2 15 16 17 14
14 13 16 4 17 19 17 16 16 18 5
12 7 9 3 15 12 10 9 5 6 15
6 15 4 13 20 17 19 2 3 15 8
17 12 15 7 9 4 12 10 15 4 9
19 5 14 18 2 3 6 8 9 1 2
18 15 4 16 17 10 6 9 12 15 3
10 2 17 18 13 10 15 19 14 10 2
18 14 16 12 10 17 13 10 7 12 18
6 5 4 18 16 1 19 10 15 13 10
Substituting in the above data in the equation below, we find:
n M × (n − M ) KR 21 = × 1 − n − 1 n × Variance
(4)
Control group 2 18 10 2 15 20 16 6 16 18 1 6 17 7 9 13
16 13 4 6 10
6 14 3 8 9
8 12 4 16 9
6 7 6 14 3
1 3 20 18 6
Mean= 10.0 standard dev = 5.7 Variance = 32.94
From the above data, we manually calculated the Degrees of freedom (Df) and the t-value and fitted the two into SPSS software (Version 22.0) to obtain the P-value.
df =
S2 S2 ( 1 + 2 )2 n1 n2 2 S2 1 S1 2 1 ( ) + ( 2 )2 n1 − 1 n1 n2 − 1 n2
(9)
Where: n1 and n2 are the sizes of computational group 1 and
4
James Sifuna et al.: Computer Modeling for Science, Technology, Engineering and Mathematics Curriculum in Kenya: A Simulation-Based Approach to Science Education
control group 2 respectively. S1 and S2 are the standard deviations for the computational group 1 and control group 2 respectively. Substituting values in equation (9), we get:
S2 ( + 2 )2 n1 n2 2 S2 1 S1 2 1 ( ) + ( 2 )2 n1 − 1 n1 n2 − 1 n2
5.72 2 ) 37 40 df = 2 2 1 5 2 1 5.7 2 ( ) + ( ) 36 37 39 40
(10)
2.2139952 0.0296 df = 74.797
(11)
(
52
+
Table 5. Indicating the scores achieved by all the four groups in the post-test.
df =
Which is approximately = 75.00 After we obtained the df, we went ahead and calculated the t-value as follows:
t=
X1 − X 2 (
S12 n1
+
S22 n2
(12)
)
Where: X1 is the Mean of the Computation Group 1 and X 2 is the Mean of the Control group 2 We now substitute values in equation (12), and we get:
t=
6.2. Results of the Post-Test To determine the effect of simulation on the concept of the periodic table, the analysis of the post-test mean-scores were carried out. Hypothesis one, Ho1of the study sought to find out whether there was a statistically significant difference in the achieved scores on the concept of the periodic table between the computational and the control groups. Table 5 indicates the raw data as we recorded from the test.
S12
df =
used in this study had similar characteristics and were suitable for the research.
10 − 10
(13)
(0.6757 + 0.81225)
Computational Group 1 15 10 16 21 20 12 18 19 15 16 13 12 20 19 17 16 14 15 16 13 Control Group 1 9 19 13 10 5 12 10 6 12 6 16 4 13 4 14 19 10 3 7 17 Computational Group 2 12 16 17 13 14 16 14 16 19 19 9 10 24 20 17 19 15 19 10 18 Control Group 2 7 10 7 4 6 13 9 11 4 18 8 11 4 6 7 13 6 9 1 6
10 9 19 16 17
18 20 24 9 20
16 14 16 14 12
13 15
6 4 8 15 13
1 14 9 8 11
18 13 8 6 7
4 7 10
15 18 21 13 23
20 20 19 16 10
9 24 13 18 15
6 14 6 14 8
13 1 4 16 9
8 9 19 10 7
Mean=15.65 Standard Dev=3.52 Variance=12.39
Mean =9.76 Standard Dev=4.69 Variance=21.99
Mean=16 Standard Dev=4.1 Variance=16.81
18 8 14 17 9
Mean=9.3 Standard Dev=4.6 Variance=21.16
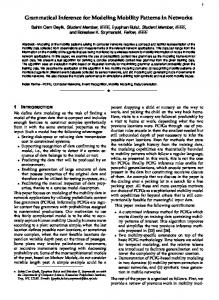
Using origin 9.0 software (Origin Lab), we did a further comparison of the four groups and obtained in Figure 1 below.
If the above is well substituted, then;
t=0
(14)
Now we have our df and t-values, we feed the two values into SPSS (Version 22.0) and obtained our P-value as 1.0 Table 4 shows the summary results of the independent samples t-test for the pre-test. Table 4. Showing summary results of the pre-test of the computational group 1 and the control group 2 and P> 0.05. Group Computational group 1 Control group2
Mean points 10 10
SD
Df
t-value
P-value
5.0 5.7
75
0
1.0
From the above table, the results are not statistically significantly different since t-computed =0 at df=75, P > 0.05. In this case, the P-value was large and therefore the obtained difference between the sample means is regarded as not significant. This equally indicated to us that the groups
Figure 1. A bar graph obtained using the mean scores of the various groups in the post-test.
Science Journal of Education 2016; 4(1): 1-8
Table 6 below shows summarized post-test mean scores for the four groups. Table 6. Showing the scores on the post-test for various groups. Group Computation group 1 Control group 1 Computation group 2 Control group 2
Number of students 37 38 35 40
Mean 15.65 9.76 16.00 9.30
SD 3.52 4.69 4.1 4.60
SS
for Control group 2 was gotten by 136900 4230 − = 807.50 40 This now leads us to obtain the sum of squares between groups and within groups as follows. We had an ANOVA control table as shown in table 7. Table 7. ANOVA control table, where N is the total population and k is the number of groups. SS
A look at table 6 shows that the mean scores for row 1 and row 3 were higher than row 2 and row 4. This shows that simulation had an effect of improving performance as compared to the traditional methods. We established whether the mean scores were statistically significantly different by performing an analysis of Variance one way (ANOVA) and the results are shown in the table 8. We calculated the sum of the squares (SS) which is simply the measure of dispersion and we realized that the more the scores are inconsistent (Less homogeneous), the larger the dispersion while the more homogeneous the scores are, the smaller the dispersion. This can be calculated as follows:
SS = ∑ X 2 −
(∑ X )2
( ∑ X1 ) 2
SS ( B ) =
n1
SS ( B ) =
+
by
MS
F
Between
SS(B)
k-1
SS(B) k −1
Within
SS(W)
N-k
SS(W) N−k
Total
SS(W)+SS(B)
N-1
X GM =
MS(B) MS(W)
15.65 + 9.76 + 16.00 + 9.30 = 12.6775 4
After obtaining the grand mean, we then calculated our SS (T)
for Computational group 1 was gotten 335241 9507 − = 446.43 37 SS for Control group 1 was gotten 137641 4437 − = 814.87 38 SS for Computational group 2 was gotten 326041 9881 − = 565.54 35
Df
We obtained the grand mean of our data as follows ∑ x or alternatively, X = ∑ nx X GM = GM N n
(15)
N
SS
5
since
SS (T ) = ∑ ( x − X GM )2
2 SS (T ) = ∑ X TOT −
or
alternatively
(∑ X TOT )2
by
. This process involves NTOT each and every score and it is tedious, it can’t be handled manually and hence we resorted to the spread sheet and obtained 4216.546 as our SS (T). We then calculated our SS (B) since
by
SS ( B ) = ∑ n( x − X GM ) 2 or alternatively
(∑ X 2 ) 2 n2
+ ... +
(∑ X k )2 nk
−
(∑ X TOT )2 NTOT
(16)
(579) 2 (371)2 (571)2 (370) 2 (1891) 2 + + + − 37 38 35 40 150
This gave us,
SS ( B) =
335241 137641 326041 136900 3575881 + + + − 37 38 35 40 150
SS ( B) = 9060.5676 + 3622.1316 + 9315.4571 + 3422.5000 − 23839.2067 SS ( B ) = 1581.4496 We then calculated our SS (W) using
(∑ X1 ) 2 ( X )2 ( X )2 + ∑ X 2 − ∑ 2 + ... + ∑ X 2 − ∑ k SS (W ) = ∑ X12 − 2 k n1 n2 nk
(17)
6
James Sifuna et al.: Computer Modeling for Science, Technology, Engineering and Mathematics Curriculum in Kenya: A Simulation-Based Approach to Science Education
335241 137641 326041 136900 SS (W ) = 9507 − + 4437 − + 9881 − + 4230 − 37 38 35 40
SS (W ) = (9507 − 9060.5676) + (4437 − 3622.1316) + (9881 − 9315.4571) + (4230 − 3422.5000) SS (W ) = 446.4324 + 814.8684 + 565.5429 + 807.5 = 2634.3437 Since we have our SS (B) and SS (W), we comfortably obtained our Mean squares (MS) as follows
MS Between = MSWithin =
SS ( B) 1581.4496 = = 527.15 df Between 3 SS (W ) 2634.3437 = = 18.04 146 dfWithin
After the Mean squares had been found, we calculated F MS Between 527.15 = = 29.22 by F = MSWithin 18.04 After obtaining our F-Value, we used our calculated Df Between and Df Within to get the P-Value. The values were keyed into the p-value calculator for an F-test (Daniel Soper, 2015) and we got P=0.0. F-critical was obtained as 2.667 using Critical F-Value Calculator by computing Df Between and Df Within (Daniel Soper, 2015) The above results are summarized in table 8 below. Table 8. Showing an ANOVA of the post-test scores with F-critical=2.667 and P MSwithin. This shows that there is a high significant overall Simulation effect. The findings on this paper show that the students who simulated the concept of the periodic table achieved higher results in the Post-test than their counter parts in the control group. Here, the simulation method was more effective in enhancing students’ performance than the regular teaching method. The finding in this paper reaffirms a similar study done by John et al., 2014, that the use of simulation improves students’ scores. Computer simulations are cheaper compared to the real Laboratory environment that is costly and also consumes a lot of space. Computation results are equally obtained very fast and they are convenient. Another advantage is that a simulation can be paused and continued later unlike in the real laboratory setting where the experiments cannot be paused.
7. Conclusion Based on the results of this study, we strongly conclude that simulating the periodic table produced a significant difference in performance on the concept of the periodic table. The incorporation of this method will improve on the STEM performance not only in the theory but also in the practical perspectives. Simulation can equally be used in situations where a real laboratory poses a challenge. Such include, introducing simulation to people with physical disabilities and introducing simulation to women so as to encourage them to join the male dominated science field. We recommend that science teachers enhance simulation as a tool in the day to day learning of STEMs for better results.
Acknowledgement James Sifuna sincerely thanks the schools that participated in this research. George Simiyu Manyali acknowledges funding from the African-German Network of Excellence in Science (AGNES) Grant for Junior Researchers 2015. Support from Masinde Muliro University of Science and Technology is also appreciated.
Appendix TOPIC: CHEMICAL SYMBOLS, FORMULAE AND CHEMICAL EQUATIONS This is a topic taught at Form one as a Pre-requisite topic to the Periodic table in Kenya. After learning this topic, a student should be able to answer the questions below comfortably. The exam was retrieved from the databank of Mang’ana Secondary school, basing on their results, the exam was reliable. We gave the same as our pre-test exam to the Computational and control group since there was no probability that they had interacted with the exam. PRE-TEST EXAM 1. Distinguish between an element and an atom(2mks) 2. Name any two elements(Metal and Non Metal) (2mks) 3. Write the chemical symbols of the named elements in (2.) above (2mks) 4. Define isotopes (2mks) 5. Name two elements that form isotopes from the first twenty elements of the periodic table (2mks) 6. Write the chemical formulae of the following compounds: i. Magnesium oxide (1mk) ii. Aluminum chloride (1mk)
Science Journal of Education 2016; 4(1): 1-8
7.
Below is a crystalline structure of sodium chloride used as common salt.
Indicate on the diagram, the remaining sodium ion and chloride ion (2mks) 8. Explain why sodium chloride has high melting and boiling points (2mks) 9. Write a chemical equation for the following chemical reactions i. Magnesium burning in air (1mk) ii. Sodium reacting with water (1mk) 10. Give two chemical features of transition elements found in the periodic table (2mks) 11. Name two compounds formed by transition elements (2mks) 12. Draw the crystalline structure of iodine and label the bonds (2mks) TOPIC: THE PERIODIC TABLE This is a topic taught to students after having knowledge of Chemical Symbols, formulae and Chemical equations. After learning the concept of the periodic table on the first 20 elements via simulation and the traditional methods, the four groups sat for the below exam. The below exam was set by experts in the CTheP group of Masinde Muliro University of Science and Technology and the reliability of the test determined using KR21 formula. The test had a reliability of 1.0 POST-TEST EXAM Study the grid below of the periodic table and answer the questions that follow:
Figure 2. An extract of the periodic table.
1.
Name the chemical families into which elements K and F belong (2mks) 2. Give the chemical name of the elements found in the shaded area? Give one example of the element found the shaded area. (2mks) 3. Elements Na reacts with Br under special conditions in a fume chamber: i. Write the equation for the reaction (1mk) ii. Give the chemical formulae of the compound formed. (1mk) 4. An element whose symbol is X, has an atomic number of 12. Indicate its position on periodic table. Explain (2mks)
7
5.
Write the formula for the compound formed when Beryllium react with Nitrogen (2mks) 6. Compare the reactivity of the elements F and Ne (2mks) 7. Compare the reactivity of group one elements (2mks) 8. Explain the change in the atomic size across period 3 elements (2mks) 9. Silicon has the highest meting and boiling point than any other element shown on the grid explain (2mks) 10. Draw the structure of silicon that makes it have the property in (9) above (2mks) 11. State two uses of element O shown in the periodic table (2mks) 12. Compare the electrical conductivity of the elements Na and Al (2mks)
References [1]
Barberousse, A., and P. Ludwig, 2009. “Models as Fictions,” in Fictions in Science. Philosophical Essays in Modeling and Idealizations, London: Routledge, 56–73
[2]
Fraenkel JR, Wallen NE,Hyun H(2011). How to design and evaluate research in education (8thed.). Boston, MA: McGraw-Hill Education
[3]
F-Value Calculator (http://www.danielsoper.com/statcalc3/calc.aspx?id=4) accessed online on 25th December 2015.
[4]
IBM Corp. Released 2013. IBM SPSS Statistics for Windows, Version 22.0. Armonk, NY: IBM Corp.
[5]
John K. Thiong’o et al., Effects of computer-based simulation module on secondary school students’ achievement in understanding of magnetic effect of electric current. ISSN2360-7963:Vol. 2(8): pp 096-102, August, 2014.
[6]
Kenya National Examinations Council (2015). The year 2014 Kenya certificate of secondary education, (K.C.S.E) Examination report. Nairobi: KNEC
[7]
Mang’ana Secondary School, Exam series (2015). The year 2015, End of Term Examinations for Form 1 Term 2. Webuye, Kenya.
[8]
Origin (Origin Lab, Northampton, MA)
[9]
P-value calculator for an F-test (http://www.danielsoper.com/statcalc3/calc.aspx?id=7) accessed online on 25th December 2015.
[10] Republic of Kenya (2007). Kenya Vision 2030: A globally competitive and prosperous Kenya. Nairobi: Government printers. [11] Sekaran U (2010). Research methods for business: A skill building approach (4thed.). New Delhi: Wiley India [12] Smetana L K, Bell RL (2012). Computer simulations to support science instruction and learning: A critical review of the literature. In. J. Sci.Educ., 34(9):1337-1370 [13] Tanel Z, Erol M (2008). Effects of cooperative learning on instructing magnetism: Analysis of an experimental teaching sequence lat. AM. J. Phy. Edu, 2 (2):124.
8
James Sifuna et al.: Computer Modeling for Science, Technology, Engineering and Mathematics Curriculum in Kenya: A Simulation-Based Approach to Science Education
[14] Ted A. Baumgartner, Matthew T. Mahar, Andrew S. Jackson, David A. Rowe Measurement for Evaluation in Kinesiology 2016, page 372. https://books.google.co.ke/books?id=_oCHCgAAQBAJ&prin tsec=frontcover#v=onepage&q&f=false
[15] Thiong’o, JK (2013). Effects of computer-based instructional simulation module on secondary school students’ achievement and attitude towards physics and perception of classroom learning environment in Nyeri County. Unpublished Master’s Thesis, Egerton University, Kenya.