1 la assumes that the rate at which a ..... Orleans, Louisiana, 1504-1509. 104. T. RAITH .... Flow Control in Computer Networks, Versailles, France. 335-347. 139.
Computer Science Department Technical Report University of California Los Angeles, CA 90024-1596
PERFORMANCE EVALUATION OF DISTRIBUTED COMPUTER-COMMUNICATION SYSTEMS
Leonard Kleinrock
October 1988 CSD-880084
Form Approved OMB No. 0704-0188
Report Documentation Page
Public reporting burden for the collection of information is estimated to average 1 hour per response, including the time for reviewing instructions, searching existing data sources, gathering and maintaining the data needed, and completing and reviewing the collection of information. Send comments regarding this burden estimate or any other aspect of this collection of information, including suggestions for reducing this burden, to Washington Headquarters Services, Directorate for Information Operations and Reports, 1215 Jefferson Davis Highway, Suite 1204, Arlington VA 22202-4302. Respondents should be aware that notwithstanding any other provision of law, no person shall be subject to a penalty for failing to comply with a collection of information if it does not display a currently valid OMB control number.
1. REPORT DATE
3. DATES COVERED 2. REPORT TYPE
OCT 1988
00-00-1988 to 00-00-1988
4. TITLE AND SUBTITLE
5a. CONTRACT NUMBER
Performance Evaluation Of Distributed Computer-Communication Systems
5b. GRANT NUMBER 5c. PROGRAM ELEMENT NUMBER
6. AUTHOR(S)
5d. PROJECT NUMBER 5e. TASK NUMBER 5f. WORK UNIT NUMBER
7. PERFORMING ORGANIZATION NAME(S) AND ADDRESS(ES)
8. PERFORMING ORGANIZATION REPORT NUMBER
University of California,Computer Science Department,Los Angeles,CA,90024 9. SPONSORING/MONITORING AGENCY NAME(S) AND ADDRESS(ES)
10. SPONSOR/MONITOR'S ACRONYM(S) 11. SPONSOR/MONITOR'S REPORT NUMBER(S)
12. DISTRIBUTION/AVAILABILITY STATEMENT
Approved for public release; distribution unlimited 13. SUPPLEMENTARY NOTES 14. ABSTRACT
See Report 15. SUBJECT TERMS 16. SECURITY CLASSIFICATION OF: a. REPORT
b. ABSTRACT
c. THIS PAGE
unclassified
unclassified
unclassified
17. LIMITATION OF ABSTRACT
18. NUMBER OF PAGES
Same as Report (SAR)
58
19a. NAME OF RESPONSIBLE PERSON
Standard Form 298 (Rev. 8-98 Prescribed by ANSI Std Z39-1
Performance Evaluation of Distributed Computer-Communication Systems Leonard Kleinrock1 Computer Science Department, University ot California Los Angeles, California 90024-1596. USA
The computer-communication field is rich with extremely challenging problems for the queueing theorist. In this paper, we describe a number of computercommunication applications in wide-area networks, packet radio networks and local area networks. All of these involve sophisticated queueing theoretic models which have led to advanced applications of existing theory and in some cases, to new methods in queueing theory. A significant component in many of these applications is that ot multi-access to a common resource (typically, a communication channel); we devote a significant portion of this paper to multi-access systems. In addition to identifying problems of interest to the queueing theorist, this paper summarizes the latest results for the mean response time of many current computer-communication applications
1. INTRODUCTION The advent of the digital computer brought about a major rebirth in applied queueing theory. Indeed, since the early 1960's we have seen a sequence of applications in the information processing field which have challenged the capabilities of that theory and which have forced the theory to be extended in new directions. There is no reason to believe that thai challenge will subside for some time to come. The response to these challenges has produced some important extensions in queueing theory. For example, there has been a major (and largely successful) assault on queueing networks of various kinds. Some of the results are quite beautiful, and exhibit robustness in various directions (see (81]). We have also seen the development of some very important approximation techniques. Multi-access and broadcast communication problems have forced us to develop further analytical techniques. Many of the applications lead to coupled queues which involve two-dimensional queueing problems in the simplest cases, and higher dimensions in the usual cases: here too. new approaches in queueing theory have had to be developed (e.g.. the solution of RiemannHilbert problems). Due to the difficulty of many of these problems, we find 1. This work was supported bv the Defense Applied Research Propels Agencs under Contract No. MDA 903-82-C-0064.
2
L Kleinrock
that the theory has had to tread a very fine line between approximation and attention to detail. We organize this paper as follows. In Section 2. we discuss the problems inherent in sharing resources in a distributed environment. In Section 3. we discuss response time and 'power' as measures of system performance. Computer network performance analysis, design and buffer sharing are discussed in Section 4. A large number of multi-access schemes are described and evaluated in Section 5 (the largest section of this paper). Finally, in Section 6. a few ideas from the distributed processing field are presented. 2. DISTRIBUTED RESOURCE SHARING AS A PROBLEM IN QUEUEING THEORY The earliest problems from information processing which we addressed using queueing theory were simple isolated problems (e.g.. memory access). Shortly thereafter, the first major class of problems arose in an attempt to analyze and design computer networks [55]. It was recognized immediately that the exact analysis of networks was hopelessly intractable and so some key (and sweeping) assumptions had to be introduced to allow for a solution (see Section 4.1). But this analysis was, in some sense, premature; in the mid-60's, the computer industry was not yet aware of the need for networks, and so very little work continued in this direction at that time. Instead, the advent of time sharing caught the fancy of the data processing industry. It was found that these systems presented another major opportunity for the use of queueing theory to provide the tools for a proper analytic treatment (see LAVENBERG [81] for an excellent summary and history of this area). It was only in the late 60's that networking became fashionable and began to attract large numbers of researchers. Then, in the mid-70's, wireless communication systems (e.g.. broadcast satellite communications, packet radio, etc.) presented another set of challenges, and once again models, analyses and approximations were developed. The study of local area networks (LANs) followed in the early 80's and continues to occupy our attention up to the present time. A major driving force in all these developments was micro-electronics, i.e.. integrated chip technology. Of course, the major impact of VLSI was to radically drop the cost of computing and this led to advances such as supercomputers and personal computers: these, in turn, have led to parallel and distributed information processing systems. Indeed, distributed systems have emerged during this period in a variety of forms: distributed communications (e.g.. packet switching); distributed processing (e.g.. multiprocessing): distributed data base; and distributed control (e.g.. multi-access communications). There is a common theme shared by all of these systems, namely, the fact that they are all distributed. It is this that gives rise to some fascinating new problems for the queueing analyst. A distributed system represents a collection of resources (servers) which are provided to serve a set of users (customers). What makes these problems new is that users may not have convenient access to (nor knowledge of) all of these resources. Let us elaborate on this issue. In a classic single (or multiple) server svstem. all users have access to all the resources (i.e.. anv server can serve anv
Performance evaluation ol distributed computer-communication systems
3
customer) and. in addition, all users can 'see' the queue (i.e., the users themselves can observe which position they currently occupy in the queue). This is an ideal situation in that the server acts as a perfect dynamically shared resource. In a distributed system, we do not ordinarily have the luxury of such a perfectly organized queue. Let us list the ways in which a user may not have proper access to a resource: 1.
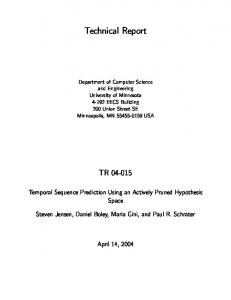
The resource may be forbidden (completely inaccessible) to a user For example, if we had two separate single server systems, the second server is inaccessible to the first server*s customer stream. A simple study to quantify the cost of this inaccessibility was published in [82]. The model was that of M identical and independent M/M/l queues, each operating at a utilization factor, p. The quantity Q = ,P[at least one customer is waiting in some queue and at least one server is idle] was found to be equal to Q - 1
+ (i -p/v-a+pri
(2.1)
Fig. 1 shows this function and clearly demonstrates that this distributed system invokes a large cost (as measured by Q) when A/»l for all values of p inside the unit interval.
o.tX«\ e4 l >i We.
FiGURE 1. Performance of M Ml Ml I aueueing systenn
4
L. Kleinrock
A second (simple) way to quantify this cost of inaccessibility is to compare the mean response time, TM. for these M systems to the mean response time, T\, of a single M/M/l system serving the total input from the M streams and with a large server who is M times faster than each of those above. That is. if each of the M separate systems has an input rate X and a mean service time 3c, then the single large server system has an input rate M X and a mean service time x/M. In both cases, the server utilization is p — Xx. From M/M/l theory [59], we find this ratio to be -y- ~ M
(2.2)
for all 0*Sp
Lastly, for the limited case, we have Ir (5.17) MCA 2(l-p-rA)
b 2C
Note that the result comparing these three expressions with those for the cyclic case (see (5.13)), also holds for this random case. Moreover, the differences among the three mean waits in the cyclic case and in the random case are the same. As mentioned earlier, these polling system results have been applied to a number of computer-communication problems. In the remainder of this section, we discuss a few such applications. In [125] roll-call polling is used to model discrete-time message flow from a set of M packet radio terminals to a central receiving station. The central station sends a fixed length poll to each terminal inquiring about traffic. The (one-way) propagation delay is L seconds. The constant walking (polling) time is r - (2L + Tp) where Tp is the time to transmit the polling request; clearly, also, S2 = 0. The message packets have a constant length of b bits (and take x = b/C seconds to transmit over the channel of C bits/sec) and arrive according to a Poisson process at a rate of \/M messages per second at each terminal. As in (2.3), a = LC lb. The system throughput is simplv S — )Cx = p. For this application, the mean wait is given by (5.7) which yields
S^ + (\-j-)R
24
L. Kleinrock
If we convert this application to continuous time, then (5.8) gives
W =
2(1-S)
(5.19)
Hub-go-ahead polling has been adapted in [69] to create the Mini Slotted Alternating Priority access scheme (MSAP) which was the predecessor of the token ring access method. (The Broadcast Recognizing Access Method (BRAM) [20] is similar to MSAP.) It is implemented by preassigning a cyclic polling sequence to the terminals and synchronizing their clocks. When the «i-th terminal finishes transmitting its messages, all other terminals will hear a silent period of L seconds (a minislot). At that point, terminal (m + 1) modulo M will recognize that it is his turn to transmit. If he has data, he transmits it and the process of 'token-passing' continues. If he has no data to send, then he remains silent and after another minislot of silence, terminal (m + 2) modulo M receives his turn, etc. In this case, r = L and again. S2 = 0. We then find from (5.7) that the normalized mean wait is
S^+(l--^-)ML+(\-S)L W =
— 2(1-S)
(5.20)
C" The token ring has been treated by Bux [14] by applying (5.8). In the token ring, as in MSAP, a control token is circulated around a ring. Upon receiving a free token, a user has the right to transmit his message (using the exhaustive service policy); if he has any messages, he marks the token as busy and transmits his data on the ring local area network, addressing this data to his intended receiver. When the data returns to him after circulating around the ring, this user removes the data he transmitted and then marks the token as free. Applying our result, we have
A^1 + (1 - jr)L W =
— 2(1 - S)
y(5.21)
'
In the case of a gated service policy for the token ring, we may use (5.10) to obtain
W =
*? +
(5.22) K '
In the case of a limited service policy, we have from (5.12)
X? + (1 + j^)L W = — ^ 2(1 -5 - r\)
(5.23)
These last two results were also given in [119] and [26]. In [26], De Moraes and Rubin also give the mean wait for the token bus. in which a token passes
Performance evaluation ol distributed computer-communication systems
25
along a bidirectional local area network bus among terminals which may not necessarily be adjacent on that bus. These expressions differ from those above only by the propagation delay which now increases to the entire length of the bus rather than the mter-terminal propagation delay used in the ring. We close this section by listing a few of the many other applications of these polling results to computer-communication problems. Polling with finite storage capacity is treated in [133]. Multiple servers are treated in [96] and [104]. The Fasnet system is evaluated in [45] and also in [130] which also evaluates Expressnet. Automatic repeat request (ARQ) retransmission systems may be found in [75]. Newhall loops (one of the first loops proposed) are discussed in [18] and [19]. The register-insertion ring is analyzed in [46]. Nonsymmetric token rings are treated in [29]. 5.4.3. Reservation protocols. Polling schemes (and Tree Access Schemes - see Section 5.5.3) are basically passive schemes in which users wait to be asked if they have any data to send. Reservation schemes allow the user to actively request access to the channel. The idea is that a portion of the channel time or bandwidth is set aside as a reservation subchannel. Users place reservations on the reservation subchannel for space on the data subchannel. Once the reservation is accepted, then the user is guaranteed space on the data subchannel, and everyone in the system knows that he has that space reserved. There are a large number of different reservation schemes described in the literature. Some of them appear as hybrid schemes which incorporate certain features of static and random assignment algorithms. In this section, we briefly describe a few of these. One of the first reservation schemes described was that of ROBERTS [107]. Here, the channel is slotted into data slots, with the occasional introduction of a reservation slot. A reservation slot is subdivided into a number of smaller slots (which are used for reserving data slots), and these slots are accessed by the users via slotted ALOHA (see Section 5.5.1). When a reservation makes it past the ALOHA contention, all users hear the request and schedule that user for the number of data slots he requested using the first available unassigned data slots; thus a 'queue in the sky' is maintained and does not require a central controller to do the scheduling. The Split channel Reservation Multiple Access scheme (SRMA) divides the channel by frequency division into the data and reservation channels [125]. It operates in one of two modes, depending on whether the reservation channel is used as a single channel (which carries both requests for space by the user and replies to these requests which give the user permission to begin transmitting) or as two control channels (one for requests and one for replies which schedule the request in the future). Control signals may compete for space on the request channel by any access scheme (e.g.. some random access scheme). Global Scheduling Multiple Access (GSMA) creates a reservation channel (for communicating to a central controller) and a data channel, both with no collisions using TDMA [83]. This is accomplished by using two subframes in each major frame. Each subframe consists of a number of slots. The control
26
L. Kleinrock
subframe has one slot assigned to each user for making his reservations. The central controller assigns slots in the data subframe according to the requests. In a satellite environment, Reservation-ALOHA [24] uses a frame consisting of a fixed number of equal sized slots; the frame is longer than the propagation delay. A user who successfully transmitted in a given slot in the previous frame has the exclusive use of that slot in the next frame. If a slot was either idle or contained a collision in the previous frame, then it is 'up-for-grabs' by any user; such a slot is accessed using ALOHA. A similar scheme, the Round-Robin Reservation Scheme [7], uses the same frame structure, but guarantees that the number of slots in a frame exceeds the number of users. One slot in each frame is permanently assigned to each user. In addition to sending his data packets, a user appends to each packet a count of how many more packets he has queued. When a slot contains a count of zero, then it is assigned by some collision-free algorithm (in this case, by round robin) to another user. When the original 'owner' of a slot wishes to transmit and another user has been assigned his slot, then the original owner transmits, causing a collision, thereby announcing that he is taking his slot back. In [10] the Split Reservation Upon Collision (SRUC) access scheme is described. It uses fixed length slots, each of which is partitioned into a data subslot and a control subslot. Ordinarily, the data subslots are in the contention mode, in which case, any user may access them. Whenever a collision occurs, however, all data subslots switch to the reserved mode which means that they will all be used to resolve the conflict only among those users who created the collision; no new users may enter the fray until the conflict is fully resolved. The control subchannel is used by a subset of the conflicting users to assist in the conflict resolution. The Tree access schemes of Section 5.5.3 operate in a similar fashion. The Priority-Oriented Demand Assignment access method (PODA) uses implicit as well as explicit reservations, priorities, and centralized as well as distributed control [50]. The channel is divided into two subframes - a data subframe and a control subframe. The data subframe contains data and piggybacked control information. The control subframe is used to hasten the delivery of urgent control information. Control frame access can be any of a number of suitable types. The fraction of control versus data subframes can be dynamically adapted to loading conditions. Group Random Access (GRA) uses a TDMA access method, where groups of users (rather than individual users) share fixed TDMA slots using (possibly) different access schemes for each group [109.110]. 5.5. Random assignment algorithms In these schemes, more than one user may attempt to use the channel at the same time, resulting in a collision; in this case no successful transmission occurs. On the other hand, one of the users may be lucky and find no one else using the channel, in which case he will be successful. Such schemes are discussed in this section.
Performance evaluation of distributed computer-communication systems
27
5.5.1. ALOHA. ALOHA access schemes are, in some sense, the most random. Essentially no constraints are placed on the users; they are allowed to transmit any time they wish. Packets are assumed to be of fixed length {exactly one slot long). The ALOHA access algorithm was introduced by ABRAMSON [1] in an unslotted environment (i.e., users were completely unsynchronized). The relationship between the input 5 and the channel traffic G (recall we are using the bold Poisson assumption) is S = Ge~2G.
(5.24)
This leads to a maximum throughput of S = \/2e = 0.184... (packets per slot) which occurs at G = 0.5. An improvement was recommended by ROBERTS [106] by going to a slotted system in which a minimal constraint was placed on users whereby they could begin transmission only at a slot boundary. That is, time was discretized into intervals exactly one slot in duration. With this modification, the 5, G relationship becomes S = Ge~c.
(5.25)
The maximum throughput is now equal to S = Me — 0.368... and this occurs when G — \. At G = 1, the expected number of transmissions is exactly one (satisfying one's intuition regarding optimality). We saw this optimality point occur in our discussion of power in Section 3.2; it occurs in many other situations as well (see, for example, [138]). We note further that the expected number of transmissions required by a packet is simply G/S\ the expected number of unsuccessful transmissions is (G/S) — 1. In 1973, ABRAMSON [2] analyzed the throughput for slotted ALOHA systems with a finite number of users. He found, among other things, that the maximum throughput profile occurred when G = 1, exactly as with the infinite population model. In 1973, KLEINROCK and LAM [57,76] established the equations for the mean response time of the slotted ALOHA system. (It was no surprise to find that the behavior at light load is excellent, but that it badly degrades as the load increases toward S — \/e). This analysis for an infinite population slotted ALOHA model used the bold Poisson assumption and assumed that retransmissions were uniformly selected over the next K slots once a user learned that his packet was unsuccessful; among the results obtained there was the following for the mean wait: W= 1-=-
CK
2
'
+ L.
(5.26)
where -c K
and
+f
(5.27)
28
L Kleinrock A:-I
-G
A:
1> =
4-
G
(5.28)
and (5.29)
S =
The detailed behavior of slotted ALOHA with a finite population of M unbuffered terminals may be described by a discrete-time Markov chain given by the number of backlogged terminals at the slot boundaries [60.76]. Only when a terminal's buffer is empty may a new packet be generated (by the terminal's external source) and this will occur with probability o in a slot. The combined input rate into all terminals at time (slot) t is denoted by S(t). For this Markov chain analysis, we define p to be the probability that a backlogged packet retransmits in the next slot (of duration x seconds) and often is taken as a given parameter of the problem. Thus, the retransmission delay is geometrically distributed with a mean of x/p seconds. We let N(t) be a random variable representing the total number of backlogged terminals at slot / (referred to as the channel backlog at /). The vector \N(t\ S(i)] is the channel load at time t. For N(t) = n we have [ N(t), S(t)} = [ n, (M - n) a ],
(5.30)
giving rise to what we call the linear feedback model. Let PlJ
- P[N(t + 1) = j\N(t) = i].
Then, these one-step transition probabilities are simply [60.76]
P oo and o -^ 0 (such that Ma = 5), we have the infinite population model in which new packets are generated for transmission over the channel at the constant Poisson rate S (packets per slot); in this case. (5.32) gives 5ou«(«) = (1 ~ p)"Se-s + np(\ ~prles.
(5.33)
Given that the input and output rates may differ, it was natural [58] to investigate the difference S(t) — •SoW(/) which has since come to be known as the drift; the drift is simply the expected growth of the channel backlog in a slot. If we assume a steady state (more on this later), then, following [128] the expected output rate, S, is given by S = 2 S«*in)pn,
(5.34)
and Nq the average number of backJogged terminals may be found from N, = 2 "P».
(5.35)
If we use Little's result, we find the mean wait in this slotted ALOHA system to be W = -4-S
(5.36)
Since the output and input rate, on average, must be equal in equilibrium, we have S = (M - tf,)o
(5.37)
W = [(M/S) - (I/o)) x.
(5.38)
and so
Let us examine the dynamic behavior somewhat further, if we assume the channel backlog is N(i) — n. then we may calculate Snu,(n) as a function of n and S(M). If we further identify the equilibrium contour to be the projection of the curve Sou,(«) = S(n) onto the (n,S(n)) plane (where we denote S(t) by S(n) when N(i) = n), then we obtain the curve as shown in Fig. 5.
30
L. Kleinrock
•*S(n) FIGURE
5. The equilibrium contour
In this figure, the shaded area corresponds to the region where the drift is negative (i.e., S^in) > S(n)) and N(t) tends to reduce; outside the shaded area, the drift is positive (S^in) < S(n)) and N(t) tends to increase. In Fig. 6, we show four such curves along with the channel load line, n = M — S(n)/a (see (5.30)); these curves are obtained by selecting different values for the retransmission probability, p. The system is constrained to lie on the load line. If the system state is in the shaded region, then the backlog decreases down the load line; if not, it rises up the load line. Since we expect the system to he in the vicinity of the equilibrium contour, and since we require it to he on the channel load line, then any intersection of the load line with the equilibrium contour is a point to be studied. In Fig. 6a. we observe that there is only one such intersection which we refer to as the channel operating point. We also observe that the drift will drive us back to this point if the system takes any excursion along the load line away from this point. Such a point (where the drift pulls us back) is a stable equilibrium point. If the svstem has only one such stable point, the channel is said to be stable. See Fig. 7a for the distribution of backlog for a stable channel. On the other hand, in Fig. 6b, we see a case with three intersections, two of which are stable. The third (middle) point is such that the drift will drive us away from the intersection if we take a small excursion along the load line; such a point is called an
Performance evaluation of distributed computer-communication systems
31
unstable equilibrium point. A channel with two stable points and one unstable point is referred to as a bistable or an unstable channel; such a channel will spend its time largely in the vicinity of the two stable points and will occasionally drift between the two (as can be seen from the backlog distribution shown in Fig. 7b). Of the two stable points in Fig. 6b, the one with large backlog and small throughput is clearly undesirable and is referred to as the channel saturation point; the one with large throughput and small backlog is the (channel operating) point at which we would like to operate. In Fig. 6c, we show the case of an infinite population channel; clearly all infinite population channels are unstable unless some dynamic control policy is used (see below). An overloaded or saturated channel is one with a single stable operating point which occurs for large backlog and small throughput, as shown in Fig. 6d; its backlog distribution may be seen in Fig. 7c. CHANNEL SATURATION POINT
CHANNEL OPERATING POINT
CHANNEL OPERATING POINT
*>S(n)
rl CHANNEL SATURATION POINT
LU Z -J
i
nc
!»\;;
•'•••;:':'!^
WWm&X/ltyM
ia
Ho
S(n) FIGURE
6. Stable and unstable channels
32
L Kleinrock
—r„,
0.3
1
T
I
I
I
I
1
1
(a) STABLE CHANNEL 0.2 "
0.1 -
n .
° J
-
II I11. .
i
i
i
i
i
i
i
o.i
ü
z
D 0.08 h
li.
(b) UNSTABLE (BISTABLE) CHANNEL
w £ 0.06 (-
s
£ 0.04
5 0.02 EG
8Q-
Lu_
llMMIIMIllllllI
o 0.10.08 -
(c) SATURATED CHANNEL
0.06 0.04 0.02 0
••••ill
_L
0
10
20
30
CHANNEL BACKLOG FIGURE
7. Distribution of backlog
40
50
Performance evaluation of distributed computer-communication systems
33
The ideas regarding stability and equilibrium points described in [60.76] led [321 to develop a method known as Equilibrium Point Analysis (EPA): this method was extended by Tasaka who wrote a comprehensive monograph on the subject [122], The formal idea behind EPA is to assume thai the system is always at an equilibrium point (i.e. at a point of zero drift). Furthermore, in the EPA approach, the expectation of any random variable taken with respect to the channel backlog, N(t), is approximated by the value of that random variable at the equilibrium point. In [122], this method is applied to evaluate the throughput and mean delay for a number of multi-access schemes (Slotted ALOHA, Reservation ALOHA, TDMA. SRUC. buffered CSMA/CD - see below, and BRAM). For an analysis of slotted ALOHA with a finite number of buffered terminals, see [111,122]. The fundamental instability of ALOHA systems we have identified above was studied in [27,60,76]. In order to stabilize ALOHA, a number of dynamic control algorithms have been introduced and studied (e.g., [7,41,42,60,64,76,77,78,79,90,105,111]). These stabilization methods typically control either the input rate to the system or the retransmission parameters as a function of the backlog (or an estimate of the backlog). As an example of retransmission control, let us observe the behavior of the otherwise unstable channel shown in Fig. 6b. We see that as we move along the load line (due to statistical fluctuations), the drift is negative as long as n < nc. Suppose we track (perhaps only an estimate of) the backlog and find that n = nc; we are now in danger of entering the (unstable) region of positive drift for n > n(. However, if we now reduce p, the retransmission probability, then the equilibrium contour will change to that shown in Fig. 6a and we will once again find ourselves in a (stable) negative drift situation! Of course, this reduced value of p implies a longer delay between retransmissions which is not a desirable situation. In order to remedy this, we switch back to the original value for p when n faUs below nc giving us negative drift and smaller retransmission delay once again. Thus, by tracking the backlog, n, we dynamically control the channel in a fashion which guarantees stability. Since ALOHA is fundamentally unstable, the performance of stabilized ALOHA is of interest. The distribution of delay is found numerically in [21] for a stabilized slotted ALOHA system. In [35], an approximate expression for the mean wait of a stabilized slotted ALOHA is given as FUKUDA
W =
JL
c
t
_ j_ I
1 - eS
(es ~ l)(f ~ 1) b - {B (es - Die - 1)
+ L.
(5.39)
34
L. Klemrock
5.5.2. The urn model. The URN scheme [67] was devised to behave like ALOHA at light load and TDMA at heavy load; thus, in some sense, it is an adaptive access scheme. Its principle of operation is to divide the population of conflicting users into subgroups each of which is likely to contain only one busy user and then to select one of the subgroups to transmit. In this scheme, we assume that we have a slotted channel supporting M user terminals. At the beginning of each slot, we assume that every user knows N, the exact number of users that have packets ready to send; they simply do not know the identity of these busy users. Based on this knowledge, what is the optimum way for this information to be used? If we require all users to behave in a symmetric fashion, i.e., each busy user will transmit into the next slot with an equal probability, say P. then the optimum policy is P = l/N. However, symmetric policies are clearly not optimum as can be seen in Fig. 8. This figure shows the throughput for M = 2 and N = 2 as a function of the probability of transmission for each of the two users. Indeed, the optimum (asymmetric) policy for this case is for one of the busy users to surely transmit (Pt = 1) and for the other to keep quiet (Pj = 0) where ij = 1,2, and i^j. However in a distributed environment it is difficult to select a single busy user when one only knows how many in the total population are busy.
FIGURE
8. Throughput surface for two busv terminals
Performance evaluation of distributed computer-communication systems
35
As shown in [67], the optimum policy, then, is to select a critical number of users, Ac, and to give each of these permission to transmit; the only users who will transmit are those that are both busy and selected. The value of Ar is chosen to maximize the throughput. This is equivalent to maximizing the probability of selecting exactly one busy user; in this case, it will also be true that the expected number of busy users selected will be equal to unity. The value of A; is found from the following expression A: =
it
(5.40)
N
where [X\ denotes the integer part of X. In order to guarantee that all users select the same set of k users, one can require that each user use the same pseudorandom number generator to make the selection; in fact, it is only required that each user decide whether he, himself, is to be selected (again, using the same pseudorandom generator). The throughput is given by bin(M -
M N
M ,N - - 1) N
bin (MJv)
(5.41)
a\ b\(a — by The algorithm is quite robust, not even requiring that all users have exactly the same estimate of the number of backlogged users. where we have denoted the binomial coefficient as b'm{a,b) =
5.5.3. Tree access schemes. Tree access algorithms (also known as splitting algorithms) represent a variation of the key idea in the URN model. Once again, we are interested in dividing up the potentially conflicting users into smaller groups, thereby reducing the difficulty of resolving the conflict. (Of course, polling and token passing represent a mechanism for reducing the number of competing users down to a single user.) The idea here is to find some property of the competing users which allows them to form subgroups; each subgroup will be resolved separately in some sequential fashion. The process may be applied recursively to further divide each subgroup into subsubgroups, etc. In 1978, a few months after the URN model was published. Hayes introduced a method known as 'probing' [43]. Independently, and at about the same time, CAPETANAKIS [15,16] and TSYBAKOV and MIKHAILOV [134] introduced the Tree Algorithm which has since had many refinements and improvements. Sometime later, Molle and KJeinrock published the Virtual Time CSMA protocol [93,94]. All of these fall into the class of Tree Access Schemes. In the probing algorithm, subgroups of users are polled rather than polling individual users. The idea is to attempt to eliminate many idle users simultaneously. Each user is assumed to have a unique identifier (usually a binary address) which is used to form the subgroups. For example, suppose we had a population of 16 users. By means of a centralized poller (or some equivalent
36
L Kleinrock
distributed polier), the entire population is simultaneously asked if anyone has a message to send. Any users with packets to transmit would respond in the affirmative by transmitting energy on the common channel. If a response is heard on the common channel, then the poller splits the population into two equal sized (sub)groups (say users 1 to 8 and users 9 to 16). The first group is then polled. If no answer returns (indicating that users 1 to 8 are idle), then the second group (9 to 16) is polled. Suppose, in fact, only the second group responds; it is then split further (into 9 to 12 and into 13 to 16). The process continues until a responding subgroup contains only one user, in which case the (single) user transmits his message. Then, the most recent responding subgroup is polled until it, too, is reduced to one responding user, etc. With such a procedure, large groups of idle users are eliminated very easily. It is also possible to adjust the size of the groups polled according to the traffic load on the system. Indeed, the optimum size group to poll is such that the probability of finding that group idle is 0.5 based on information theoretic arguments. Hayes provides an analytic treatment of probing in his text [44]; there he solves for the cycle time behavior and for the mean message delay. The original Tree algorithm [16,134] operates as follows. When a collision occurs, say in the k-ih slot, then all users not involved in that collision suspend their activity until those involved in the collision fully resolve their conflict. The conflicting users randomly split into two subgroups (say using the same pseudorandom coin flips or based on the user's address or based on the arrival time of the user's packet). The first of these subgroups transmits in slot k + 1. If this results in an idle or a success^ then the second subgroup transmits in slot k + 2; otherwise, the second subgroup suspends (until the first subgroup resolves their conflict) and the first subgroup splits again into two further subsubgroups, etc. When all packets from this first subgroup are successfully transmitted, the second subgroup proceeds. When the second subgroup finishes, then all (or possibly, a subset whose size is selected optimally as a function of the traffic) of the originally suspended busy users, plus any new ones which turned busy during the previous conflict resolution period, will transmit and the process repeats. As shown in [16], the maximum throughput (for the case where number of users that come out of suspension is chosen optimally) is 0.43... packets per slot. A Tree access algorithm using ternary feedback (terminals can distinguish idle, success and collision slots), immediate transmission by newly generated packets and m-arv. as opposed to binary, splitting using minislots is presented in [99]; assuming .x = b/C and L = 0. they obtain 'ae2a (1 - -Li^