Dec 23, 2013 - Departamento de Fısica, Instituto de Fısica Aplicada, Universidad Nacional de San Luis-CONICET, Chacabuco 917,. D5700BWS San Luis ...
PHYSICAL REVIEW E 88, 062407 (2013)
Computer simulation and detailed mean-field approximation applied to adsorption on nanoparticles O. A. Pinto and B. L´opez de Mishima Centro de Investigaciones y Transferencia de Santiago del Estero (CITSE), Universidad Nacional de Santiago de Estero-CONICET, Ruta Nacional 9, Km 1125, Villa el Zanj´on, 4206, Santiago del Estero, Argentina
M. D´avila and A. J. Ramirez-Pastor Departamento de F´ısica, Instituto de F´ısica Aplicada, Universidad Nacional de San Luis-CONICET, Chacabuco 917, D5700BWS San Luis, Argentina
E. P. M. Leiva and O. A. Oviedo Instituto de Investigaciones de Fisicoqu´ımica de C´ordoba (INFIQC) CONICET, Departamento de Matem´atica y F´ısica de la Facultad de Ciencias Qu´ımicas, Universidad Nacional de C´ordoba, X5000HUA, C´ordoba, Argentina (Received 28 June 2013; published 23 December 2013) Adsorption thermodynamics of interacting particles adsorbed on icosahedral and truncated octahedral nanoparticles was studied by a detailed mean-field approximation and Monte Carlo simulations. The nanoparticle is tackled as a multivariate surface, where different types of adsorption sites occur according to coordination with nearest neighbors. In addition, lateral couplings between the adsorbed particles are considered. The analysis covers a wide range of interactions, extending from physical to strong chemical bonds, and different sizes and shapes of nanoparticles. DOI: 10.1103/PhysRevE.88.062407
PACS number(s): 05.50.+q, 75.40.Mg
I. INTRODUCTION
Nanosystems have been studied in several different fields such as physical chemistry, physics, biology, and medicine, just to name a few [1–4]. The ability to manipulate nanoparticles (NPs) and atoms at will dates from relatively recent times [5], but Hill [6,7] already drew the basis of the thermodynamics that he called “of small systems” in the 1960s. These small systems show a behavior different from those involving a big number of particles (of the order of Avogadro’s number) sometimes called “nanosize effect”. For example, when size goes down, NPs show a decrease in melting temperature [8], a decrease in redox potential [9], an improvement in the catalytic activity [10], structural changes involving a transition from fcc to icosahedral symmetry [4,11], and may even exhibit magnetism which is absent in the bulk material [11]. In many cases, these nanomaterials present scaling laws of their properties with the reciprocal of the size [11]. From the theoretical point of view, NPs qualify as “small systems” in the sense considered by Hill, because they are composed of a few hundred (at the most a few thousand) units. Therefore, the formalism developed by this author can be used to describe the physical behavior of NPs. The calculation of their properties by statistical mechanics involves an ensemble average; this means to average over all possible NP configurations. A priori it would seem that we have the formidable problem of infinite contributions. However, in many cases the average may be weighted in such a way that many configurations may be neglected. A more rigorous discussion of this topic can be found in Chapter 10 of Ref. [12]. Hence, a good approach should consider the more compact configurations, such as the shape most favored in the experiments, like icosahedra, octahedra, decahedra, cuboctahedra, etc. [4,10,12,13]. The study of surface adsorption processes in finite systems is critical to the understanding of matter at the nanoscale. This is particularly important in NPs, since adsorption on them 1539-3755/2013/88(6)/062407(9)
is related to a large number of applications, ranging from catalysis and electrocatalysis to nanomedicine [10,13–17]. An example of the controlled decoration of NPs can be found in the electrochemical generation of core-shell NPs [18–20] where even the targeted decoration of selected facets may be achieved. It is generally found that the adsorptive properties of NPs can be affected by factors such as size and shape of the core, chemical composition, and under or oversaturation conditions [18]. Many of the early simulations involve the use of many-body potentials and off-lattice models, which are expensive from a computational point of view [21–23]. A suitable alternative to circumvent this problem is the use of lattice models, where the particles of the system may be assumed to occupy discrete positions in space. This approach has been used successfully in a number of studies of supported NPs [24–27] to consider the change in the shape and surface morphology of the NP under the influence of the reaction media. A similar approach has been applied recently to unsupported NPs [28]. While most of the simulations performed in the present work are feasible in a couple of days in an ordinary computer, the systems considered are still rather small as compared with experimental ones, which in some cases involve nanoparticles made of a number of atoms laying order of magnitudes over those simulated here. In this respect, theoretical approaches involving little computational effort are highly desirable. Note that it takes about 2 or 3 days to obtain a typical adsorption isotherm by using grand canonical Monte Carlo (GCMC) simulations, while the corresponding theoretical isotherm can be obtained in seconds. Returning to theoretical modeling of adsorption, the simplest model is to consider an adsorption energy distribution (AED) in the case of an infinite surface, determined by inverting the following integral equation [29]: � (1) θ (T ,μ) = θL (T ,μ,ε)f (ε)dε,
062407-1
©2013 American Physical Society
O. A. PINTO et al.
PHYSICAL REVIEW E 88, 062407 (2013)
where θ (T ,μ) is the mean total coverage at temperature T and chemical potential μ, θL is the local coverage (usually called the local isotherm) corresponding to an adsorptive energy, and f (ε) is the AED. Equation (1) is strictly and generally valid only for noninteracting particles and, for this reason this is considered an unrealistic model, even for infinite surfaces. An improvement of the previous model is to consider adsorbed particles interacting with each other. In this case, Eq. (1) should be rewritten by � � θ (T ,μ) = ... θL (T ,μ,ε1 ,...εm )f (ε1 ,...εm )dε1 ,...dεm , (2) where now θ (T ,μ) not only depends on the adsorptive energy at a given point on the surface but also on the adsorptive energy at (in general)“m” neighboring points, and f (ε1 ,...εm ) is a multivariate probability distribution which specifies how adsorptive energies are spatially distributed, or in other words, the energetic topography of the surface. In this context, Bulnes et al. [30,31] analyzed the case of bivariate surfaces, with particles interacting through a repulsive interaction by Monte Carlo (MC) simulations. Despite the complexity of the surface, different quantities were identified which scale obeying power laws as a function of the patch length and the difference of adsorptive energy between strong and weak adsorption sites. These findings provided a method to characterize the energetic topography of a class of heterogeneous surfaces which can be approximately represented as bivariate surfaces. In a previous work, we have described adsorption on nanoparticles of different sizes and shapes [28]. Using a lattice-gas model and GCMC simulations, we have analyzed adsorption isotherms, differential heats of adsorption, and other relevant thermodynamic properties as a function of nanoparticle size in a wide range of attractive interactions. In the present work, we focus our interest on the study of the adsorption on NPs from a rather theoretical point of view, in the framework provided by Eq. (2). Different surface sites can be distinguished on the surface of an NP; for example, in the case of an icosahedral NP, we find at least three types of sites (vertices, edges, and facets) and in the case of truncated octahedral, at least four types of sites (vertices, edges, and two different facets). For this reason, we will consider the surface of an NP as a heterogeneous surface. Similarly, the adsorption energy depends on the neighboring points, so the surface behaves like a multivariate topography. This heterogeneity can be tackled within a detailed mean-field approximation (DMFA). As discussed below, the effect of curvature at the NP is the main reason why we need an enhanced description. Rather than attempting to reproduce exactly the experimental environment, we will try to identify and characterize the most prominent features describing the adsorption phenomenon at the nanoscale. It must be emphasized that a direct extrapolation of the theoretical results to experiments, in general is a very difficult task and feedback from both parties would be required before drawing any conclusion. However, the trends observed in the simulations can serve experimentalists to diagram new experimental strategies and even understand the behavior of and the physics behind nanomaterials.
The paper is organized as follows. Section II describes the lattice-gas model applied to NPs, DMFA, and some basic definitions. Section III compares the results obtained from GCMC simulations with those from DMFA. Section IV summarizes the conclusions drawn. II. LATTICE-GAS MODEL AND THEORY A. Model
In this section, the main features of the lattice-gas model used to study the adsorption on a seed-NP surface are defined. We use the same nomenclature and definitions given in our previous work [28]. The preexisting substrate (seed-NP) is modeled as a set of NA type-A particles of a given geometry. This heterogeneous substrate is exposed to a monoatomic gas of B particles whose thermodynamic state is characterized by its chemical potential μ and temperature T . The M adsorption sites for the B particles are located on the surface of the seed NP and its magnitude depends on the NP size. No exchange moves between A and B particles characteristic of alloy processes are allowed. Taking into account coordination with nearest neighbors (NN), we can represent different types of adsorption sites such as vertices, edges, and facets. The most important quantities in the model involve the NN interaction energy between B particles with each other and the interaction energy between A and B particles, denoted with wBB and wAB , respectively. To describe a system of NB particles (NB � M) adsorbed at a given T and μ, the occupation variable ci is introduced ( ci = 0 or 1, if the corresponding site i is empty or occupied by a B particle, respectively). The adsorbed phase is characterized by the Hamiltonian: H = wBB
�
ci cj +
�i,j �
M �
(εi − μ)ci ,
(3)
i=1
where �i,j � represents pairs of NN sites on the NP surface and εi is the adsorption energy of a B particle on a surface site i. The adsorption-desorption process is simulated by a standard importance sampling MC method in the grand canonical ensemble. We consider that the seed NP is in contact with an ideal gas phase of particles. To satisfy the principle of detailed balance we used the Metropolis algorithm [32,33]. A Monte Carlo Step (MCS) corresponds to M attempts to change the state of the system. Before sampling the quantities of interest, thermodynamic equilibrium had to be established. For all our simulations, the equilibrium state was obtained discarding the first 5 × 10⁶ MCSs. Then, the next 2 × 10⁶ MCSs were used to compute averages. The mean coverage θ is obtained as a simple average: �NB � , (4) M where �· · · � means the average over the MC simulation run. θ (μ) =
B. Theory: Detailed mean-field approximation
Let us consider the adsorptive energy εi of a given site i of a heterogeneous surface as an energy level of an adsorbed particle. Due to lateral interactions, this energy level is effectively split into a number of sublevels with total
062407-2
COMPUTER SIMULATION AND DETAILED MEAN-FIELD . . .
(a)
PHYSICAL REVIEW E 88, 062407 (2013)
where wγ is the interaction energy of the particle adsorbed on the given site i with a neighborhood characterized by an index γ . Then, assuming that each site can only be occupied by a single particle, and if the effective energy levels γ are different (this is strictly true for a continuous distribution of adsorptive energies), the statistical ensemble of NB adsorbed particles would be described by the Fermi-Dirac statistics:
(b)
� � θγ Eγ = (c)
(d)
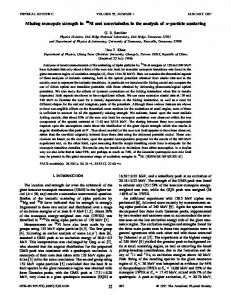
FIG. 1. (Color online) Schematic representation of an icosahedral nanoparticle. (a) The adsorption sites at the facets, edges, and vertices are represented by black, red, and blue spheres, respectively. Energy assignation to each type of site according to the different approximations: (b) DMFA3, (c) DMFA4, and (d) DMFA6.
adsorption energy: Eγ = εi + wγ ,
(5)
exp[−(Eγ − μ)/kB T ] , 1 + exp[−(Eγ − μ)/kB T ]
(6)
where θγ is the mean occupation number corresponding to level γ and kB is the Boltzmann constant. Icosahedral NPs are characterized, at least, by three different types of adsorbate-substrate energies, εi = {wAB ,2wAB ,3wAB }, which, according to the coordination number of the site correspond to vertex, edge, and facet sites, respectively [see Fig. 1(a)]. Likewise, octahedral NPs have, at least, four types of adsorbate-substrate energies, εi = {wAB ,2wAB ,3wAB ,4wAB }, that correspond to vertex, edge, (111)-facet, and (100)-facet sites, respectively [see Fig. 8(a)]. In relation to the particular case of icosahedral NPs, the simplest DMFA consists of distinguishing three levels, γ = 1(vertices), γ = 2(edges), and γ = 3(facets); see Fig. 1(b). We denote this approach as DMFA3. The corresponding interaction energies, calculated in the framework of the mean-field approximation, result in
w γ = [(number of neighbor sites type 1) × (probability of finding a site 1 occupied) + (number of neighbor sites type 2) × (probability of finding a site 2 occupied) + (number of neighbor sites type 3) × (probability of finding a site 3 occupied)] × wBB .
Accordingly,
and w1 = 5wBB θ2 ,
(8)
w2 = 4wBB θ3 + 2wBB θ2 ,
(9)
and w3 = 6wBB θ3 .
(10)
Therefore, the total adsorption energies are E1 = wAB + 5wBB θ2 ,
(11)
E2 = 2wAB + 4wBB θ3 + 2wBB θ2 ,
(12)
E3 = 3wAB + 6wBB θ3 .
(13)
and
θ3 =
θ2 =
exp [− (wAB + 5wBB θ2 − μ) /kB T ] , 1 + exp [− (wAB + 5wBB θ2 − μ) /kB T ]
6 , +1 15 (n − 1) f2 = , 5n2 + 1 f1 =
(14)
exp [− (2wAB + 4wBB θ3 + 2wBB θ2 − μ) /kB T ] , 1 + exp [− (2wAB + 4wBB θ3 + 2wBB θ2 − μ) /kB T ]
exp [− (3wAB + 6wBB θ3 − μ) /kB T ] . 1 + exp [− (3wAB + 6wBB θ3 − μ) /kB T ]
(16)
On the other hand, the total number of sites on the surface of a NP (M) can be characterized by a natural number n, which denotes the “nth” member of the geometrical family to which the NP belongs. For example, in the case of icosahedral NP with n = 1 we get M = 12, the lowest value of the number of surface sites for this kind of NP shape [28,34]. The quantity of adsorption sites for each γ -type site Nγ is shown in Table I for the particular case of icosahedral NP; similar equations follow for other families [28,34]. With this in mind, we can build the corresponding frequencies of occurrence fγ ’s that, in the case of icosahedral NPs, can be written as
From Eqs. (6) and (11)–(13), the partial adsorption isotherms can be obtained: θ1 =
(7)
5n2
(17) (18)
and
(15) 062407-3
f3 =
5(n2 − 3n + 2) . 5n2 + 1
(19)
O. A. PINTO et al.
PHYSICAL REVIEW E 88, 062407 (2013)
TABLE I. Different quantities characterizing the geometry, energy, and frequency of occurrence for the different theoretical approximations applied to a given family of icosahedral NPs. DMFA3
DMFA4
DMFA6
N1 N2 N3 N4 N5 N6
12 30(n − 1) 10(n2 − 3n + 2) – – –
12 30(n − 3) 10(n2 − 3n + 2) 60 – –
12 30(n − 3) 60(n − 4) 60 60 � � 10 (n − 3)2 − 3 (n − 3) + 2
E1 E2 E3 E4 E5 E6
wAB + 5wBB θ2 2wAB + 4wBB θ3 + 2wBB θ2 3wAB + 6wBB θ3 – – –
f1 f3
6 5n2 +1 15(n−1) 5n2 +1 5(n2 −3n+2) 5n2 +1
f4
–
f5
–
–
f6
–
–
f2
2wAB
wAB + 5wBB θ4 2wAB + 2wBB θ2 + 4wBB θ3 3wAB + 6wBB θ3 + wBB θ1 + wBB θ2 + 2wBB θ3 + 2wBB θ4 – – 6 5n2 +1 15(n−3) 5n2 +1 5(n2 −3n+2) 5n2 +1 30 5n2 +1
The system of Eqs. (14)–(16) can be easily calculated through a standard root-finding computing procedure; in our case, we used MAPLE software. Finally, the overall mean coverage is obtained as the weighted average of the partial coverage: θ (μ) =
3 �
fγ θγ .
(20)
γ =1
The accuracy of the total adsorption isotherm [Eq. (20)] can be improved by adding more detail to the model. This is possible by increasing the levels of the approximation given by Eqs. (14)–(16). Taking into account the environment of the adsorbed particles, different levels can be distinguished. To this aim, we also consider γmax = 4 and γmax = 6, and we denote such approaches as DMFA4 and DMFA6, respectively. Figures 1(c) and 1(d) show the new levels corresponding to DMFA4 and DMFA6, respectively. Table I depicts the total adsorption energy and frequency for these cases. Then the total coverage is calculated, as in the case of DMFA3, using MAPLE software.
wAB + 5wBB θ4 2wAB + 2wBB θ2 + 4wBB θ3 3wAB + 2wBB θ2 + 2wBB θ3 + 2wBB θ6 2wAB + wBB θ1 + wBB θ2 + 2wBB θ4 + 2wBB θ5 3wAB + 2wBB θ2 + 2wBB θ3 + 2wBB θ4 3wAB + 6wBB θ6 6 5n2 +1 15(n−3) 5n2 +1 30(n−4) 5n2 +1 30 5n2 +1 30 5n2 +1 5[(n−3)2 −3(n−3)+2] 5n2 +1
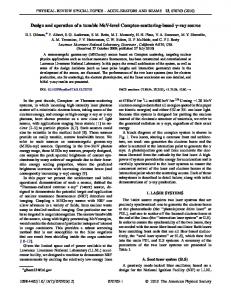
respectively. The condition wAB /kB T = 0.0 corresponds to the Langmuir case, the adsorption isotherm being a “sigmoid” as expected. As wAB /kB T takes negative values (attractive interactions), two plateaus are formed and three different adsorption processes can be visualized: (i) facet sites are filled first up to θ = 5(n2 − 3n + 2)/(5n2 + 1) ≈ 0.61; (ii) the filling of edge sites is completed up to θ = 5(n2 − 3n + 2)/(5n2 + 1) + 15(n − 1)/(5n2 + 1) ≈0.98; and (iii) the monolayer is formed and θ = 1.0. The analysis of Fig. 2 indicates that (1) the NP behaves as a heterogeneous surface with only three different
III. RESULTS
In order to rationalize our analysis, three different cases are considered, according to the interaction energies involved in the adsorption process: case I: wBB /kB T = 0.0 and wAB /kB T < 0.0, case II: wBB /kB T > 0.0 and wAB /kB T = −1.0, case III: wBB /kB T = −2.0 and wAB /kB T < 0.0. Figure 2 shows the adsorption isotherms for case I, n = 7 (NA = 923, M = 492) and five different values of wAB /kB T = 0.0, −1.0, −5.0, −10.0, and −20.0 for wBB /kB T = 0.0. Symbols, colored lines, and dashed lines represent GCMC simulations, DMFA4, and DMFA3 data,
FIG. 2. (Color online) Adsorption isotherms for case I as described in the text, for n = 7 and wAB /kB T = 0.0, −1.0, −5.0, −10.0, and −20.0. Symbols, continuous lines, and dashed lines represent GCMC simulations, DMFA4, and DMFA3 data, respectively.
062407-4
COMPUTER SIMULATION AND DETAILED MEAN-FIELD . . .
PHYSICAL REVIEW E 88, 062407 (2013)
(b)
(a)
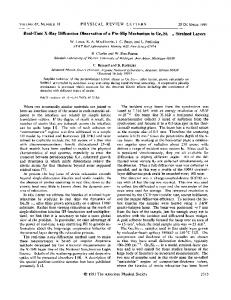
FIG. 3. (Color online) Adsorption isotherms for case II as described in the text, for n = 7 and wBB /kB T = 0.0, 1.50, 3.00, 4.50, and 5.25. Symbols, continuous lines, and dashed lines represent GCMC simulations, DMFA4, and DMFA3 data, respectively.
adsorption energies; (2) DMFA4 reduces to DMFA3; and (3) the theoretical results reproduce exactly the GCMC data. The thermodynamic behavior of this type of NP has been reported previously in [28]. Figure 3 shows the results corresponding to case II. The curves were obtained for n = 7 and different values of wBB /kB T = 0.0, 1.50, 3.00, 4.50, and 5.25 for wAB /kB T = −1.0. These energetic conditions remind us of those of adsorption of anions or some cases of molecular capping on metallic surfaces, where repulsive interactions predominate. Figure 2 shows the symbology used. As wBB /kB T increases, two well-defined plateaus appear in the simulation curves at coverage θ = 1/3 and θ = 2/3. The √ first√(second) √ plateau √ corresponds to the formation of the ( 3 × 3) [( 3 × 3)∗ ] structure on the flat surfaces (see insets in Fig. 3). With respect to the theory, there are a wide range of wBB /kB T ’s (wBB /kB T � 2), where the mean-field approximation provides an excellent fitting of the simulation data. This is important since most of the experiments in surface science are carried out in this range of interaction energy. For high values of wBB /kB T , DMFA3 and DMFA4 do not predict the existence of ordered phases; consequently the differences between analytical and GCMC results turn out to be significantly large. The explanation of this behavior is simple: The main hypothesis of the mean-field approximation says that the configurational degeneracy and average nearest-neighbor interaction energy are calculated considering that molecules are distributed completely at random on the lattice. This assumption prevents the formation of ordered structures on the surface. Finally, Fig. 4 shows the adsorption isotherms corresponding to case III. The different curves were obtained for n = 7 and different values of wAB /kB T = 0.0, −5.0, −10.0, and −15.0 for wBB /kB T = −2.0. This situation is typical of metal-metal interactions. Figures 2 and 3 describe the symbology used. As observed from the GCMC data, a
FIG. 4. (Color online) Adsorption isotherms for case III as described in the text, n = 7 and wAB /kB T = 0.0, −5.0, −10.0, and −15.0. Symbols, continuous lines, and dashed lines represent GCMC simulations, DMFA4, and DMFA3 data, respectively.
marked jump from θ = 0.0 to θ = 1.0 occurs in the adsorption isotherms as wAB /kB T becomes zero. The system undergoes a condensation, which is observed in the clear discontinuity in the adsorption isotherms. It is worth noticing that although the jump in the isotherm may be indicative of a first-order phase transition, it is well known that no phase transition develops in a finite system. As wAB /kB T is increased (in absolute value), the surface changes from a homogeneous to a heterogeneous substrate and, consequently, the adsorption isotherms show a more complex behavior. For wAB /kB T < −5 three plateaus are observed, two of which were reported in case I. However, two interesting new features are present: the formation of a plateau at θ = 0.85 and a condensation from an empty NP to the first plateau. The new plateau was reported in [28] where the vertex sites and their NN sites were found to remain empty. With respect to the theoretical data, the performance of mean-field approximation is good, especially for θ > 0.6, even for high values of wAB /kB T . DMFA3 predicts the existence of the first and third plateau only. On the other hand, DMFA4 reproduces the three plateaus. In both cases, a typical van der Waals loop is observed. In the case of wAB /kB T = 0.0, the loop goes from an empty to a full NP, while in the other cases, the loop takes place between zero density and the coverage corresponding to the first plateau. The jumps obtained using Maxwell’s rule have a bias of order 3/kB T . Once the energetics of adsorption has been studied, it is interesting to analyze the dependence of the adsorption isotherms on the size of the seed NP. As it is well known, the behavior of the thermodynamic variables is a function of the quantity of particles at facets, vertices, and edges. Figure 5 shows the adsorption isotherms of an extreme case (wBB /kB T = −2.0 and wAB /kB T = −15.0) and different NP sizes n = 7, 8, 9, 10, and 12 (as indicated in the figure). The GCMC data show how coverage degrees corresponding to the first and third plateaus change as NP size is varied; this
062407-5
O. A. PINTO et al.
PHYSICAL REVIEW E 88, 062407 (2013)
(a)
(b)
(c)
(a)
(b)
FIG. 5. (Color online) Adsorption isotherms for different sizes of the seed NP (n). The values of the interactions were set to reproduce the two plateaus (wAB /kB T = −15.0 and wBB /kB T = −2.0). Insets (a) and (b) show a zoom of the third and first plateau, respectively. Symbols, continuous lines, and dashed lines represent GCMC simulations, DMFA4, and DMFA6 data, respectively.
is a “nanoeffect”. In addition, an incipient second plateau is observed at high densities. Our interest is now to compare DMFA4 (continuous lines) and DMFA6 (dashed lines) as a function of NP size (see Fig. 5). Both theoretical approximations are in good agreement with the formation of the third plateau. The second plateau is predicted by DMFA4 and DMFA6 [see inset (a)], even though GCMC data show an incipient inflexion. Note that DMFA3 does not predict the second plateau (see Fig. 4, blue curve). The main differences between DMFA4 and DMFA6 appear in the first plateau. As expected, DMFA6 follows the GCMC data slightly better than DMFA4 [see inset (b)]. The jumps for the first plateaus predicted by DMFA6 are shown at the same values of μ/kB T for all n. This is because the frequencies f are functions of n, while partial isotherms are not. The behavior of adsorption isotherms for case II and different seed-NP sizes was also studied (data not shown here). The comparison between theory and simulation provided a level of accuracy similar to that found in Fig. 5. DMFA6 was found to be better than DMFA3, but performed in a similar way to DMFA4. The quantitative differences between simulation and theoretical results can be much easily rationalized with the help of the integral error, IE, defined as � 1 IE = |μtheor − μsim |(θ )dθ, (21)
FIG. 6. (Color online) Integral error (in kB T units) as defined in Eq. (21) for cases II [(a)] and III [(b)]. Results in inset (c) correspond to wAB /kB T = −15.0, wBB /kB T = −2.0, and different sizes of the seed NP (n).
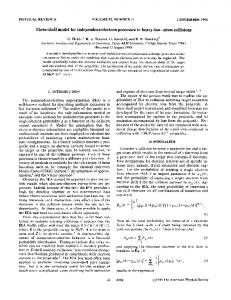
n = 7. Figure 6(c) shows the IE for different seed-NP sizes using wBB /kB T = −2.0 and wAB /kB T = −15.0. The errors in both approximations increase with seed-NP sizes. DMFA6 has proved to be a better approximation than DMFA3. Other NP geometries have also been considered. In Figs. 7(a) and 7(b) we present case I and case II for a truncated octahedron (TO), comparing GCMC simulations with the analytical approach for NA = 1289 and M = 636. In the minimal version the analytic description of TO requires five levels, thus we referred to it as DMFA5. Appendix displays the derivation of the corresponding equations. For case I, with wAB /kB T = −10.0, the results show three plateaus that correspond to the filling of (100) facet, (111) facet, and the edge sites, respectively.
(b)
(a)
0
where μtheor and μsim are the chemical potentials obtained by using the analytical approach and GCMC simulations, respectively. Each pair of values μtheor , μsim was obtained at fixed θ . We performed the analysis for the DMFA3 and DMFA6 cases. Where necessary, the loops were rectified by using Maxwell’s rule of equal areas. Figure 6 shows integral errors for different wBB , wAB , and n. Figures 6(a) and 6(b) correspond to cases II and III, respectively, for
FIG. 7. (Color online) Adsorption isotherms for a TO nanoparticle with n = 4. (a) Case I, wAB /kB T = 0.0, −1.0, −2.0, −5.0, and −10.0. (b) Case II, wBB /kB T = 1.0, 3.0, and 5.0. Symbols and continuous lines represent GCMC simulations and DMFA5 data, respectively.
062407-6
COMPUTER SIMULATION AND DETAILED MEAN-FIELD . . .
PHYSICAL REVIEW E 88, 062407 (2013)
For case II, two plateaus may be observed. Their behavior is similar to that obtained in the geometry previously described. The first plateau for wBB /kB T = 5.0 corresponds to a surface structure where the adparticles on the seed NP are surrounded by vacant sites. The coverage √ √degree is close to 1/3. The structure is of the type ( 3 × 3) on the (111) facets and of the type (2 × 1) on the (100) facets. These expanded structures result from repulsive interactions between adsorbates, leading to a minimization of the total free energy. The second plateau around θ = 2/3 corresponds to a situation where the structure on the (111) facet changes to √ √ a ( 3 × 3)* one, as illustrated in Fig. 3(b). The (100) facets acquire a (1 × 1) structure, i.e., a full coverage. This behavior can be taken into account: adsorption sites on (111) and (100) facets present 4 and 6 NN, respectively. Hence, the full decoration of (100) facets involves lower energetic costs. As in previous figures, (i) an excellent agreement is obtained between MC and DMFA5 data for case I and (ii) the differences between simulation and analytical results turn out to be significantly large for case II and high values of wBB /kB T .
case I), along with a condensation transition from an empty NP to the first plateau. The simulation results were compared with a detailed mean-field approximation involving a different number of energy levels. The agreement obtained is excellent in case I (the theoretical results reproduce exactly the simulation data). In case II, there is a wide range of the value of ad-ad interactions (wBB /kB T � 2), where the theory provides an excellent fitting of the simulation data. This is important since most of the experiments in surface science are carried out in this range of interaction energy. For strongly interacting adsorbates, the mean field does not predict the existence of ordered phases on the surface and, consequently, the differences between analytical and simulation results are found to be significantly large. With respect to case III, the performance of mean-field approximation is good, especially for θ > 0.6, even for high values of the adsorbate-substrate interaction. The theory reproduces the three plateaus observed in the isotherms and shows the typical van der Waals loop in the presence of a condensation transition. The jumps obtained using Maxwell’s rule have a bias of order 3/kB T . In summary, the proposed theoretical model (DMFA) is useful and seems to be a promising starting point for further investigations on nanoscale adsorption.
IV. CONCLUSIONS
In the present work, adsorbate formation on a nanoparticle made of a foreign material with different geometries was analyzed using comparatively Monte Carlo simulations and a mean-field analytic approach. A lattice-gas model was used with this purpose. Depending on the coordination with nearest neighbors, different types of adsorption sites were defined. In addition, repulsive and attractive interactions between adsorbates were considered, mimicking different experimental situations. In the case of attractive adsorbate-substrate interactions and null adsorbate-adsorbate interactions (we have called this feature case I), the simulation isotherms show a transition from a Langmuir-like behavior in the case of weak interactions to stepwise profiles in the case of strong ones. In this limit, isotherms show up to three plateaus corresponding to adsorption on facets, edges, and vertices. This finding gives an indication of the geometry of the nanoparticle. For attractive adsorbate-substrate interactions and repulsive adsorbate-adsorbate interactions (case II), the behavior of the system is more complex. At low values of the coupling parameter, adsorption isotherms show a Langmuir-type shape. As the ad-ad interaction increases, two well-defined plateaus appear in the isotherms. The plateaus are attributed to the occurrence of two different ordered structures on the surface; they do not obey adsorbate-substrate effects as discussed in case I. Thus, in case II, the number of steps in the isotherms does not yield straightforward information on nanoparticle geometry. When all interactions are attractive (case III), we have a lattice where a condensation transition occurs. For low values of the adsorbate-substrate interaction, the transition is observed as a marked jump between θ = 0 and θ = 1. On the other hand, as the magnitude of this interaction increases, the surface changes from a homogeneous to a heterogeneous substrate. Consequently, three plateaus appear in the adsorption isotherms (two of which were reported in
ACKNOWLEDGMENTS
We thank support from Universidad Nacional de San Luis (Argentina) under Project 322000; Universidad Nacional de Santiago del Estero (Argentina) under Project CICyT-UNSE 23 A173, Secyt, Universidad Nacional de C´ordoba (Argentina); CONICET (Argentina) under Projects PIP 112-201101-00615 and PIP 112-201101-00992; Agencia Nacional de Promoci´on Cient´ıfica y Tecnol´ogica (Argentina) under Projects PICT-2010-1466, PICT-2010-00983, PME2006-01581, and Program BID (PICT 2012-2324).
APPENDIX: DETAILED MEAN-FIELD APPROXIMATION FOR A TRUNCATED OCTAHEDRAL NANOPARTICLE
Here we describe the theoretical approximation for a truncated octahedron (TO). A TO is formed by facets with geometry (100) and (111). The (100) and (111) facets can be described through square and triangular lattices, respectively. A TO presents four-site types of adsorption sites, shown in Fig. 8(a). Blue and red spheres denote adsorption sites at (100) and (111) facets, respectively. Black and green spheres denote edge sites between (111)-(111) and (111)-(100) facets, respectively. Taking into account coordination with NNs, we can identify five different types of energy levels at the surface. Figure 8(b) shows the energies assigned to the different sites, within the DMFA5 approximation. Next we describe the assignation of energies to each type of site (we use the same notation as before): (Type 1) Adsorption sites at the vertices, each of which is connected with one site of the seed NP and with up to six
062407-7
O. A. PINTO et al.
PHYSICAL REVIEW E 88, 062407 (2013)
The number of adsorption sites on the TO is also a function of nas M = 30n2 + 36n + 12.
FIG. 8. (Color online) Schematic representation of a truncated octahedron. (a) Types of adsorption sites. Blue and red spheres denote adsorption sites at (100) and (111) facets, respectively. Black and green spheres denote edge sites between (111)-(111) and (111)-(100) facets, respectively. (b) Energy assignation to each type of site according to the DMFA5 approximation described in the text.
lateral NNs. The corresponding adsorbate-substrate energy is εv = wAB . (Type 2) Adsorption sites at (111)-(111) edges, each of which is connected with one site of the seed NP and may coordinate with up to six other adsorbate sites. The corresponding adsorbate-substrate energy is εe(111−111) = wAB . (Type 3) Adsorption sites at (111)-(100) edges, each of which is linked with two sites of the seed NP and may coordinate with up to five other adsorbate sites. The corresponding adsorbate-substrate energy is εe(111−100) = 2wAB . (Type 4) Adsorption sites at (100) facets, each of which is linked with four sites of the seed NP, and up to four lateral neighbors on the surface. The corresponding adsorbatesubstrate energy is εf 100 = 4wAB . (Type 5) Adsorption sites at (111) facets, each of which is linked with three sites of the seed NP, and up to six lateral neighbors on the surface. The corresponding adsorbatesubstrate energy is εf 111 = 3wAB . As in the previous case, we can define an index “n” to identify the size of the TO. The number of atoms of the core can be written as NA = 16n + 15n + 6n + 1. 3
2
The different number of sites of each type in the TO are as follows: (1) Vertices: Nv = 24. (2) Edges between (111)-(111) facets: Ne111−111 = 12n − 12. (3) Edges between (100)-(111) facets: Ne100−111 = 24n. (4) (111) facets: Nf 111 = 24n2 . (5) (100) facets: Nf 100 = 6n2 . The different energy levels are E1 = wAB + wBB θ2 + 2wBB θ3 + wBB θ4 + 2wBB θ5 , (A3) E2 = 2wAB + 2wBB θ2 + 4wBB θ5 ,
(A4)
E3 = 2wAB + 2wBB θ3 + wBB θ4 + 2wBB θ5 ,
(A5)
E4 = 4wAB + 4wBB θ4 ,
(A6)
E5 = 3wAB + 6wBB θ5 .
(A7)
and The corresponding frequencies of occurrence fγ ’s can be written as 4 , 5n2 + 6n + 2 2n − 2 , f2 = 2 5n + 6n + 2 4n f3 = 2 , 5n + 6n + 2 4n2 , f4 = 2 5n + 6n + 2
f1 =
(A8) (A9) (A10) (A11)
and f5 =
(A1)
[1] L. Gu, S. Cheley, and H. Bayley, Science 291, 636 (2001). [2] S. Coyle, M. C. Netti, J. J. Baumberg, M. A. Ghanem, P. R. Birkin, P. N. Bartlett, and D. M. Whittaker, Phys. Rev. Lett. 87, 176801 (2001). [3] X. F. Zhu and Z. G. Wang, Int. J. Nanotechnol. 3, 492 (2006). [4] R. Ferrando, J. Jellinek, and R. L. Johnston, Chem. Rev. 108, 845 (2008). [5] D. M. Eigler and E. K. Schweizer, Nature (London) 344, 524 (1990). [6] T. L. Hill, Thermodynamics of Small Systems, Parts I and II (Dover Publication, New York, 1994). [7] T. L. Hill, Nano Lett. 1, 273 (2001).
(A2)
n2 . 5n2 + 6n + 2
(A12)
[8] Q. S. Mei and K. Lu, Prog. Mater. Sci. 52, 1175 (2007). [9] W. J. Plieth, J. Phys. Chem. 86, 3166 (1982). [10] D. Astruc, Nanoparticles and Catalysis (Wiley-VCH Verlag, Weinheim, 2008). [11] E. Roduner, Chem. Soc. Rev. 35, 583 (2006). [12] O. A. Oviedo and E. P. M. Leiva, in Metal Clusters and Nanoalloys: From Modeling to Applications, edited by M. M. Mariscal, O. A. Oviedo, and E. P. M. Leiva (Springer, New York, 2012), Chap. 10, pp. 305–350. [13] B. Corain, G. Schmid, and N. Toshima, Metal Nanocluster in Catalysis and Materials Science (Elsevier, Amsterdam, 2008).
062407-8
COMPUTER SIMULATION AND DETAILED MEAN-FIELD . . .
PHYSICAL REVIEW E 88, 062407 (2013)
[14] J. Solla-Gullon, F. J. Vidal-Iglesias, and J. M. Feliu, Annu. Rep. Prog. Chem., Sect. C 107, 263 (2011). [15] M. T. M. Koper, Nanoscale 3, 2054 (2011). [16] G. Staikov and W. J. Lorenz, in Electrochemical Nanotecnology, edited by W. Plieth and W. J. Lorenz (Wiley-VCH, Weinheim, 1998). [17] P. C. Chen, S. C. Mwakwari, and A. K. Oyelere, Nanotechnol. Sci. Appl. 1, 45 (2008). [18] O. A. Oviedo, E. P. M. Leiva, and M. M. Mariscal, Phys. Chem. Chem. Phys. 10, 3561 (2008). [19] O. A. Oviedo, M. M. Mariscal, and E. P. M. Leiva, Electrochim. Acta 55, 8244 (2010). [20] O. A. Oviedo, L. Reinaudi, and E. P. M. Leiva, Electrochem. Comm. 21, 14 (2012). [21] M. M. Mariscal, O. A. Oviedo, and E. P. M. Leiva, J. Mater. Res. 27, 1777 (2012). [22] O. A. Oviedo, L. Reinaudi, M. M. Mariscal, and E. P. M. Leiva, Electrochimi. Acta 76, 424 (2012). [23] O. A. Oviedo, C. F. A. Negre, M. M. Mariscal, C. G. S´anchez, and E. P. M. Leiva, Electrochem. Comm. 16, 1 (2012).
[24] E. V. Kovalyov and V. I. Elokhin, Chem. Eng. J. 154, 88 (2009). [25] E. V. Kovalyov, V. I. Elokhin, A. V. Myshlyavtsev, and B. S. Balzhinimaev, Dokl. Phys. Chem. 381, 309 (2001). [26] E. V. Kovalyov, V. I. Elokhin, and A. V. Myshlyavtsev, J. Comput. Chem. 29, 79 (2007). [27] E. V. Kovalyov, E. D. Resnyanskii, V. I. Elokhin, B. S. Balzhinimaeva, and A. V. Myshlyavtse, Phys. Chem. Chem. Phys. 5, 784 (2003). [28] O. A. Pinto, B. A. L´opez de Mishima, E. P. M. Leiva, and O. A. Oviedo, Phys. Rev. E 86, 061602 (2012). [29] M. Jaroniec and P. Bruer, Surf. Sci. Rep. 6, 65 (1986). [30] F. Bulnes, A. J. Ramirez-Pastor, and G. Zgrablich, J. Chem. Phys. 115, 1513 (2001). [31] P. M. Centres, F. Bulnes, G. Zgrablich, and A. J. Ramirez-Pastor, Adsorption 17, 403 (2011). [32] N. Metropolis, A. W. Rosenbluth, M. N. Rosenbluth, A. H. Teller, and E. Teller, J. Chem. Phys. 21, 1087 (1953). [33] J. L. Soto, Ph.D. thesis, University of Pennsylvania, 1979. [34] D. J. Wales, Energy Landscapes: Applications to Clusters, Biomolecules and Glasses (Cambridge Molecular Science) (Cambridge University Press, Cambridge, 2003).
062407-9