the button is released, the widget's other descendents will be fired. 3.6. Functional versus imperative styles. In a purely functional programming language such ...
COMPUTER SYSTEMS LABORATORY STANFORD UNIVERSITY STANFORD. CA 943054055
*
SPREADSHEETS FOR IMAGES
’
Marc Levoy
Technical Report:
CSL-TR-94-607
February 1994
This research was supported by the *National Science Foundation under contract CCR-9157767 and by Software I’uhlishing Corporation. ’
SPREADSHEETS FOR IMAGES Marc Levoy Technical Report: CSL-TR-94-607 Computer Systems Laboratory Department of Computer Science Stanford University Stanford, CA 94305-4070 Abstract We describe a data visualization system based on spreadsheets. Cells in our spreadsheet contain graphical objects such as images, volumes, or movies. Cells may also contain graphical widgets such as buttons, sliders, or movie viewers. Objects are displayed in miniature inside each cell. Formulas for cells are written in a programming language that includes operators for array manipulation, image processing, and rendering. Formulas may also contain control structures, procedure calls, and assignment operators with side effects. Compared to flow chart visualization systems, spreadsheets are more expressive, more scalable, and easier to program. Compared to numerical spreadsheets, spreadsheets for images pose several unique design problems: larger formulas, longer computation times, and more complicated intercell dependencies. We describe an implementation ~ based on the Tel programming language and the Tk widget set, and we discuss our solutions to these design problems. We also point out some unexpected uses for our spreadsheets: as a visual database browser, as a graphical user interface builder, as a smart clipboard for the desktop, and as a presentation tool.
Ktiywords:
Data visualization, User interfaces, Flow charts, Visual programming languages, Spreadsheets
Spreadsheets for Images Marc Levoy Computer Science Department Stanford University January, 1993
Abstract We describe a data visualization system based on spreadsheets. Cells in our spreadsheet contain graphical objects such as images, volumes, or movies. Cells may also contain graphical widgets such as buttons, sliders, or movie viewers. Objects are displayed in miniature inside each cell. Formulas for cells are written in a programming language that includes operators for array manipulation, image processing, and rendering. Formulas may also contain control structures, procedure calls, and assignment operators with side effects. Compared to flow chart visualization systems, spreadsheets are more expressive, more scalable, and easier to program. Compared to numerical spreadsheets, spreadsheets for images pose several unique design problems: larger formulas, longer computation times, and more complicated intercell dependencies. We describe an implementation based on the Tel programming language and the Tk widget set, and we discuss our solutions to these design problems. We also point out some unexpected uses for our spreadsheets: as a visual database browser, as a graphical user interface builder, as a smart clipboard for the desktop, and as a presentation tool. CR Categories: 1.4.0 [Image Processing]: General - Image pro&sing sofhuare; 1.3.6 [Computer Graphics]: Methodology and Techniques - Interaction techniques, Languages; D.3.2 [Programming Languages]: Language Classifications - Data-jlow languages Additional keywords: Data visualization, User interfaces, Flow charts,.Visual programming languages, Spreadsheets
1. Introduction The majority of commercially available image processing and data visualization systems employ a flow chart paradigm. Users select processing modules from a menu and wire them together using a mouse. Although elegant in principle, flow charts are limited in expressiveness and scalability. Useful programming constructs like procedure calls and run-time variable substitution cannot be conveniently expressed in a flow chart. Flow charts spend their screen real estate on operators and their interconnections, which becomes uninteresting once the flow chart has been specified, and they run out of screen space if the program size exceeds a few dozen operators. Flow charts also provide no convenient mechanism for managing multiple datasets. As a result,
these systems often prove too cumbersome to support the extemporaneous style of data analysis for which they were originally intended. We propose an alternative paradigm based on spreadsheets. Broadly speaking, a spreadsheet is a two-dimensional cellular automaton. Cells may contain a data value or a formula. Formulas compute a value for one cell as a function of the values in other cells. These formulas are typically written in an simple, interpreted language. Examples of spreadsheet systems are Microsoft’s Excel, Lotus’s l-2-3, and Borland’s Quattro. We have implemented a spreadsheet for images (henceforth denoted SI) in which we extend the notion of a data value to include graphical objects such as images. These objects are displayed in miniature inside each cell. Double clicking on a cell brings up the full-size object. Cells may also contain interactive widgets. Manipulating a widget modifies the data associated with the cell. If formulas in other cells reference the modified cell, they are recomputed as well. Widgets are a powerful addition to the semantics of a spreadsheet. In a sense, they turn the spreadsheet into a graphical user interface builder. Formulas in our spreadsheet are written in Tel, a generalpurpose programming language that provides variables, procedures, assignment statements with side effects, and a full complement of control structures. Using such a language, the formula for a cell can range from a one-line expression to an entire program. To support editing of such formulas, SI is intimately tied to Emacs, a popular, customizable text editor. Double clicking on a cell brings up an Emacs window devoted to that cell. Double clicking on other cells brings up additional Emacs windows, allowing the user to write formulas for several cells at once. The presence of an embedded formula language gives SI expressiveness. The infinite grid of the spreadsheet, together with the ability to resize cells, gives SI scalability, SI also spends its screen space on operands rather than operators, which is usually more interesting to the user. Finally, because spreadsheets are two-dimensional, they provide a natural mechanism for applying multiple operators to multiple datasets. The remainder of the paper is organized as follows. Section 2 presents our reasons for using Tel as the formula language, and it describes how Tel and SI fit together. Section 3 describes the logical structure and command set of SI. The remaining sections describe SI’s implementation, our experiences with SI, comparisons with other systems, and the future of SI.
Kegister manipulation Spreadsheet services Cell manipulation
load, store, display, undisplay, openwindow*, closewindow*,
Register creation
popwindow,
Display widgets
pushwindow
storesheet, winsize*, titleheight, view-pixel* loadsheet,
Register manipulation
promote, slice, delete
cellsize*, view-cell, cut l , copy*, paste*, delete*, enable*, disable*
“Pixel operations
Figure 1: Commands of the SI kernel. Starred commands are also available using a point and click interface.
add, subtract, multiply, divide, mod, over, and, or, makeramp, ramp, shift
Spatial operations
rotate, convolve, scale, displace, warp, makedisplacement
3D occupancy grids
readabekas, deinterlace, profile, opinion, occupancy
Figure 2: Commands of a prototype image processing package. including the commands for processing 3D occupancy grids that were used to generate figure 5.
2. Tel as a formula language From a conceptual point of view, the choice of a formula language is unimportant. We envision SI as a kit of parts in which the language is a replaceable module. For our prototype, we sought a language that was powerful, easy to type, and interpreted rather than compiled (for interactivity). Our choice was Tel (Toolkit Command Language) [Ousterhout90]. Tel consists of an application-independent embeddable command interpreter, a set of built-in commands for manipulating variables, strings, lists, and files, and a set of C-callable interface routines for adding additional commands. Here is the Tel code to compute the factorial of 5: set result 1 set i 5 while ($i > 0) { set result [expr incr i -1
scalar, vector, scanline, image, volume button, slider, label, plot, imageviewer, cineviewer COPY, extract, insert,
3. The structure and commands of SI SI consists of a kernel program and one or more standalone application packages. This modular design reflects one of Ousterhout’s goals for Tel; it leads to systems composed of compact, reusable parts. In this section, we take a tour through the logical structure and command set of the SI kernel. Our examples include commands from a simple image processing application package. The command set of the SI kernel is listed in figure 1. The command set of our image processing package is listed in figure 2.
3.1. Registers
Sresult * Si]
The basic unit of storage in SI is called a register. A register is a named allocation of memory. Registers may contain anything: images, geometry, formulas, etc. SI controls the allocation and deallocation of registers and keeps track of which formula produces and consumes each register, but SI knows nothing about the contents of a register. The contents and interpretation of registers is determined by those commands that know how to manipulate them and those widgets that know how to display them.
From the user’s point of view, Tel’s advantages are that it is easy to type (like UNIX shell commands) and that it provides a variety of control structures and run-time substitution mechanisms (like the UNIX shell but better). From the implementors’ point of view, Tel’s advantages are its small code size, its fast execution (fast enough to use for mouse event loops), and its simple interface to-C - procedure calls with string arguments.
Commands generally consist of a command name followed by options and one or more arguments. The argument list for most commands includes the name of one or more registers. For example,
Tel has one further advantage: it is the basis for Tk [Ousterhout91], an Xl1 toolkit similar to Xt. Tk provides a base set of graphics and text-oriented widgets, a mechanism for defining new widgets, and a simplified interface between user applications -and the X window system. For SGI users, Tk replaces the window management and event handling services that are present in GL but are missing in OpenGL. As the Tcl/Tk user communities expand, we expect to see Tk widget sets for 3D graphics and image processing.
r o t a t e -Bspline myreg Y 45 newreg rotates a volume register named myreg around its Y-axis by 45 degrees. The command uses a cubic Bspline as its resampling filter, and it places its result into a register named new reg. To minimize the number of type coercions a user must perform, most commands accept a variety of register types, performing conversions, applying defaults, or ignoring arguments as appropriate. One very important default is that if the name of the output register (newreg above) is omitted, SI will make up a name. To make this form useful, commands that produce a register as output return a string result giving the name of the output register. The register produced by such a command can be used as the input to another command using Tel’s command substitution mechanism:
Tel appears in two places in SI. First, it is the language in which formulas are written. Second, the SI program provides a Tel command prompt. Users may invoke all of the functionality of SI, including functions normally driven by the mouse, by entering commands at this prompt. This capability allows users to record and play back interactive sessions, to customize SI from an initialization script, and to perform many other useful tasks.
rotate -Bspline [ l o a d head.mri] Y 4 5 n e w r e g
2
al: load
In this formula, the load command executes first, generating an arbitrary name for its output register, e.g. Reg123. The rot ate executes next, with arguments Reg123 Y 45 newreg. The registerproducedbythe loadeomrnandisnever seen by the user and is unimportant. It is deleted automatically by SI when the formula is modified or when the cell is deleted.
head.mri
Executing this formula would cause the specified file to be loaded into a volume register, and a miniature version of the tine viewer to be displayed in the cell. If the formula contains several more than one command (separated by newlines or semicolons in accordance with Tel syntax), only the register returned by the last command executed will be displayed in the cell.
3.2. Display widgets The contents of registers are by themselves undisplayable. The second building block in SI is a display widget. It is a view of a register. Some types of registers may have more than one widget that knows how to display them; others may have none. Such a register would need to be converted to a displayable type in order to view it.
3.4. Chaining formulas together Cell names may be used in any context in which a register name is valid. This allows us to reference the data in a cell by either its register name or its cell name. Here is a simple threecell spreadsheet: a l : l o a d alps.rgb bl: rotate al 45 cl: ramp bl [makeramp {{O 255) (255 0}}]
Display widgets are associated with registers using a widget command. For example, cineviewer -rocking
[load head.mri]
loads a volume into a register, then opens a window on the workstation screen that contains an instance of the tine viewer widget. This widget contains image subwindows and interactive controls for viewing slices of a volume as a flipbook animation. The -rocking option specifies that the animation should alternate between forwards and backwards animation rather than circling from the last frame back to the first frame. Other display widgets include buttons for Boolean registers, labels and sliders for scalar registers, plots for vector registers, and image viewers for image registers.
The f&t command loads an image into cell al. A miniature version of the image is displayed in the cell. The second command rotates the image by 45 degrees and displays the result in cell bl. The third command inverts the pixel values in the rotated image, displaying its result in cell cl. The makeramp command accepts a Tel list of coordinate pairs and returns a Tel list of coordinates piecewise linearly interpolated from the specified coordinates. In this example, the command would return the Tel list ({O 255) {l 254) 12 253}...)}. Thislistbecomesan input argument to the ramp command, which modifies the image from cell bl .
3.3. Cells
3.5. Active widgets
The third building block in SI is a cell. In addition to their usual appearance, all display widgets in SI know how to draw themselves in miniature inside a spreadsheet cell. Miniature versions of widgets may be live, meaning that they respond to mouse events just like the full-size widget, or they may be dead, meaning that they are for viewing only. If the miniature version of a widget is dead, double clicking on it brings up the full-size widget. For example, the miniature version of a slider widget is live, although its positional resolution is necessarily reduced. The miniature version of a tine viewer is not live because that would require decimating the entire image sequence before it could be animated. However, any time the tine viewer is not animating, its current frame is decimated and displayed in the associated cell.
In addition to being live or dead, widgets may be passive, meaning that they only display their underlying registers, or active, meaning that they both display and modify their underlying registers. For example: al: load alps.rgb bl: slider b2: rotate al [bl] The command slider in cell bl is a widget command, Since it is invoked without arguments (compare to the cineviewer command in example (1)). a default scalar integer register is created, and the slider displays the contents of that register. The operand [ bl ] in cell b2 invokes a command named bl. Every occupied cell in the spreadsheet has associated with it a Tel command that returns the contents of the register displayed in that cell. Thus, the command bl returns the value displayed on the slider, and the rotate command rotates the image in cell al by this amount. Since the formula in cell b2 depends on cell bl, moving the slider causes the rotation to be recomputed.
Display widgets are associated with cells by adding a cell name argument to the widget command. To display a miniature version of the tine viewer widget in cell al, we type cineviewer -rocking [load head.mri] al (1) So far, we have assumed that all formulas are entered at the SI program prompt. If a formula is instead typed into an Emacs window that is associated with a particular cell, the cell name argument may be omitted:
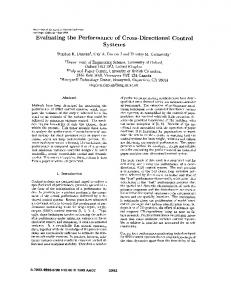
The spreadsheet for this example is shown in figure 3. The slider widget is really Tk’s “scale” widget. The options visible on the slider command in the figure are options defined by Tk for its scale command. In addition to these Tk-defined options, most active widgets accept a -continuous option, meaning that they will fire their descendents repeatedly (as fast as possible) until the mouse button is released. If the slider in the previous example were so defined, dragging the slider bar back and forth would cause the image to rotate back and forth. To reduce computational delays if cell b2 were the beginning of a long chain of operations, active widgets also accept a -nofiredescendents option. If specified, the widget will fire only its
al: cineviewer -rocking [load head.mri] We use the notation “al:” (typeset in Times Roman) in this paper to signify that the formula that follows (typeset in Courier) is contained in the cell al. The “al:” does not appear in the cell. Every type ofregister has adefaultdisplay widget. For volumes, it is the tine viewer. Therefore, the formula in cell al -could be further simplified to read
3
I I
- --Figure 3: Slider widget lxing used to control a rotation. Cell b2 rotates the image in cell al by the AI@ specified on the slider in cell bl. Each time the s&&r is moved, cell b2 (and its desccndents, if it had any) arc rccomputai__
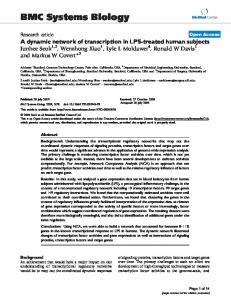
Figure 4: A slider that chooses among three input files. To insure a correct firing order, cell al declares that it produces cells al, a2, and a3. Cell c2 declares that it might consume cells al, a2, or a3. With the slider set as shown, c2 consumes al, hence its arrow is darker.
immediate children as long as the mouse button is down. When the button is released, the widget’s other descendents will be fired.
cells cl, c2, and c3. Although both formulations are reasonable in this example, the imperative formulation would prove superior if the loop contained 100 iterations rather than 3, or if several nested loops were present.
3.6. Functional versus imperative styles
In the context of spreadsheet systems, an important advantage of the functional approach is simplicity; one data value per cell, one update rule per cell, and no hidden memory. An important advantage of the imperative approach is ease of editing since the commands making up a program are not scattered in different cells. In the extreme case, the entire program is contained in one cell, and the rest of the spreadsheet serves as an addressable clipboard. Rearranging the visual appearance of an imperative computation involves merely changing a variable in a program, rather than cutting and pasting blocks of cells. Another advantage of the imperative approach is that it allows commands that read, modify, and write their operands. A commonly encountered example of such a command is insert, which might be used for inserting slices into a volume. A functional program must make a new copy of the volume, which is inefficient.
In a purely functional programming language such as ML, a function communicates only through its calling arguments and rctum value. In an imperative programming language such as C, a function may assign a value to a variable that outlives the function invocation. In other words, functions in an imperative language may have side effects. Conventional numerical spreadsheets enforce a functional programming style. The formula associated with a cell computes a value for that cell as a function of the other cells in the spreadsheet, and a formula cannot assign values to cells other than itself. While a functional style is preferred for many tasks, certain , programs can be expressed more naturally using an imperative style. The option in SI of specifying a register or cell name as the output of a command means that SI supports both functional and imperative styles. As an example of when an imperative style is more natural than a functional style, consider the following fragment that splits a color image into its red, green, and blue components: al: bl: b2: b3:
3.7. Substitutions on operands There are numerous ways to specify operands in SI. As in numerical spreadsheet systems, references to cells can be relative or absolute. al is a relative cell name. If cells al and bl are moved to cells f3 and g3 using cut and paste, a reference by bl to al will be changed to reference f3. If the formula is being edited in an Emacs window at the time it is relocated, SI sends the updated text to Emacs. In contrast, the notation /al, a/l, or /a/l forces the column, row, or both coordinates to be absolute, respectively. Absolute references are not modified if the cells are relocated.
load alps. rgb
e x t r a c t -camp 1 a l e x t r a c t -camp 2 a l e x t r a c t -camp 3 a l
Here is an imperative formulation of the same program: c l : l o a d alps.rgb t e m p foreach i {l 2 3 ) { e x t r a c t -camp Si t e m p c$i}
(2)
If an operand includes a Tel variable substitution, it is not known until run time whether the reference is to a cell, and whether it is absolute or relative. If the operand is moved using cut and paste, it cannot be changed to reflect its new location. To
In the second formulation, the load command places its output into a temporary register that is referenced later in the code but never displayed. The extract command places its outputs into 4
+
c
3.9. Control structures
support relocatable cell names in the presence of run-time substitutions, we define a command cellexpr that computes arithmetic expressions on cell locations. As an example, the reference c$i in example (2) is not relocatable as written. To make it relocatable, we rewrite it as
SI supports all of the control structures in Tel, including if, while, for, foreach, and case. Ofparticularinterest are the looping commands. Loops in SI take one of three general forms:
{extract -camp Si temp [cellexpr cl + aSi])
Single-cell loops. A loop can be coded entirely within one cell using an imperative programming style:
The addition of two cell names using cellexpr cause their row and column addresses to be added. Rows and columns count downwards and rightwards, with al being the additive identity. If the formula above were moved from cell cl to cell fl, a rightward shift of 3 columns, the cl will be recognized as a relative cell name and will be changed to f 1. The resulting formula will place the three color component images into cells fl, f2, and f3. These substitution mechanisms can be combined with Tel procedures to define powerful spreadsheet macros.
a l : l o a d alps.reg t e m p for {set i 0) (Si