Computing Initial points using Density Based Multiscale Data Condensation for Clustering Categorical data Shehroz S. Khan*
Amir Ahmad
Scientific Analysis Group,
Solid State Physics Laboratory,
DRDO, Delhi-110054
DRDO, Delhi-110054
Abstract The K-Modes clustering algorithm [1] has shown great promise for clustering large data sets with categorical attributes. K-Mode clustering algorithm suffers from the drawback of choosing random selection of initial points (modes) of the cluster. Different initial points leads to different cluster formations. In this paper Density-based Multiscale Data Condensation [2] approach with hamming distance [1] is used to extract K-initial points. Experiments show that K-modes clustering algorithm using these initial points produce improved and consistent results then the random selection method.
Keywords: K-Modes, Data mining, Clustering, Data condensation, Categorical data
1. Introduction Clustering aims at grouping data into homogeneous cluster / groups having similar characteristics. Data mining applications require partitioning of large data sets into homogenous clusters. The K-means based [3] method is used for processing large data sets for its simplicity and efficiency. Data in data mining often contains numerical and categorical or both attributes. K-means clustering algorithm fails to handle data sets with categorical attributes because it minimizes the cost function by calculating means. The traditional way to treat categorical attributes as numeric does not always produce meaningful results because generally categorical domains are not ordered. Several approaches have been reported for clustering categorical data sets that are based on K-means paradigm. Ralambondrainy [4] presented an approach by using K-means algorithm to cluster categorical data. The approach is to convert multiple category attributes into binary attributes (using 0 and 1 to represent either a category absent or present) and treat the binary attributes as numeric in the K-means algorithm. Gower and Diday [5] used a similarity coefficient and other dissimilarity measures to process data with categorical attributes. CLARA (Clustering LARge Application) reported by Kauffman & Rousseeuw [6] is a combination of a sampling procedure and the clustering program Partitioning Around Medoids (PAM). The K-modes algorithm extends K-means paradigm to cluster categorical data. K-modes clustering algorithm requires random selection of initial points. Clustering results are dependent on the selection of initial points. Choosing different initial points leads to different cluster structures and hence the clustering results cannot be repetitively generated. Furthermore, inappropriate choice of initial points leads to undesirable clustering results.
*
Corresponding author, email:
[email protected]
Ying Sun et al [7] proposes an iterative method based on initial points refinements algorithm for categorical data clustering. Pabitra et al [2] has proposed a Density-based Multiscale Data Condensation algorithm for numeric data sets. Using this methodology they extract K-prototype points from the entire data sets that will be used as in
Pabitra et al [2] proposed a non-parametric data reduction scheme to represent the density underlying the data. The algorithm select representative points in a multiscale fashion, sorting the points based on density criterion, selecting a point according the sorted list and pruning all points lying within a disc about a selected point with radius inversely proportional to the density at that point.
Algorithm DBMSDC(BN, k) Input: B N = {x1 , x 2 , K , x N } be the original data set, and k a positive integer representing the value of nearest neighbor. Output: Reduced set E begin For each point x i ∈ B N , calculate the distance of the kth nearest neighbor of x i in B N . Denote it by
1.
rk , x j . 2. Select the point x i ∈ B N , having the lowest value of rk , x j and place it in the reduced set E. Ties in lowest value of rk , x j may be resolved by a convention, say, according to the index of the samples. 3. Remove all points from B N that lie within a disc of radius 2 rk , x j centered at x j and the set consisting of the remaining points be renamed as B N . Regions of higher probability density are covered by smaller discs, and sparser regions are covered by larger discs. 4. Repeat step 2 on B N until B N becomes empty set. end The value of k should be increased as the data size increases to achieve a constant condensation ratio. Hence admissible value of k should be used to get desired K (number of clusters) representative condensed set.
4. Proposed Approach Pabitra et al [2] have used Density-based Multiscale Data Condensation methodology to extract Kprototype points from the entire numeric dataset. They used the Euclidean distance measure to compute the distance between two data objects. Since they are using Euclidean distance measure this method cannot be used for categorical data set. We made modifications in DBMSDC algorithm for categorical data. Instead of using Euclidean distance we have used hamming distance to find out the distance (matching) between two data objects. The outline of the proposed approach is as under: -
Algorithm Kprototype_categorical(BN, k) Input: B N = {x1 , x 2 , K , x N } be the data set having N data objects, and k is the number of nearest neighbor Output: K-prototypes
begin Construct a N × N similarity matrix for data objects using hamming distance k=2;
1. 2.
While (number of data objects in reduced set E != K) { (i) E=φ; (ii) E = DBMSDC(BN, k); (iii) Count data objects in reduced set E; (iv) k = k+1; } end
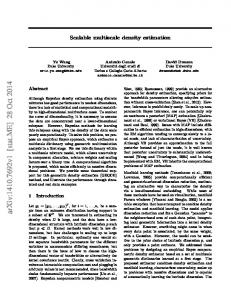
5. Experimental Results In section 4, we proposed a method to extract K-prototype points for categorical data sets. In order to verify the proposed approach, we applied K-modes clustering algorithm along with K-prototype points extracted using proposed approach as K-initial points. We also compared these points with desired modes to corroborate the effectiveness of the proposed approach. We carried out this exercise on different pure categorical data sets. These data sets are taken from UCI repository [9]. (i) Small Soybean database: The problem is to reconstruct a classification of selected soybean diseases. There are 47 cases of soybean diseases each characterized by 35 categorical attributes. These cases are drawn from 4 populations, each one of them representing one of the following soybean diseases: D1 (Diaporthe stem canker), D2 (Charcoat rot), D3 (Rhizoctonia root rot) and D4 (Phytophthorat rot). Clustering should partition these given cases into four groups corresponding to the diseases. Table 5.1 lists the extracted 4 prototype points 2 0 6 6
1 1 0 0
2 2 0 2
1 0 2 1
1 0 0 0
3 2 1 1
1 1 3 1
2 1 1 1
1 1 1 0
2 1 0 0
1 1 1 1
1 0 1 1
0 0 0 0
2 2 2 2
2 2 2 2
0 0 0 0
0 0 0 0
0 0 0 0
1 1 1 1
0 0 0 1
2 1 0 3
2 1 3 1
0 0 0 1
1 1 0 1
0 0 0 0
0 0 2 0
0 0 1 0
3 3 0 0
4 4 4 4
0 0 0 0
0 0 0 0
Table 5.1. K-prototypes extracted for small soybean data We ran K-modes clustering algorithm using the extracted 4 prototypes as in Table 5.1. We compare the results with K-modes clustering algorithm using random initialization [1]. The results are evaluated using clustering by an accuracy rate defined as e =
K
∑b i =1
i
, where bi is the number of instances
occurring in cluster I and not in its corresponding class. Low value of e suggests better clustering. Table 5.2 shows that with our proposed method to extract K-prototypes as initial points, using K-modes clustering algorithm we get value of e=0. Huang [1] showed that if we randomly choose initial centers, we have 45% chance to obtain good clustering results where good clustering means e≤5 and 13% of the times e was equal to zero.
0 0 0 0
0 0 0 0
0 0 0 0
1 0 0 0
Clusters Class (1)
(2)
(3)
(4)
D1
10
0
0
0
D2
0
10
0
0
D3
0
0
10
0
D4
0
0
0
17
Table 5.2: Clustering results for small soybean with K-prototypes as initial centers
6
0
2
1
0
1
0
1
1
2
1
1
0
2
2
0
0
0
1
0
3
1
1
1
0
0
0
0
4
0
0
0
0
0
0
6
0
0
2
1
3
3
1
0
0
1
1
0
2
2
0
0
0
1
0
0
3
0
0
0
2
1
0
4
0
0
0
0
0
0
0
1
2
0
0
0
1
2
0
2
1
0
0
2
2
0
0
0
1
0
1
1
0
1
0
0
0
3
4
0
0
0
0
0
0
0
1
2
1
0
3
1
2
1
0
1
1
0
2
2
0
0
0
1
0
2
2
0
0
0
0
0
3
4
0
0
0
0
0
1
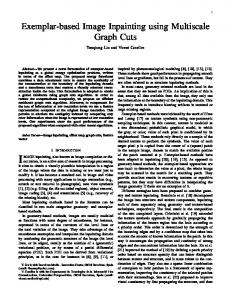
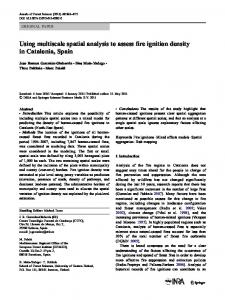
Table 5.3: Actual Modes for small soybean In this data set 14 attributes have same values for all the classes. Every class can be represented by modes of 21 attributes. Table 5.3 shows the actual modes for the four classes (21 × 4 = 84 entries). Comparison of table 5.1 and 5.3 illustrates that most of the entries are same (72 out of 84). This suggests the closeness of initial points computed using our proposed method to the expected modes. (ii) Congressional Vote Data: This data set includes votes for each of the U.S. House of Representatives Congressmen on the 16 key votes identified by the CQA that contains three types of simplified votes (yes, no and unknown disposition). It has 168 instances belonging to Republican and 267 to Democrats. Table 5.3 shows the K-prototypes points extracted using the proposed method.
1 1
2 2
2 1
1 2
1 2
1 2
2 1
2 2
2 1
2 1
2 1
1 1
1 1
1 2
Table 5.4: K-prototypes extracted for vote data
Clusters
Class (1)
(2)
Republican
153
15
Democrat
44
223
Table 5.5: Clustering results for vote data with K-prototypes as initial centers
2 1
2 2
We ran K-modes clustering algorithm with random initial centers 50 times and it has been found that the average value of e≈61, whereas using the centers from our proposed method e=59. The clustering results with K-prototype points computed using our proposed method as initial points are shown in Table 5.5, which shows the improvement in results and clustering accuracy and consistency.
2 1
2 2
2 1
1 2
1 2
1 2
2 1
2 1
2 1
1 2
2 1
1 2
1 2
1 2
2 1
2 2
Table 5.6: Actual modes for vote data Table 5.6 shows the actual modes for the Republican and Democrat classes. Table 5.4 and 5.6 suggests that initial K-prototypes extracted by our proposed method are very similar to the expected modes (12 pairs out of 16 pairs matches fully). We observed a fast convergence using K-modes because of better initial points
6. Conclusion In this paper we proposed a new concept of computing K-prototype points for categorical data using Density based Multiscale Data Condensation that will be used as initial points for K-modes clustering algorithm. The procedure is motivated by the justification to obtain a generic representative condensed set independent of the task performed with it later. Experimental results shows that the K-prototype points thus obtained are quite close to the desired modes. By initializing we obtain consistent and accurate clustering results.
Acknowledgement The authors would like to thanks the UCI Machine Learning data repository website to obtain the data sets for experimentation.
References [1] Huang, Z., A Fast Clustering Algorithm to Cluster Very Large Categorical Data Sets in Data Mining, In Proc. SIGMOID, Workshop on Research Issues on Data mining and Knowledge Discovery, 1997 [2] Mitra, P., Murthy, C.A., Pal, S.K., Density-Based Multiscale Data Condensation, IEEE Trans. on PAMI, vol.24, no.6, pp 734-747, 2002 [3] Anderberg, M.R., Cluster Analysis for Application, Academic Press, 1973 [4] Ralambondrainy, H., A conceptual version of the K-Means algorithm, Pattern Recognition Letters, 16, pp 1147-1157, 1995 [5] Gower, J., Diday, E., 1991, Symbolic clustering using a new dissimilarity measure, Pattern Recognition Letters¸24(6), pp 567-578, 1991 [6] Kaufman, L. Rousseeuw, P., Finding Groups in Data: An introduction to cluster analysis, Wiley, New York, 1990 [7] Sun, Y., Zhu, Q., Chen, Z., An Iterative initial points refinement algorithm for categorical data clustering, Pattern Recognition Letters, 23, pp-875-884, 2002
[8] Provost, F., Kolluri, V., A survey of Methods for Scaling Up Inductive Algorithms, Data Mining and Knowledge Discovery, vol. 2, pp 131-169, 1999 [9] UCI data repository http://www.sgi.com/tech/mlc/db/