application to look at the problems that come up in a network environment. We use BEE, a monitoring system that allows programmers to interactively monitor ...
Computing over Networks: An Illustrated Example Bernd Bruegge, Hiroshi Nishikawa, Peter Steenkiste School of Computer Science Carnegie Mellon University Pittsburgh, Pennsylvania 15213 Abstract With the advances in high-speed networking, partitioning applications over a group of computer systems is becoming an attractive way of exploiting parallelism. Programming general multicomputers is however very challenging: nodes are typically heterogeneous and shared with other users, making the availability of computing cycles on the nodes and communication bandwidth on the network unpredictable. This environment often requires users to use a programming model based on dynamic load balancing. In this paper, we use an flow field generation application to look at the problems that come up in a network environment. We use BEE, a monitoring system that allows programmers to interactively monitor their application, to show the behavior of the program under different conditions.
1. Introduction When implementing applications on network computers, programmers do not only have to work on parallelizing the application, but they also have to deal with the problem of working in a heterogeneous, shared environment. In this paper we use an application, simulating the air pollution in Los Angeles, to illustrate the problems of using such an architecture. This work was done in the context of the Nectar project. Nectar (NEtwork CompuTer ARchitecture) was designed specifically to support large-scale heterogeneous applications [1]. The Nectar network is built from fiberoptic lines and crossbar switches. Hosts are connected to the Nectar net through a network coprocessor that is responsible for protocol processing. A prototype system has been in use since January 1989 and it currently supports 26 nodes. The low latency communication of Nectar (200 µseconds host-host) and the flexibility of the communication coprocessor [2] make Nectar an attractive system for network computing, and several applications groups are using the Nectar prototype for their research [3]. This research was supported by Defense Advanced Research Projects Agency (DOD) monitored by DARPA/CMU under Contract MDA972-90-C-0035.
When working in a dynamic environment, being able to monitor both the application and the environment is critical. For this reason we developed monitoring tools based on BEE [4], a monitoring kernel for distributed environments that allows users to trace important events in their application efficiently. In Section 2 we first give an overview of the application that is used to illustrate the problems of network computing. In Sections 3 and 4 we describe a static and dynamic partitioning of the problem on Nectar. We finally illustrate how the two implementations behave under different conditions using BEE.
2. Simulating the Air Pollution in Los Angeles Flow field problems, such as weather forecasting and tracking of spills, are computationally intensive and can benefit from parallel processing. We have ported a program that tracks pollutant particles in the atmosphere of the Los Angeles area to Nectar. The input to the program are the wind velocities recorded at 67 weather stations around the Los Angeles area once every hour. The program calculates the traces of pollutant particles that are released in initial locations of interest. The sequential version of the LA simulation program is an example of a medium-size static application (2500 lines of FORTRAN), and was provided to us by Prof. McRae from the CMU Chemical Engineering Department. Computing the particle traces given the recorded data is a two phase process. Phase I consists of computing the wind velocity at each point of a regular grid on the area for every hour, given the measurements from the weather stations and precomputed weights. This problem involves interpolating from the measurements, as well as solving the conservation of mass equations across the grid. In phase II, each particle is tracked as it moves about the grid; this requires an interpolation in both space and time.
3. Parallel Static Implementation over Nectar When partitioning this program over Nectar, we tried to maintain the structure and code of the original sequential program as much as possible. Phase I of the computation was parallelized by distributing tasks that calculate the
wind velocities at each point in the grid for a given hour, across Nectar nodes. Phase II was parallelized by partitioning the particles among the nodes: each node tracks the motion of a set of particles for the duration of the simulation. The two phases are pipelined.
Number of nodes
Time (seconds)
Speedup
1
129
1.0
2
66
1.9
In the initial implementation, work was assigned to the nodes statically: the hours and particles were divided among the processors before computation begins. Table 1 shows the speedup that was achieved using this partitioning. The speedup is close to linear, and the reason is that the measurements were taken in a dedicated environment of Sun 4/330 workstations, that is, the workstations were not used by other users.
3
47
2.9
4
35
3.7
6
25
5.2
Table 2 Speedup with dynamic load balancing in dedicated environment
Table 1 Speedup for static mapping in dedicated environment
if the fraction of the CPU time that the application can use does not change by more than 50%. Larger swings in load can be handled in two ways. First, nodes on which the load has increased too much can be replaced by less loaded nodes, or can be dropped from the computation. Being able to drop or replace nodes is also useful for reasons other than load balancing: workstations "owners" might request their machine for their own work. Another way of dealing with larger swings in load is to expand the load balancing to include phase I. The calculations of the wind velocities in the grid points for each hour can be assigned to dynamically to nodes instead of statically. We are currently looking into expanding the load balancer, not only in the context of this application, but also for other applications.
4. Adding Dynamic Load Balancing
5. Capturing the Dynamic Behavior
Unfortunately, since the distribution of work is done statically, performance degrades quickly if the work assigned to each nodes does not match the processor speed, or if the load on the (shared) nodes changes during the execution. To avoid this degradation in performance, we added dynamic load balancing to phase II of the application. A central load balancer monitors the progress of each of the nodes, and if the difference in simulated time on the nodes becomes too large, it moves particles from slow nodes to fast nodes.
The debugging of network programs that use dynamic load balancing creates problems for both the implementor of the load balancer and for the application programmer. The implementor must make sure that the load balancer works efficiently and reacts correctly when the environment changes. The application programmers has to select the task granularity when parallelizing the application. In both cases, tools that provide monitoring information at runtime are crucial to detect performance bottlenecks.
If the network environment does not change, each processor traces its particles with minimal disruption: the only overhead consists of occasionally reporting its progress to the load balancer. Table 2 shows the performance of the application with dynamic load balancing in a dedicated environment. Again we get nearly linear speed up and a comparison with Table 1 shows that the overhead introduced by the dynamic load balancer is small. Showing that the dynamic load balancer is effective is however more difficult, and requires information on the dynamic behavior of the application (see Section 6).
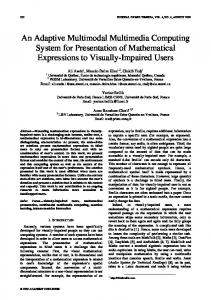
To capture the behavior of the load balancer, we instrumented the flow field application using BEE to give three views of its execution. The Simulation time view shows the progress on each node as measured by the simulation time. This view allows us to identify slow and fast nodes. The Nectar load view shows how much work is assigned to each node, that is, how many particles each node is tracing. A well balanced load does not mean that the work is equally distributed among the nodes, but rather that all the nodes are working on the same simulation time step. The CPU time view shows the computation time each node has contributed to the computation. Since the measure is native CPU time, equal CPU times do not mean an equal contribution to the computation for heterogeneous nodes. This view allows us to identify nodes that are shared with other users.
Number of nodes
Time (seconds)
Speedup
1
125
1.0
2
65
1.9
3
44
2.9
4
34
3.7
6
23
5.4
8
19
6.6
Each slave processor normally spends equal amounts of time on phases I and II. As a result, providing load balancing for only phase II of the application is sufficient
6. Discussion We monitored the execution of phase II of the flow field generation application both with and without dynamic load balancing. Using screendumps of the three views, taken while the application was running, we illustrate the problems that have to be solved when executing programs over a network, and the value of runtime monitoring in detecting and analyzing these problems. The experiments were done using Sun4/110 and Sun4/330 workstations as nodes, running X11 Release 4. Figure 1 shows the behavior of the application running on nodes with different computational power. The top screen dump shows the execution with a static partitioning. All workers have used the same amount of CPU time, but are working on different simulation times. hawk, for example, is behind in the simulation time because it is a slower workstation. The lower part of figure 1 shows how the load balancer takes care of this problem by reducing the number of particles traced by hawk from 16% to 6.12%. Even if the nodes are identical, the achieved speedup can still vary as is shown in Figure 2. Even though all nodes are Sun4/330 workstations, the application is not well balanced if a static partitioning is used (top screen dump) because zinfandel and gamay as is shown by the CPU time view. The lower part of Figure 2 shows how the load balancer takes care of the problem by moving particles from zinfandel and gamay to less loaded nodes.
In order to be able to adjust to larger changes in load, we implemented a facility for adding and dropping nodes at runtime at the request of the user. Figure 3 shows how the system reaches equilibrium after two additional nodes are made available to the application. The Nectar load view shows how the load balancer actually overshoots the new equilibrium. The lesson for the implementor is that the load balancer does not gracefully adjust to abrupt changes in the environment. Making the load balancer less sensitive by increasing the time interval over which it sees an imbalance before it moves particles makes the transition smoother, but also makes the load balancer slower to react.
7. Summary Using a flow field generation application we have shown several problems that have to be addressed when parallelizing applications in a network environment. Heterogeneous and shared nodes complicate the task of parallelizing the application. To address these problems features such as dynamic load balancing and dropping and adding of nodes at runtime have to be implemented. We also showed how tools for runtime monitoring such as BEE are useful in identifying problems, and are essential in understanding the behavior of the system. It is clearly not desirable to have each programmer separately address problems such as load balancing and reliability. Building tools to support these features for different classes of applications is an ongoing effort in the Nectar project.
Figure 1: Nodes with Different Computational Power
Architectures and Protocols, ACM, Philadelphia, September, 1990, pp. 135-143. 3. H.T. Kung, Peter Steenkiste, Marco Gubitoso, and Manpreet Khaira. Parallelizing a New Class of Large Applications over High-Speed Networks. Third ACM SIGPLAN Symposium on Principles and Practice of Parallel Programming, ACM, Williamsburg, April, 1991. 4. Bernd Bruegge and Peter Steenkiste. Supporting the Development of Network Programs. Proceedings of the Eleventh International Conference on Distributed Computing Systems, IEEE, Arlington, Texas, May, 1991.
Figure 2: Nodes with Different Computational Loads
Figure 3: Adding Nodes during the Computation
References 1. Emmanuel Arnould, Francois Bitz, Eric Cooper, H. T. Kung, Robert Sansom and Peter Steenkiste. The Design of Nectar: A Network Backplane for Heterogeneous Multicomputers. Proceedings of the Third International Conference on Architectural Support for Programming Languages and Operating Systems, ACM/IEEE, Boston, April, 1989, pp. 205-216. 2. Eric Cooper, Peter Steenkiste, Robert Sansom, and Brian Zill. Protocol Implementation on the Nectar Communication Processor. Proceedings of the SIGCOMM ’90 Symposium on Communications