Designation: E 308 – 01
Standard Practice for
Computing the Colors of Objects by Using the CIE System1 This standard is issued under the fixed designation E 308; the number immediately following the designation indicates the year of original adoption or, in the case of revision, the year of last revision. A number in parentheses indicates the year of last reapproval. A superscript epsilon (e) indicates an editorial change since the last revision or reapproval. This standard has been approved for use by agencies of the Department of Defense.
INTRODUCTION
Standard tables (Tables 1-4) of color matching functions and illuminant spectral power distributions have since 1931 been defined by the CIE, but the CIE has eschewed the role of preparing tables of tristimulus weighting factors for the convenient calculation of tristimulus values. There have subsequently appeared numerous compilations of tristimulus weighting factors in the literature with disparity of data resulting from, for example, different selections of wavelength intervals and methods of truncating abbreviated wavelength ranges. In 1970, Foster et al. (1)2 proposed conventions to standardize these two features, and Stearns (2) published a more complete set of tables. Stearns’ work and later publications such as the 1985 revision of E 308 have greatly reduced the substantial variations in methods for tristimulus computation that existed several decades ago. The disparities among earlier tables were largely caused by the introduction of computations based on 20-nm wavelength intervals. With the increasing precision of modern instruments, there is a likelihood of a need for tables for narrower wavelength intervals. Stearns’ tables, based on a 10-nm interval, did not allow the derivation of consistent tables with wavelength intervals less than 10 nm. The 1-nm table must be designated the basic table if others with greater wavelength intervals are to have the same white point, and this was the reason for the 1985 revision of E 308, resulting in tables that are included in the present revision as Tables 5. The 1994 revision was made in order to introduce to the user a method of reducing the dependence of the computed tristimulus values on the bandpass of the measuring instrument, using methods that are detailed in this practice. These changes, however, lead to tables (Tables 6 in this practice) that are substantially different from the Tables 5 that have been in use since 1985. There is accordingly a danger, if the new tables are introduced but not universally adopted, that there may again be, perhaps for several decades, a significant disparity among the tables of tristimulus weighting factors commonly used. It is highly desirable that this should be avoided. 1931 standard observer and X 10, Y10, Z 10 and x10. y10 for the CIE 1964 supplementary standard observer. 1.3 Standard values are included for the spectral power of six CIE standard illuminants and three CIE recommended fluorescent illuminants. 1.4 Procedures are included for cases in which data are available only in more limited wavelength ranges than those recommended, or for a measurement interval wider than that recommended by the CIE. This practice is applicable to spectral data obtained according to Practice E 1164 with 1-, 5-, 10-, or 20-nm measurement interval. 1.5 Procedures are included for cases in which the spectral data are, and those in which they are not, corrected for bandpass dependence. For the uncorrected cases, it is assumed that the spectral bandpass of the instrument used to obtain the data was approximately equal to the measurement interval and
1. Scope 1.1 This practice provides the values and practical computation procedures needed to obtain CIE tristimulus values from spectral reflectance, transmittance, or radiance data for objectcolor specimens. 1.2 Procedures and tables of standard values are given for computing from spectral measurements the CIE tristimulus values X, Y, Z, and chromaticity coordinates x, y for the CIE
1 This practice is under the jurisdiction of ASTM Committee E12 on Color and Appearance and is the direct responsibility of Subcommittee E12.04 on Color and Appearance Analysis. Current edition approved Aug. 10, 2001. Published November 2001. Originally published as E 308 – 66. Last previous edition E 308 – 99. 2 The boldface numbers in parentheses refer to the list of references at the end of this practice.
Copyright © ASTM International, 100 Barr Harbor Drive, PO Box C700, West Conshohocken, PA 19428-2959, United States.
1
E 308 – 01 was triangular in shape. These choices are believed to correspond to the most widely used industrial practice. 1.6 This practice includes procedures for conversion of results to color spaces that are part of the CIE system, such as CIELAB and CIELUV (3). Equations for calculating color differences in these and other systems are given in Test Method D 2244.
TABLE 1 Continued
TABLE 1 Spectral Tristimulus Values (Color-Matching Functions) x¯, y¯, z¯ of the CIE 1931 Standard (2°) Observer, at 5 nm Intervals from 380 to 780 nm (See Note 2 and Ref (3))
l(nm)
x¯(l)
y¯(l)
z¯(l)
635 640 645
0.5419 0.4479 0.3608
0.2170 0.1750 0.1382
0.0000 0.0000 0.0000
650 655 660 665 670
0.2835 0.2187 0.1649 0.1212 0.0874
0.1070 0.0816 0.0610 0.0446 0.0320
0.0000 0.0000 0.0000 0.0000 0.0000
675 680 685 690 695
0.0636 0.0468 0.0329 0.0227 0.0158
0.0232 0.0170 0.0119 0.0082 0.0057
0.0000 0.0000 0.0000 0.0000 0.0000
700 705 710 715 720
0.0114 0.0081 0.0058 0.0041 0.0029
0.0041 0.0029 0.0021 0.0015 0.0010
0.0000 0.0000 0.0000 0.0000 0.0000
725 730 735 740 745
0.0020 0.0014 0.0010 0.0007 0.0005
0.0007 0.0005 0.0004 0.0002 0.0002
0.0000 0.0000 0.0000 0.0000 0.0000
750 755 760 765 770
0.0003 0.0002 0.0002 0.0001 0.0001
0.0001 0.0001 0.0001 0.0000 0.0000
0.0000 0.0000 0.0000 0.0000 0.0000
775 780
0.0001 0.0000
0.0000 0.0000
0.0000 0.0000
l(nm)
x¯(l)
y¯(l)
z¯(l)
380 385 390 395
0.0014 0.0022 0.0042 0.0076
0.0000 0.0001 0.0001 0.0002
0.0065 0.0105 0.0201 0.0362
400 405 410 415 420
0.0143 0.0232 0.0435 0.0776 0.1344
0.0004 0.0006 0.0012 0.0022 0.0040
0.0679 0.1102 0.2074 0.3713 0.6456
425 430 435 440 445
0.2148 0.2839 0.3285 0.3483 0.3481
0.0073 0.0116 0.0168 0.0230 0.0298
1.0391 1.3856 1.6230 1.7471 1.7826
450 455 460 465 470
0.3362 0.3187 0.2908 0.2511 0.1954
0.0380 0.0480 0.0600 0.0739 0.0910
1.7721 1.7441 1.6692 1.5281 1.2876
475 480 485 490 495
0.1421 0.0956 0.0580 0.0320 0.0147
0.1126 0.1390 0.1693 0.2080 0.2586
1.0419 0.8130 0.6162 0.4652 0.3533
Summation at 5 nm intervals:
500 505 510 515 520
0.0049 0.0024 0.0093 0.0291 0.0633
0.3230 0.4073 0.5030 0.6082 0.7100
0.2720 0.2123 0.1582 0.1117 0.0782
TABLE 2 Spectral Tristimulus Values (Color-Matching Functions) x¯10, y¯10, z¯10 of the CIE 1964 Supplementary Standard (10°) Observer, At 5 nm Intervals from 380 to 780 nm (See Note 2 and Ref 3)
525 530 535 540 545
0.1096 0.1655 0.2257 0.2904 0.3597
0.7932 0.8620 0.9149 0.9540 0.9803
0.0573 0.0422 0.0298 0.0203 0.0134
550 555 560 565 570
0.4334 0.5121 0.5945 0.6784 0.7621
0.9950 1.0000 0.9950 0.9786 0.9520
575 580 585 590 595
0.8425 0.9163 0.9786 1.0263 1.0567
600 605 610 615 620 625 630
(x¯ (l) = 21.3714 (y¯ (l) = 21.3711 (z¯ (l) = 21.3715
l(nm)
x¯10(l)
y¯10(l)
z¯10(l)
380 385 390 395
0.0002 0.0007 0.0024 0.0072
0.0000 0.0001 0.0003 0.0008
0.0007 0.0029 0.0105 0.0323
0.0087 0.0057 0.0039 0.0027 0.0021
400 405 410 415 420
0.0191 0.0434 0.0847 0.1406 0.2045
0.0020 0.0045 0.0088 0.0145 0.0214
0.0860 0.1971 0.3894 0.6568 0.9725
0.9154 0.8700 0.8163 0.7570 0.6949
0.0018 0.0017 0.0014 0.0011 0.0010
425 430 435 440 445
0.2647 0.3147 0.3577 0.3837 0.3867
0.0295 0.0387 0.0496 0.0621 0.0747
1.2825 1.5535 1.7985 1.9673 2.0273
1.0622 1.0456 1.0026 0.9384 0.8544
0.6310 0.5668 0.5030 0.4412 0.3810
0.0008 0.0006 0.0003 0.0002 0.0002
450 455 460 465 470
0.3707 0.3430 0.3023 0.2541 0.1956
0.0895 0.1063 0.1282 0.1528 0.1852
1.9948 1.9007 1.7454 1.5549 1.3176
0.7514 0.6424
0.3210 0.2650
0.0001 0.0000
475 480
0.1323 0.0805
0.2199 0.2536
1.0302 0.7721
2
E 308 – 01 TABLE 2 Continued
TABLE 2 Continued
l(nm)
x¯10(l)
y¯10(l)
z¯10(l)
l(nm)
x¯10(l)
y¯10(l)
z¯10(l)
485 490 495
0.0411 0.0162 0.0051
0.2977 0.3391 0.3954
0.5701 0.4153 0.3024
500 505 510 515 520
0.0038 0.0154 0.0375 0.0714 0.1177
0.4608 0.5314 0.6067 0.6857 0.7618
0.2185 0.1592 0.1120 0.0822 0.0607
650 655 660 665 670
0.2683 0.2043 0.1526 0.1122 0.0813
0.1076 0.0812 0.0603 0.0441 0.0318
0.0000 0.0000 0.0000 0.0000 0.0000
525 530 535 540 545
0.1730 0.2365 0.3042 0.3768 0.4516
0.8233 0.8752 0.9238 0.9620 0.9822
0.0431 0.0305 0.0206 0.0137 0.0079
675 680 685 690 695
0.0579 0.0409 0.0286 0.0199 0.0138
0.0226 0.0159 0.0111 0.0077 0.0054
0.0000 0.0000 0.0000 0.0000 0.0000
550 555 560 565 570
0.5298 0.6161 0.7052 0.7938 0.8787
0.9918 0.9991 0.9973 0.9824 0.9556
0.0040 0.0011 0.0000 0.0000 0.0000
700 705 710 715 720
0.0096 0.0066 0.0046 0.0031 0.0022
0.0037 0.0026 0.0018 0.0012 0.0008
0.0000 0.0000 0.0000 0.0000 0.0000
575 580 585 590 595
0.9512 1.0142 1.0743 1.1185 1.1343
0.9152 0.8689 0.8256 0.7774 0.7204
0.0000 0.0000 0.0000 0.0000 0.0000
725 730 735 740 745
0.0015 0.0010 0.0007 0.0005 0.0004
0.0006 0.0004 0.0003 0.0002 0.0001
0.0000 0.0000 0.0000 0.0000 0.0000
600 605 610 615 620
1.1240 1.0891 1.0305 0.9507 0.8563
0.6583 0.5939 0.5280 0.4618 0.3981
0.0000 0.0000 0.0000 0.0000 0.0000
750 755 760 765 770
0.0003 0.0002 0.0001 0.0001 0.0001
0.0001 0.0001 0.0000 0.0000 0.0000
0.0000 0.0000 0.0000 0.0000 0.0000
775 780
0.0000 0.0000
0.0000 0.0000
0.0000 0.0000
625 630 635 640 645
0.7549 0.6475 0.5351 0.4316 0.3437
0.3396 0.2835 0.2283 0.1798 0.1402
0.0000 0.0000 0.0000 0.0000 0.0000
Summation at 5 nm intervals: (x¯10(l) = 23.3294 (y¯10(l) = 23.3324 (z¯10(l) = 23.3343
TABLE 3 Relative Spectral Power Distributions S(l) of CIE Standard Illuminants A, C, D50, D55, D65, and D75 at 5-nm Intervals from 380 to 780 nm (See Note 2 and Ref 3) l (nm)
A S(l)
C S(l)
D50 S(l)
D55 S(l)
D65 S(l)
D75 S(l)
380 385 390 395 400 405 410 415 420 425 430 435 440 445 450 455 460 465 470 475 480 485 490 495 500 505
9.80 10.90 12.09 13.35 14.71 16.15 17.68 19.29 20.99 22.79 24.67 26.64 28.70 30.85 33.09 35.41 37.81 40.30 42.87 45.52 48.24 51.04 53.91 56.85 59.86 62.93
33.00 39.92 47.40 55.17 63.30 71.81 80.60 89.53 98.10 105.80 112.40 117.75 121.50 123.45 124.00 123.60 123.10 123.30 123.80 124.09 123.90 122.92 120.70 116.90 112.10 106.98
24.49 27.18 29.87 39.59 49.31 52.91 56.51 58.27 60.03 58.93 57.82 66.32 74.82 81.04 87.25 88.93 90.61 90.99 91.37 93.24 95.11 93.54 91.96 93.84 95.72 96.17
32.58 35.34 38.09 49.52 60.95 64.75 68.55 70.07 71.58 69.75 67.91 76.76 85.61 91.80 97.99 99.23 100.46 100.19 99.91 101.33 102.74 100.41 98.08 99.38 100.68 100.69
49.98 52.31 54.65 68.70 82.75 87.12 91.49 92.46 93.43 90.06 86.68 95.77 104.86 110.94 117.01 117.41 117.81 116.34 114.86 115.39 115.92 112.37 108.81 109.08 109.35 108.58
66.70 68.33 69.96 85.95 101.93 106.91 111.89 112.35 112.80 107.94 103.09 112.14 121.20 127.10 133.01 132.68 132.36 129.84 127.32 127.06 126.80 122.29 117.78 117.19 116.59 115.15
3
E 308 – 01 TABLE 3 Continued l (nm)
A S(l)
C S(l)
D50 S(l)
D55 S(l)
D65 S(l)
D75 S(l)
510 515 520 525 530 535 540 545 550 555 560 565 570 575 580 585 590 595 600 605 610 615 620 625 630 635 640 645 650 655 660 665 670 675 680 685 690 695 700 705 710 715 720 725 730 735 740 745 750 755 760 765 770 775 780
66.06 69.25 72.50 75.79 79.13 82.52 85.95 89.41 92.91 96.44 100.00 103.58 107.18 110.80 114.44 118.08 121.73 125.39 129.04 132.70 136.35 139.99 143.62 147.24 150.84 154.42 157.98 161.52 165.03 168.51 171.96 175.38 178.77 182.12 185.43 188.70 191.93 195.12 198.26 201.36 204.41 207.41 210.36 213.27 216.12 218.92 221.67 224.36 227.00 229.59 232.12 234.59 237.01 239.37 241.68
102.30 98.81 96.90 96.78 98.00 99.94 102.10 103.95 105.20 105.67 105.30 104.11 102.30 100.15 97.80 95.43 93.20 91.22 89.70 88.83 88.40 88.19 88.10 88.06 88.00 87.86 87.80 87.99 88.20 88.20 87.90 87.22 86.30 85.30 84.00 82.21 80.20 78.24 76.30 74.36 72.40 70.40 68.30 66.30 64.40 62.80 61.50 60.20 59.20 58.50 58.10 58.00 58.20 58.50 59.10
96.61 96.87 97.13 99.61 102.10 101.43 100.75 101.54 102.32 101.16 100.00 98.87 97.74 98.33 98.92 96.21 93.50 95.59 97.69 98.48 99.27 99.16 99.04 97.38 95.72 97.29 98.86 97.26 95.67 96.93 98.19 100.60 103.00 101.07 99.13 93.26 87.38 89.49 91.60 92.25 92.89 84.87 76.85 81.68 86.51 89.55 92.58 85.40 78.23 67.96 57.69 70.31 82.92 80.60 78.27
100.70 100.34 99.99 102.10 104.21 103.16 102.10 102.53 102.97 101.48 100.00 98.61 97.22 97.48 97.75 94.59 91.43 92.93 94.42 94.78 95.14 94.68 94.22 92.33 90.45 91.39 92.33 90.59 88.85 89.59 90.32 92.13 93.95 91.95 89.96 84.82 79.68 81.26 82.84 83.84 84.84 77.54 70.24 74.77 79.30 82.15 84.99 78.44 71.88 62.34 52.79 64.36 75.93 73.87 71.82
107.80 106.30 104.79 106.24 107.69 106.05 104.41 104.23 104.05 102.02 100.00 98.17 96.33 96.06 95.79 92.24 88.69 89.35 90.01 89.80 89.60 88.65 87.70 85.49 83.29 83.49 83.70 81.86 80.03 80.12 80.21 81.25 82.28 80.28 78.28 74.00 69.72 70.67 71.61 72.98 74.35 67.98 61.60 65.74 69.89 72.49 75.09 69.34 63.59 55.01 46.42 56.61 66.81 65.09 63.38
113.70 111.18 108.56 109.55 110.44 108.37 106.29 105.60 104.90 102.45 100.00 97.81 95.62 94.91 94.21 90.60 87.00 87.11 87.23 86.68 86.14 84.86 83.58 81.16 78.75 78.59 78.43 76.61 74.80 74.56 74.32 74.87 75.42 73.50 71.58 67.71 63.85 64.46 65.08 66.57 68.07 62.26 56.44 60.34 64.24 66.70 69.15 63.89 58.63 50.62 42.62 51.98 61.35 59.84 58.32
TABLE 4 Relative Spectral Power Distributions S(l) of CIE Fluorescent Illuminants F2, F7, and F11 at 5-nm Intervals from 380 to 780 nm (See Note 2 and Ref 3) l(nm)
F2
F7
F11
380 385 390 395 400
1.18 1.48 1.84 2.15 3.44
2.56 3.18 3.84 4.53 6.15
0.91 0.63 0.46 0.37 1.29
405 410 415 420
15.69 3.85 3.74 4.19
19.37 7.37 7.05 7.71
12.68 1.59 1.79 2.46
TABLE 4 Continued
4
l(nm)
F2
F7
F11
425
4.62
8.41
3.38
430 435 440 445 450
5.06 34.98 11.81 6.27 6.63
9.15 44.14 17.52 11.35 12.00
4.49 33.94 12.13 6.95 7.19
455 460 465 470
6.93 7.19 7.40 7.54
12.58 13.08 13.45 13.71
7.12 6.72 6.13 5.46
E 308 – 01 TABLE 4 Continued
TABLE 4 Continued
l(nm)
F2
F7
F11
l(nm)
F2
F7
F11
475
7.62
13.88
4.79
780
0.27
0.81
0.09
480 485 490 495 500
7.65 7.62 7.62 7.45 7.28
13.95 13.93 13.82 13.64 13.43
5.66 14.29 14.96 8.97 4.72
505 510 515 520 525
7.15 7.05 7.04 7.16 7.47
13.25 13.08 12.93 12.78 12.60
2.33 1.47 1.10 0.89 0.83
530 535 540 545 550
8.04 8.88 10.01 24.88 16.64
12.44 12.33 12.26 29.52 17.05
1.18 4.90 39.59 72.84 32.61
555 560 565 570 575
14.59 16.16 17.56 18.62 21.47
12.44 12.58 12.72 12.83 15.46
7.52 2.83 1.96 1.67 4.43
580 585 590 595 600
22.79 19.29 18.66 17.73 16.54
16.75 12.83 12.67 12.45 12.19
11.28 14.76 12.73 9.74 7.33
605 610 615 620 625
15.21 13.80 12.36 10.95 9.65
11.89 11.60 11.35 11.12 10.95
9.72 55.27 42.58 13.18 13.16
630 635 640 645 650
8.40 7.32 6.31 5.43 4.68
10.76 10.42 10.11 10.04 10.02
12.26 5.11 2.07 2.34 3.58
655 660 665 670 675
4.02 3.45 2.96 2.55 2.19
10.11 9.87 8.65 7.27 6.44
3.01 2.48 2.14 1.54 1.33
680 685 690 695 700
1.89 1.64 1.53 1.27 1.10
5.83 5.41 5.04 4.57 4.12
1.46 1.94 2.00 1.20 1.35
705 710 715 720 725
0.99 0.88 0.76 0.68 0.61
3.77 3.46 3.08 2.73 2.47
4.10 5.58 2.51 0.57 0.27
730 735 740 745 750
0.56 0.54 0.51 0.47 0.47
2.25 2.06 1.90 1.75 1.62
0.23 0.21 0.24 0.24 0.20
755 760 765 770 775
0.43 0.46 0.47 0.40 0.33
1.54 1.45 1.32 1.17 0.99
0.24 0.32 0.26 0.16 0.12
1.7 This standard does not purport to address all of the safety concerns, if any, associated with its use. It is the responsibility of the user of this standard to establish appropriate safety and health practices and determine the applicability of regulatory limitations prior to use. 2. Referenced Documents 2.1 ASTM Standards: D 2244 Test Method for Calculation of Color Differences from Instrumentally Measured Color Coordinates3 E 284 Terminology of Appearance3 E 313 Practice for Calculating Yellowness and Whiteness Indices from Instrumentally Measured Color Coordinates3 E 1164 Practice for Obtaining Spectrophotometric Data for Object-Color Evaluation3 2.2 ANSI Standard: PH2.23 Lighting Conditions for Viewing Photographic Color Prints and Transparencies4 2.3 CIE/ISO Standards: CIE Standard S 001/ISO IS 10526, Colorimetric Illuminants4,45 CIE Standard S 002/ISO IS 10527, Colorimetric Observers4,45 CIE Standard D 001, Colorimetric Illuminants and Observers (Disk)5 2.4 ASTM Adjuncts: Computer disk containing Tables 5 and 66 3. Terminology 3.1 Definitions of terms in Terminology E 284 are applicable to this practice (see also Ref (4)). 3.2 Definitions: 3.2.1 bandpass, n—of a passband, the wavelength range over which the radiant power through the passband is at least half of its maximum value within the passband (syn: bandwidth) (see passband). 3.2.2 chromaticity, n—the color quality of a color stimulus definable by its chromaticity coordinates. 3.2.3 chromaticity coordinates, n—the ratio of each of the tristimulus values of a psychophysical color (see section 3.2.7.11) to the sum of the tristimulus values. 3.2.3.1 Discussion—In the CIE 1931 standard colorimetric system, the chromaticity coordinates are: x = X/(X + Y + Z), y = Y/(X + Y + Z), z = Z/( X + Y + Z); in the CIE 1964 supplementary colorimetric system, the same equations apply with all symbols having the subscript 10 (see 3.2.6.).
3
Annual Book of ASTM Standards, Vol 06.01. Available from American National Standards Institute, 13th Floor, 11 W. 42nd St., New York, NY 10036. 5 Available from USNC-CIE Publications Office, c/o Mr. Thomas M. Lemons, TLA-Lighting Consultants, 7 Pond Street, Salem, MA 01970-4819. 6 Computer disk of 72 tables is available from ASTM Headquarters. Request Adjunct No. ADJE0308a. 4
5
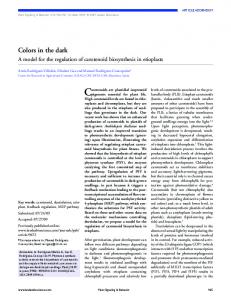
E 308 – 01 3.2.4 CIE, n—the abbreviation for the French title of the International Commission on Illumination, Commission Internationale de l’Éclairage. 3.2.5 CIE 1931 (x, y) chromaticity diagram, n—chromaticity diagram for the CIE 1931 standard observer, in which the CIE 1931 chromaticity coordinates are plotted, with x as abscissa and y as ordinate. 3.2.6 CIE 1964 (x 10 , y 10 ) chromaticity diagram, n—chromaticity diagram for the CIE 1964 supplementary standard observer, in which the CIE 1964 chromaticity coordinates are plotted, with x10 as abscissa and y10 as ordinate. 3.2.6.1 Discussion—Fig. 1 shows the CIE 1931 and 1964 chromaticity diagrams, including the locations of the spectrum locus and the connecting purple boundary. 3.2.7 CIE 1976 (u8, v8) or (u810, v810) chromaticity diagram, n—chromaticity diagram in which the CIE 1976 L* u* v* (CIELUV) chromaticity coordinates are plotted, with u8 (or u810) as abscissa and v8 (or v810) as ordinate. 3.2.8 CIE 1931 standard colorimetric system, n—a system for determining the tristimulus values of any spectral power distribution using the set of reference color stimuli, X, Y, Z and the three CIE color–matching functions x¯ (l), y¯ (l), z¯ (l) adopted by the CIE in 1931. 3.2.9 CIE 1964 supplementary standard colorimetric system, n—a system for determining the tristimulus values of any spectral power distribution using the set of reference color stimuli X10, Y10, Z10 and the three CIE color-matching functions x¯10(l), y¯10(l), z¯10(l) adopted by the CIE in 1964 (see Note 1).
system and standard observer assume no contribution or constant contribution of rods to vision. Under some circumstances, such as in viewing highly metameric pairs in very low light levels (where the rods are unsaturated), the amount of rod participation can vary between the members of the pair. This is not accounted for by any trichromatic system of colorimetry. The 10° system and observer should be used with caution in such circumstances.
3.2.10 color, n—of an object, aspect of object appearance distinct from form, shape, size, position or gloss that depends upon the spectral composition of the incident light, the spectral reflectance, transmittance, or radiance of the object, and the spectral response of the observer, as well as the illuminating and viewing geometry. 3.2.11 color, n—psychophysical, characteristics of a color stimulus (that is, light producing a visual sensation of color) denoted by a colorimetric specification with three values, such as tristimulus values. 3.2.12 color–matching functions, n— the amounts, in any trichromatic system, of three reference color stimuli needed to match, by additive mixing, monochromatic components of an equal–energy spectrum. 3.2.13 fluorescent illuminant, n—illuminant representing the spectral distribution of the radiation from a specified type of fluorescent lamp. 3.2.14 CIE recommended fluorescent illuminants, n—a set of spectral power distributions of 12 types of fluorescent lamps, the most important of which are F2, representing a cool white fluorescent lamp with correlated color temperature 4200 K, F7, a broad-band (continuous-spectrum) daylight lamp (6500 K), and F11, a narrow-band (line-spectrum) white fluorescent lamp (4000 K).
NOTE 1—Users should be aware that the CIE 1964 (10°) supplementary
FIG. 1 The CIE 1931 x , y and 1964 x10, y10 Chromaticity Diagrams (5) (see Note 2)
6
E 308 – 01 3.2.28 tristimulus values, n—see 3.2.8 and 3.2.9. 3.2.29 tristimulus weighting factors, Sx¯, Sy¯, Sz¯ , n—factors obtained from products of the spectral power S of an illuminant and the spectral color-matching functions x¯, y¯, z¯ (or x¯10, y¯10, z¯10) of an observer, usually tabulated at wavelength intervals of 10 or 20 nm, used to compute tristimulus values by multiplication by the spectral reflectance, transmittance, or radiance (or the corresponding factors) and summation. 3.2.29.1 Discussion—Proper account should be taken of the spectral bandpass of the measuring instrument.
3.2.15 luminous, adj—weighted according to the spectral luminous efficiency function V (l) of the CIE. 3.2.16 opponent-color scales, n—scales that denote one color by positive scale values, the neutral axis by zero value, and an approximately complementary color by negative scale values, common examples being scales that are positive in the red direction and negative in the green direction, and those that are positive in the yellow direction and negative in the blue direction. 3.2.17 CIELAB color scales, n—CIE 1976 L*, a*, b* opponent-color scales, in which a* is positive in the red direction and negative in the green direction, and b* is positive in the yellow direction and negative in the blue direction. 3.2.18 CIELUV color scales, n—CIE 1976 L*, u*, v* opponent-color scales, in which u* is positive in the red direction and negative in the green direction, and v* is positive in the yellow direction and negative in the blue direction. 3.2.19 passband, n—a narrow portion of a dispersed spectrum, selected by the exit slit of a monochromator or the equivalent, for the purpose of defining an emitted spectral power function. 3.2.19.1 Discussion—The shape of the spectral transmittance function of the passband may be triangular, trapezoidal, or rectangular, among others, but is usually symmetrical. 3.2.20 spectral, adj—for radiometric quantities, pertaining to monochromatic radiation at a specified wavelength or, by extension, to radiation within a narrow wavelength band about a specified wavelength. 3.2.21 standard illuminant, n—a luminous flux, specified by its spectral distribution, meeting specifications adopted by a standardizing organization. 3.2.22 CIE standard illuminant A, n—colorimetric illuminant, representing the full radiator at 2855.6 K, defined by the CIE in terms of a relative spectral power distribution. 3.2.23 CIE standard illuminant C, n—colorimetric illuminant, representing daylight with a correlated color temperature of 6774 K, defined by the CIE in terms of a relative spectral power distribution. 3.2.24 CIE standard illuminant D65, n—colorimetric illuminant, representing daylight with a correlated color temperature of 6504 K, defined by the CIE in terms of a relative spectral power distribution. 3.2.24.1 Discussion—Other illuminants of importance defined by the CIE include the daylight illuminants D50, D55, and D75. Illuminant D50 is used by the graphic arts industry for viewing colored transparencies and prints (see ANSI PH2.23). 3.2.25 standard observer, n—an ideal observer having visual response described by the CIE color-matching functions (see CIE S002 and Ref (3)). 3.2.26 CIE 1931 standard observer, n—ideal colorimetric observer with color-matching functions x¯(l), y¯ (l), z¯ (l) corresponding to a field of view subtending a 2° angle on the retina; commonly called the “2° standard observer.” 3.2.27 CIE 1964 supplementary standard observer, n—ideal colorimetric observer with color-matching functions x¯10(l), y¯ 10(l), z¯10(l) corresponding to a field of view subtending a 10° angle on the retina; commonly called the “10° standard observer” (see Note 1).
4. Summary of Practice 4.1 Selection of Parameters—The user of this practice must select values of the following parameters: 4.1.1 Observer—Select either the CIE 1931 standard colorimetric observer (2° observer) or the CIE 1964 supplementary standard observer (10° observer), tabulated in this practice, CIE Standard S 002 or D 001, or Ref (3) (see 3.2.25 and Note 1). 4.1.2 Illuminant—Select one of the CIE standard or recommended illuminants tabulated in this practice, CIE Standard S 001 or D 001, or Ref (3) (see 3.2.21). 4.1.3 Measurement Interval—Select the measurement interval of the available spectral data. This practice provides for 1-, 5-, 10-, or 20-nm measurement intervals. For best practice the measurement interval should be selected to be as nearly as possible equal to the instrument bandpass. 4.2 Procedures—The user should ascertain whether or not the spectral data have been corrected for bandpass dependence. The accuracy of tristimulus values is significantly improved by incorporating a correction for bandpass dependence into either the spectral data or the tables of tristimulus weighting factors (see 7.2). The procedures used depend on this and on the measurement interval. 4.2.1 For data obtained at 1- or 5-nm measurement interval, the procedures of 7.2 should be followed. 4.2.2 For data obtained at 10- or 20-nm measurement interval, the tables of tristimulus weighting factors contained in Tables 5 should be used with spectral data that have been corrected for bandpass dependence. The tables contained in Tables 6 should be used with spectral data that have not been so corrected; these tables include a provision that minimizes the error introduced by bandpass dependence when employing a triangular passband equal in half width to the measurement interval. 4.2.3 A flow chart to ensure the use of proper combinations of data and tables is given in Fig. 2. The procedures of the practice are given in detail in 7.1. 4.3 Calculations—CIE tristimulus values X, Y, Z or X10, Y10, Z10 are calculated by numerical summation of the products of tristimulus weighting factors for selected illuminants and observers with the reflectance factors (or transmittance or radiance factors) making up the spectral data. 4.4 The tristimulus values so calculated may be further converted to coordinates in a more nearly uniform color space such as CIELAB or CIELUV. 7
E 308 – 01
NOTE 1—References to Section 7. Calculations are Included. FIG. 2 Flow Chart for Selecting Methods and Tables for Tristimulus Integration
5. Significance and Use 5.1 The CIE colorimetric systems provide numerical specifications that are meant to indicate whether or not pairs of color stimuli match when viewed by a CIE standard observer. The CIE color systems are not intended to provide visually uniform scales of color difference or to describe visually perceived color appearances. 5.2 This practice provides for the calculation of tristimulus values X, Y, Z and chromaticity coordinates x, y that can be used directly for psychophysical color stimulus specification or that can be transformed to nearly visually uniform color scales,
such as CIELAB and CIELUV. Uniform color scales are preferred for research, production control, color-difference calculation, color specification, and setting color tolerances. The appearance of a material or an object is not completely specified by the numerical evaluation of its psychophysical color, because appearance can be influenced by other properties such as gloss or texture. 6. Procedure 6.1 Selecting Standard Observer—When colorimetric results are required that will be compared with previous results 8
E 308 – 01 7.1.1 Procedures as Specified by the CIE— The CIE procedures are specified in Ref (3) and summarized in Refs (5 to 9). The fundamental definition is in terms of integrals,
obtained for the CIE 1931 standard observer, use the values in Table 1 for that observer. When new results are being computed, consider using the values in Table 2 for the CIE 1964 supplementary standard observer, but see Note 1. 6.1.1 Whenever correlation with visual observations using fields of angular subtense between about 1° and about 4° at the eye of the observer is desired, select the CIE 1931 standard colorimetric observer. 6.1.2 Whenever correlation with visual observations using fields of angular subtense greater than 4° at the eye of the observer is desired, select the CIE 1964 supplementary standard colorimetric observer (but see Note 1). 6.2 Selecting Standard or Recommended Illuminants— Select illuminants according to the type of light(s) under which objects will be viewed or for which their colors will be specified or evaluated. 6.2.1 When incandescent (tungsten) lamplight is involved, use values for CIE illuminant A. 6.2.2 When daylight is involved, use values for CIE illuminant C or D65. 6.2.3 When fluorescent-lamp illumination is involved, use 4200 K standard cool white (F2) unless results are desired for 6500 K broad-band daylight (F7) or 4000 K narrow-band white (F11) fluorescent illumination. 6.3 Selecting the Measurement Interval— For greater accuracy select the 5-nm measurement interval over the 10-nm interval where spectral data are available at 5-nm intervals. Likewise, select the 10-nm measurement interval over the 20-nm interval where spectral data are available at 10-nm intervals. If the 20-nm interval is selected, users should ensure themselves that the resulting accuracy is sufficient for the purpose for which the results are intended. For many industrial applications use of the 20-nm interval may be satisfactory. 6.3.1 If the instrument used has a selectable measurement interval, select the interval that most nearly equals the bandpass of the instrument throughout the spectrum. If the instrument has an adjustable bandpass, adjust the bandpass to be approximately equal to the measurement interval. 6.3.2 The measurement interval should never be greater than the bandpass (half width of the passband). The use of a measurement interval less than the bandpass does not improve the accuracy of the computation, but may improve the repeatability by providing redundant spectral data. 6.4 Other Miscellaneous Conditions— While the above selections cover the majority of industrial practices, the possibility exists that other conditions could be encountered. Further, the deconvolution routine used to produce Tables 6 is not unique and uses approximating techniques that, while providing overall a good approximation to the true value, may not in a specific instance provide the best approximation. Therefore, other procedures than those included in this practice may be used provided that the results are consistent with those obtained by use of the procedures in the practice.
X 5k
*R~l! S~l! x¯~l! dl
(1)
l
Y 5k
*R~l! S~l! y¯~l! dl l
Z 5k
*R~l! S~l! z¯~l! dl l
where: R(l)
= the reflectance, transmittance, or radiance factor (on a scale of zero to one for the perfect reflecting diffuser), S(l) = the relative spectral power of a CIE standard illuminant, and x¯(l), y¯(l), z¯(l) = the color-matching functions of one of the CIE standard observers. The integration is carried out over the entire wavelength region in which the color-matching functions are defined, 360 to 830 nm. The normalizing factor k is defined as k 5 100 /
* S~l! y¯~l! dl
(2)
l
The CIE notes that in all practical calculations of tristimulus values the integration is approximated by a summation, giving the equations as follows: X 5 k ( R~l! S~l! x¯~l! Dl l
(3)
Y 5 k ( R~l! S~l! y¯~l! Dl l
Z 5 k ( R~l! S~l! z¯~l! Dl l
with: k 5 100 / ( S~l!¯y~l! Dl. l
(4)
7.1.2 Procedure Using Tristimulus Weighting Factors—It is common industrial practice to carry out the summation to tristimulus values in two steps. In the first of these, a set of normalized tristimulus weighting factors Wx, Wy, Wz is calculated as follows: Wx ~l! 5 k S~l! x¯~l!Dl
(5)
Wy ~l! 5 kS~l! y¯~l! Dl Wz ~l! 5 kS~l! z¯~l! Dl
for l = 360, ... 780 nm, (see Note 2), and where: 780
k 5 100/ ( S~l! y¯~l! Dl
(6)
360
For a given selection of illuminant, observer, measurement interval Dl, and measurement bandpass, this calculation needs to be done only once, since the spectral reflectance (or transmittance or radiance) factor R (l) is not included in the weighting factors W. In the second step, tristimulus values X, Y, Z (or X10, Y 10, Z10) are calculated using the values of W and R (l) in the following equations:
7. Calculations 7.1 General Procedures—The general procedures for computing CIE tristimulus values are summarized as follows: 9
E 308 – 01 observer. Select the desired CIE standard or recommended illuminant, for example A, C, or one of the D or F illuminants from Table 3 or Table 4. At each wavelength multiply the tabulated value of the observer color-matching functions by the tabulated value of the relative spectral power of the illuminant S (l), and by the spectral reflectance (or transmittance) factor R (l) (or T (l)) of the specimen. Obtain the sum of these products at 5 nm intervals over the wavelength range 360 to 780 nm and use (Eq 3) and (Eq 4). 7.3.2 Use of Data Obtained at 10- or 20-nm Measurement Intervals: 7.3.2.1 Data Available over the Wavelength Range 360 to 780 nm—Select the appropriate tables of tristimulus weighting factors, computed for triangular bandpass and 10- or 20-nm measurement intervals, for the desired observer and illuminant, from among the 36 sets included in Tables 5 (12) for bandpasscorrected data, and from among the 36 sets included in Tables 6 for data that have not been corrected for bandpass dependence. No normalization of any data from Tables 5 or 6 is required. 7.3.2.2 Data Available only for Wavelength Ranges Shorter than 360 to 780 nm—When data for R (l), T (l), or b(l) are not available for the full wavelength range, add the weights at the wavelengths for which data are not available to the weights at the shortest and longest wavelength for which spectral data are available. That is: add the weights for wavelengths 360, ..., up to the last wavelength for which measured data are not available, to the next higher weight, for which such data are available; add the weights for wavelengths of 780, ..., down to the last wavelength for which measured data are not available, to the next lower weight, for which such data are available. 7.3.3 Tristimulus Values—Obtain the products of R (l), T (l) or b(l) and the weights selected in 7.3.1 or 7.3.2, including any modifications, and sum to obtain the CIE tristimulus values X, Y, Z, or X10, Y10, Z10. 7.4 Chromaticity Coordinates—Obtain chromaticity coordinates x, y, z (for the CIE 1931 standard observer) by dividing each tristimulus value X, Y, Z by the sum of all three: x = X/(X + Y + Z); y = Y/(X + Y + Z); and z = Z/(X + Y + Z), or use the same procedure with all quantities having the subscript 10 for the CIE 1964 supplementary standard observer. 7.5 CIE 1976 Uniform Color Spaces— When a color space more nearly uniform than X, Y, Z is desired, use CIELAB or CIELUV. 7.5.1 CIELAB or L*a*b*—This approximately uniform color space is produced by plotting in rectangular coordinates the quantities L*, a*, b* defined as follows:
780
X5
(Wx~l! R~l!Dl
(7)
360 780
Y5
( Wy ~l! R~l!Dl
360 780
Z5
( W z ~l! R~l! Dl
360
NOTE 2—While 360 nm is recommended as the starting wavelength for summation and elsewhere in this practice, CIE data reproduced in Tables 1-4, and the spectrum locus scale of Fig. 1, begin only at 380 nm; since the missing data cannot be supplied in all cases, these references to 380 nm should remain. In the region between 360 and 379 nm, values of color matching functions are so small that their inclusion or omission in the calculations would not lead to significant differences in the resulting tristimulus values.
7.2 Summary of Calculations (see Note 2)—A general outline of the procedure is given in Fig. 2 in the form of a flow chart. Begin by determining whether or not the spectral data have been corrected for bandpass dependence. NOTE 3—For reflecting materials, calculate tristimulus values from spectral data obtained relative to the perfect reflecting diffuser. For transmitting materials, calculate by use of the incident light as the reference.
7.2.1 Procedure for 1-nm Measurement Interval—Use the 1-nm spectral data in CIE S001 and S002 (or on CIE D001 Disk) and (Eq 3) and (Eq 4). 7.2.2 Procedures for Spectral Data With Bandpass Correction: 7.2.2.1 Procedure for Data Obtained at 5-nm Measurement Intervals—Prepare tables of tristimulus weighting factors for desired illuminant-observer combinations, using the spectral data in Tables 1-4 (see Note 2), and (Eq 5) and (Eq 6). Use the tables so prepared as described in 7.3 (see Note 4). NOTE 4—Using the previous procedure at 10 nm or 20 nm intervals by omitting intermediate tabulated values is not allowed. Use the procedures of 7.2.3.2 and 7.3 instead.
7.2.2.2 Procedures for Data Obtained at 10- or 20-nm Measurement Intervals—Select the appropriate tables of tristimulus weighting factors from those in Tables 5 and use them as described in 7.3. 7.2.3 Procedures for Spectral Data Without Bandpass Correction: 7.2.3.1 Procedure for Data Obtained at 5-nm Measurement Intervals—Prepare optimized tables of tristimulus weighting factors for desired illuminant-observer combinations, using the spectral data in Tables 1-4 (see Note 2), and procedures described in the literature (10, 11). Use the tables so prepared as described in 7.3. 7.2.3.2 Procedures for Data Obtained at 10- or 20-nm Measurement Intervals—Select the appropriate tables of tristimulus weighting factors from Tables 6 and use them as described in 7.3. 7.3 Use of Tristimulus Weighting Factors: 7.3.1 Use of Data Obtained at 5-nm Measurement Intervals—Use the color-matching functions x¯(l), y¯ (l), z¯ (l), from Table 1, for the 1931 CIE standard colorimetric observer, or when desired the functions x¯10(l), y¯10(l), z¯10(l), from Table 2, for the 1964 CIE supplementary standard colorimetric
L* 5 116~Y/Yn!1/3 2 16
(8)
1/3
2 ~Y/Yn! #
1/3
2 ~Z/Z n!1/3#
a* 5 500[~X/Xn! b* 5 200[~Y/Yn!
1/3
where: X/Xn; Y/Yn; Z/Zn . 0.01.
(9)
The tristimulus values X n, Yn, Zn define the color of the normally white object-color stimulus. Usually, the white object-color stimulus is given by the spectral radiant power of 10
E 308 – 01 CIELAB and CIELUV spaces: CIE 1976 hue angles:
one of the CIE standard illuminants, for example, C, D65 or another of daylight quality, reflected into the observer’s eye by the perfect reflecting diffuser. Under these conditions, X n, Yn, Zn are the tristimulus values of the standard illuminant with Yn equal to 100 obtained by use of the same method used to obtain X, Y, Z (see 7.6). 7.5.1.1 The CIE 1976 (L*a*b*) space fails to approximate uniform color spacing when one or more of the ratios X/X n, Y/Yn, and Z/Znis less than 0.01. 7.5.1.2 In calculating L*, values of Y/Ynless than 0.01 may be included if the normal formula is used for values of Y/Yn greater than 0.008856, and the following modified formula is used for values of Y/Ynequal to or less than 0.008856: L* 5 903.3~Y/Yn!
Y/Y n # 0.008856
hab 5 tan 21~b*/a*! or
C*ab 5 [~a*!2 1 ~b*! 2#1/2
(10)
(11)
where: X/Xn . 0.008856
f~X/Xn! 5 7.787~X/X n! 1 16/116 1/3
f~Y/Yn! 5 ~Y/Y n!
1/3
f~Z/Zn! 5 ~Z/Z n!
(12)
X/X n # 0.008856 Y/Yn . 0.008856
f~Y/Yn! 5 7.787~Y/Y n! 1 16/116
Y/Y n # 0.008856 Z/Zn . 0.008856
f~Z/Zn! 5 7.787~Z/Z n! 1 16/116
Y/Yn . 0.01
(16)
8.1 The report of color calculations shall include the following: 8.1.1 Specimen Identification: 8.1.2 Source of Data—Give instrument identification, illuminating and viewing geometry, spectral bandpass, and date of measurement. 8.1.3 Standard Observers—Indicate whether the reported data were computed for the CIE 1931 standard observer (2°) or the CIE 1964 supplementary standard observer (10°), or specify any other observers that were used. 8.1.4 Standard or Recommended Illuminants—Indicate which of the following illuminants were used, or specify any other illuminants that were used: A, C, D50, D55, D 65, D75, F2, F7, F11. 8.1.5 Bandpass Correction—Indicate whether or not the spectral data were corrected for bandpass, and which sets of tables of tristimulus weighting factors were used. 8.1.6 Method of Calculation—Indicate whether the procedures for 1-nm bandpass and measurement interval, or for 5-nm triangular bandpass and measurement interval, or a specific abridged procedure (for 10- or 20-nm triangular bandpass and measurement interval) were used, and give the wavelength range of the spectral data used. 8.1.7 Tristimulus Values—Report as X, Y, Z or X10, Y10, Z10. 8.1.8 Chromaticity Coordinates—Report as x, y or x10, y10. 8.1.9 As an alternative to 8.1.7 or 8.1.8, report CIELAB results as L*a*b* or L*C*abh ab, or CIELUV results as L*u*v* or L*C*uvhuv.
(13)
u* 5 13L*~u8 2 u8 n! v* 5 13L*~v8 2 v8 n!
with: 4X u8 5 X 1 15Y 1 3Z
C*uv 5 [~u*! 2 1 ~v*!2#1/2
8. Report
Z/Z n # 0.008856
7.5.2 CIELUV or L*u*v*—This approximately uniform color space is produced by plotting in rectangular coordinates the quantities L*, u*, v* defined as follows (see also Note 5): L* 5 116~Y/Y n!1/3 2 16
or
7.5.3.2 Differences in hue angle between two specimens can be correlated with differences in their visually perceived hue, and differences in their chroma can similarly be correlated with differences in their visually perceived chroma (see also Test Method D 2244). 7.6 Tristimulus Values Xn, Yn, Zn: 7.6.1 It is emphasized that the tristimulus values of the nominally white object-color stimulus must always be calculated by the same method used to calculate tristimulus values for other colors with which they are to be used. This implies not only use of the same illuminant and observer, but also of the same measurement interval, bandpass, band shape, and method of summation. When using Tables 5 or 6 for measurement intervals of 10 or 20 nm, the values tabulated as “White Point” at the bottoms of the tables must always be the ones used for Xn, Y n, and Zn. 7.6.2 Use values of Xn, Y n, and Zn meeting the above requirements in the calculation of CIELAB coordinates and in some single-number color scales such as those for indexes of yellowness and whiteness, among others (see Practice E 313).
b* 5 200[f~Y/Yn! 2 f~Z/Z n!# f~X/Xn! 5 ~X/X n!1/3
(15)
CIE 1976 chromas:
7.5.1.3 In calculating a* and b* values of X/Xn, Y/Yn, Z/Znless than 0.01 may be included if the normal equations are replaced by the following modified equations for all calculations of a* and b*: a* 5 500[f~X/Xn! 2 f~Y/Y n!#
h uv 5 tan21~v*/u*!
(14)
9Y v8 5 X 1 15Y 1 3Z 4Xn u8n 5 X 1 15Y 1 3Z n n n 9Yn v8nX 1 15Y 1 3Z n n n
7.5.2.1 In calculating L* values for Y/Yn less than 0.01, use the same equation given in 7.5.1.3. NOTE 5—The CIE 1976 L*u*v* space incorporates, for constant L*, a (u8, v8) chromaticity diagram which is a projective transformation of the CIE 1931 (x, y) chromaticity diagram. Straight lines in the (x, y) chromaticity diagram remain straight in the (u8, v8) diagram.
7.5.3 LCH Versions of CIELAB and CIELUV: 7.5.3.1 It may be useful to calculate CIE 1976 hue and chroma coordinates as follows, combining them with L* to provide alternative sets of LCH coordinates within the 11
E 308 – 01 9. Precision and Bias 9.1 Precision—The precision of results calculated by use of Tables 1-5 is limited by the precision of the measured spectral data and round-off of the data used in the calculations. The precision of Tables 6, incorporating correction for bandpass dependence, is believed to be about 4.5 log units (digits). Thus the precision of the results is expected to be limited by the precision of the spectral data, not of the tables. 9.2 Bias—In the calculation procedures of 7.2, the bias is the same as the precision when the same spectral data are used. Bias of the abridged calculation procedures of 7.3 depends on the measurement interval and wavelength range, the complexity of the spectral character of the specimen, and the degree to which the passband of the measuring instrument conforms to the width and ideal triangular shape assumed in computing the tables. Least bias is obtained with the smallest measurement interval, the largest wavelength range, and the best correspondence of passband width and shape.
9.2.1 The uncertainty of the tristimulus values depends on the uncertainty of the spectral measurements. 9.2.2 The use of Tables 6, which incorporate the correction for bandpass dependence, has been shown (11) to reduce, on average, the bias of these calculations by about 0.1 to 0.3 CIELAB unit of color difference, when compared to calculations in which the bandpass correction is ignored. The actual reduction in bias in any given case depends on the spectral character of the data used. 9.2.3 The bias introduced by conversion of text to numeric formats, and that introduced by floating-point processor noise, are mostly insignificant. 10. Keywords 10.1 CIELAB; CIELUV; CIE system; color coordinates; tristimulus integration; tristimulus values; tristimulus weighting factors
REFERENCES (1) Foster, W. H., Jr., Gans, R., Stearns, E. I., and Stearns, R. E., “Weights for Calculation of Tristimulus Values from Sixteen Reflectance Values,” Color Engineering, Vol 8, No. 3, 1970, pp. 35–47. (2) Stearns, E. I., “Weights for Calculation of Tristimulus Values,” Clemson Review of Industrial Management and Textile Science, Vol 14, No. 1, 1975, pp. 79–113. (3) Commission Internationale de l’Éclairage, Publication CIE No. 15.2, Colorimetry, 2nd ed., Central Bureau of the CIE, Vienna, 1986. (4) Commission Internationale de l’Éclairage, Publication CIE No. 17, International Lighting Vocabulary, 3rd ed., 1970; 4th ed., 1987. Central Bureau of the CIE, Vienna. (5) Judd, D. B., and Wyszecki, G., “Calculation of Tristimulus Values and Chromaticity Coordinates,” Color in Business, Science and Industry, 3rd ed., John Wiley and Sons, New York, 1975, pp. 139–149. (6) Billmeyer, F. W., and Saltzman, M., Principles of Color Technology, 2nd ed., John Wiley and Sons, New York, 1981.
(7) Hunter, R. S., and Harold, R. W., The Measurement of Appearance, 2nd ed., John Wiley and Sons, New York, 1987. (8) Wyszecki, G., and Stiles, W. S., Color Science, 2nd ed., John Wiley and Sons, New York, 1982. (9) Billmeyer, F. W., and Fairman, H. S., “CIE Method for Calculating Tristimulus Values,” Color Research and Application, Vol 12, 1987, pp. 27–36. (10) Stearns, E. I., and Stearns, R. E., “An Example of a Method for Correcting Radiance Data for Bandpass Error,” Color Research and Application, Vol 13, 1988, pp. 257–259. (11) Venable, W. H., “Accurate Tristimulus Values from Spectral Data,” Color Research and Application, Vol 14, 1989, pp. 260–267. (12) Fairman, H. S., “The Calculation of Weight Factors for Tristimulus Integration,” Color Research and Application, Vol 10, 1985, pp. 199–203.
INTRODUCTION TO TABLES 5 AND 6 Tables 5 and 6 consist of sets of 36 tables each, containing tristimulus weighting factors for a variety of CIE standard and recommended illuminants and the CIE 1931 and 1964 standard observers. Both 10-nm and 20-nm measurement intervals are represented for all illuminant-observer combinations. The tables are presented with three decimal digits of precision. These digits should be carried in the calculations until the final values sought are calculated, and only then should the results be rounded to the appropriate number of significant digits available in the measured data. Note that in the case of the values in Tables 5 the interpolation procedure, and in the case of the values in Tables 6 the approximating procedure, lead to some small values with a negative sign. This sign is correct, and the corresponding entry must be carried in the calculations as a negative number.
The data labeled “Check Sum” at the bottom of each column in each table of Tables 5 and 6 is the algebraic sum of the entries above. It provides as a convenience the assurance that the tables have been copied correctly should copying be required. These check sums may not be identical to the “White Point” data located below them because of roundoff. Each value in a column has been rounded to three decimal digits. The “White Point” is the analytic total of the double-precision values at each wavelength, rounded to three decimal digits. It is these “White Point” data, and no others, that must be used as Xn, Yn, Zn when converting tristimulus values calculated by use of these tables to CIELAB or CIELUV coordinates or for any other purpose requiring the ratio of the tristimulus value of the specimen to that of the white point.
12
E 308 – 01 TABLE 5 Index for Tables 5.1 Through 5.36 and Tables 6.1 Through 6.36 Tables 5.1, 6.1 5.2, 6.2 5.3, 6.3 5.4, 6.4 5.5, 6.5 5.6, 6.6 5.7, 6.7 5.8, 6.8 5.9, 6.9 5.10, 6.10 5.11, 6.11 5.12, 6.12 5.13, 6.13 5.14, 6.14 5.15, 6.15 5.16, 6.16 5.17, 6.17 5.18, 6.18
Illuminant
Observer
Measurement Interval
A A A A C C C C D50 D50 D50 D50 D55 D55 D55 D55 D65 D65
1931 1931 1964 1964 1931 1931 1964 1964 1931 1931 1964 1964 1931 1931 1964 1964 1931 1931
10 nm 20 10 20 10 20 10 20 10 20 10 20 10 20 10 20 10 20
Tables 5.19, 5.20, 5.21, 5.22, 5.23, 5.24, 5.25, 5.26, 5.27, 5.28, 5.29, 5.30, 5.31, 5.32, 5.33, 5.34, 5.35, 5.36,
6.19 6.20 6.21 6.22 6.23 6.24 6.25 6.26 6.27 6.28 6.29 6.30 6.31 6.32 6.33 6.34 6.35 6.36
Illuminant
Observer
Measurement Interval
D65 D65 D75 D75 D75 D75 F2 F2 F2 F2 F7 F7 F7 F7 F11 F11 F11 F11
1964 1964 1931 1931 1964 1964 1931 1931 1964 1964 1931 1931 1964 1964 1931 1931 1964 1964
10 nm 20 10 20 10 20 10 20 10 20 10 20 10 20 10 20 10 20
The tables of Tables 5 have been prepared for use with spectral measurement data that have previously been corrected for spectral bandpass dependence. The tables of Tables 6 have been prepared to apply a correction for spectral bandpass dependence built into the calculation of the tristimulus values. Accordingly, users should determine the status of their spectral data and select from Tables 5 or Tables 6 for data previously corrected, or not corrected, respectively, for bandpass dependence. The tables presented here were calculated from the data on CIE Standard D 001 (see 2.3) and have been reproduced here photographically to avoid any possible transcription errors. Tables 5.1 through Tables 6.36 are indexed by illuminant, observer, and measurement interval in the accompanying Index Table.
13
E 308 – 01
14
E 308 – 01
15
E 308 – 01
16
E 308 – 01
17
E 308 – 01
18
E 308 – 01
19
E 308 – 01
20
E 308 – 01
21
E 308 – 01
22
E 308 – 01
23
E 308 – 01
24
E 308 – 01
25
E 308 – 01
26
E 308 – 01
27
E 308 – 01
28
E 308 – 01
29
E 308 – 01
30
E 308 – 01
31
E 308 – 01
ASTM International takes no position respecting the validity of any patent rights asserted in connection with any item mentioned in this standard. Users of this standard are expressly advised that determination of the validity of any such patent rights, and the risk of infringement of such rights, are entirely their own responsibility. This standard is subject to revision at any time by the responsible technical committee and must be reviewed every five years and if not revised, either reapproved or withdrawn. Your comments are invited either for revision of this standard or for additional standards and should be addressed to ASTM International Headquarters. Your comments will receive careful consideration at a meeting of the responsible technical committee, which you may attend. If you feel that your comments have not received a fair hearing you should make your views known to the ASTM Committee on Standards, at the address shown below. This standard is copyrighted by ASTM International, 100 Barr Harbor Drive, PO Box C700, West Conshohocken, PA 19428-2959, United States. Individual reprints (single or multiple copies) of this standard may be obtained by contacting ASTM at the above address or at 610-832-9585 (phone), 610-832-9555 (fax), or
[email protected] (e-mail); or through the ASTM website (www.astm.org).
32