AbstractâThis paper considers the problem of efficiently maintaining a clustering of a dynamic set of data points that move continuously in two-dimensional ...
1
Continuous Clustering of Moving Objects Christian S. Jensen, Dan Lin, Beng Chin Ooi
Abstract— This paper considers the problem of efficiently maintaining a clustering of a dynamic set of data points that move continuously in two-dimensional Euclidean space. This problem has received little attention and introduces new challenges to clustering. The paper proposes a new scheme that is capable of incrementally clustering moving objects. This proposal employs a notion of object dissimilarity that considers object movement across a period of time, and it employs clustering features that can be maintained efficiently in incremental fashion. In the proposed scheme, a quality measure for incremental clusters is used for identifying clusters that are not compact enough after certain insertions and deletions. An extensive experimental study shows that the new scheme performs significantly faster than traditional ones that frequently rebuild clusters. The study also shows that the new scheme is effective in preserving the quality of moving-object clusters. Index Terms— Spatial databases, Temporal databases, Clustering
I. I NTRODUCTION In abstract terms, clustering denotes the grouping of a set of data items so that similar data items are in the same groups and different data items are placed in distinct groups. Clustering thus constitutes fundamental data analysis functionality that provides a summary of data distribution patterns and correlations in a dataset. Clustering is finding application in diverse areas such as image processing, data compression, pattern recognition, and market research, and many specific clustering techniques have been proposed for static datasets (e.g., [17], [28]). With the increasing diffusion of wireless devices such as PDAs and mobile phones and the availability of geo-positioning, e.g., GPS, a variety of location-based services are emerging. Many such services may exploit knowledge of object movement for purposes such as targeted sales, system load-balancing, and traffic congestion prediction [3]. The needs for analyses of the movements of a population of objects have also been fueled by natural phenomena such as cloud movement and animal migration. However, in spite of extensive research having been conducted on clustering and on moving objects (e.g., [12], [15], [20], [21], [24]), little attention has been devoted to the clustering of moving objects. A straightforward approach to the clustering of a large set of continuously moving objects is to do so periodically. However, if the period is short, this approach is overly expensive, mainly because the effort expended on previous clustering are not leveraged. If the period is long, long durations of time exist with no clustering information available. Moreover, this brute-force approach effectively treats the objects as static object and does not take into account the information about their movement. For example, this has the implication that it is impossible to detect that some groups of data are moving together. Rather, clustering of continuously moving objects should take into account not just the objects’ current positions, but also their anticipated movements. As we shall see, doing so enables us to
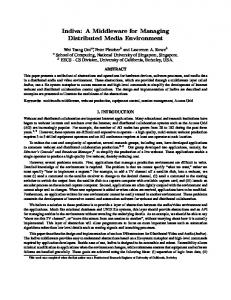
Fig. 1.
Clustering of Moving Objects
capture each clustering change as it occurs during the continuous motion process, thus providing better insight into the clustering of datasets of continuously moving objects. Figure 1 illustrates the clustering effect that we aim for. Connected black and the white points denote object positions at the current time and a near-future time. Our approach attempts to identify clusters at the current time, as given by solid ellipses, and to detect cluster splits and merges at future times, as represented by shaded ellipses. As has been observed in the literature, two alternatives exist when developing a new incremental clustering scheme [18]. One is to develop an entirely new, specialized scheme for the new problem of moving objects. The other is to utilize the framework provided by a standard clustering algorithm, but to develop new summary data structures for the specific problem being addressed that may be maintained efficiently in incremental fashion and that may be integrated into such a framework. We adopt this second alternative, as we believe that this is more flexible and generic. In particular, the new summary data structures may then be used together with a broad range of existing standard clustering algorithms. In addition, the summary data structures can be used for other data mining tasks such as computing approximate statistics of datasets. We consequently propose a new summary data structure, termed a clustering feature, for each moving object cluster, which is able to reflect key properties of a moving cluster and can be maintained incrementally. Based on these clustering features, we modify the Birch algorithm [28] to enable moving object clustering. As suggested, our scheme can also be applied to other incremental clustering algorithms based on cluster centers. We summarize our contributions as follows. We employ a notion of object dissimilarity that considers object movement across a period of time. We develop clustering features that can be maintained incrementally in efficient fashion. In our scheme, a quality measure for incremental clusters is proposed to identify clusters that are not compact enough after certain insertions and deletions. In other words, we are able to predict when clusters are to be split, thus avoiding the handling of the large
2
amounts of events akin to the bounding-box violations of other methods [16]. An extensive experimental study shows that the proposed scheme performs significantly faster than traditional schemes that frequently rebuild clusters. The results also show that the new scheme is effective in preserving the quality of clusters of moving objects. To the best of our knowledge, this is the first disk-based clustering method for moving objects. The organization of the paper is as follows. Section II reviews related work. Section III presents our clustering scheme. Section IV covers analytical studies, and Section V reports on empirical performance studies. Finally, Section VI concludes the paper. II. R ELATED W ORK Many clustering techniques have been proposed for static data sets [1], [2], [7], [10], [14], [17], [18], [19], [25], [28]. A comprehensive survey is given elsewhere [11]. The K-means algorithm [17] and the Birch algorithm [28] are representatives of non-hierarchical and hierarchical methods, respectively. The goal of the K-means algorithm is to divide the objects into K clusters such that some metric relative to the centroids of the clusters is minimized. The Birch algorithm, which is proposed to incrementally cluster static objects, introduces the notion of a clustering feature and a height-balanced clustering feature tree. Our approach extends these concepts. A key difference is that while in Birch, summary information of static data does not need to be changed unless an object is inserted, in our approach, the summary information itself must be dynamic and must evolve with time due to continuous object movement. Another interesting clustering algorithm is due to Yiu and Mamoulis [26], who define and solve the problem of object clustering according to network distance. In their assumed setting, where objects are constrained to a spatial network, network distance is more realistic than the widely used Euclidean distance for the measurement of similarity between objects. In spite of extensive work on the static databases, only few approaches exist for moving-object clustering. We proceed to review each of these. Early work by Har-Peled [9] aims to show that moving objects can be clustered once so that the resulting clusters are competitive at any future time during the motion. However, in twodimensional space, the static clusters obtained from this method may have about 8 times larger radii than the radii obtained by the optimal clustering, and the numbers of clusters are also much larger (at least 15 times) than for the usual clustering. Further, this proposal does not take into account I/O efficiency. Zhang and Lin [27] propose a histogram technique based on the clustering paradigm. In particular, using a “distance” function that combines both position and velocity differences, they employ the K-center clustering algorithm [6] for histogram construction. However, histogram maintenance lacks in efficiency—as stated in the paper, a histogram must be reconstructed if too many updates occur. Since there are usually a large amount of updates at each timestamp in moving object databases, the histogram reconstruction will occur frequently and thus this approach may not be feasible. Li et al. [16] apply micro-clustering [28] to moving objects, thus obtaining algorithms that dynamically maintain bounding boxes of clusters. However, the numbers of maintenance events involved dominates the overall running times of the algorithms,
and the numbers of such events are usually prohibitively large. Given a moving micro-cluster that contains n objects, the objects at each edge of the bounding box can change up to O(n) times during the motion, and each change corresponds to an event. Kalnis et al. [13] study historical trajectories of moving objects, proposing algorithms that discover moving clusters. A moving cluster is a sequence of spatial clusters that appear in consecutive snapshots of the object movements, so that consecutive spatial clusters share a large number of common objects. Such moving clusters can be identified by comparing clusters at consecutive snapshots; however, the comparison cost can be very high. More recently, Spiliopoulou et al. [22] propose a framework MONIC which models and traces cluster transitions. Specifically, they first cluster data at multiple timestamps by using the bisecting K-means algorithm, and then detect the changes of clusters at different timestamps. Unlike the above two works, which analyze the relations between clusters after the clusters are obtained, our proposal aims to predict the possible cluster evolution to guide the clustering. Finally, we note that clustering of moving objects involves future-position modeling. In addition to the linear function model, which is used in most work, a recent proposal considers nonlinear object movement [23]. The idea is to derive a recursive motion function that predicts the future positions of a moving object based on the positions in the recent past. However, this approach is much more complex than the widely adopted linear model and complicates the analysis of several interesting spatiotemporal problems. Thus, we use the linear model. We also note that we have been unable to find work on clustering in the literature devoted to kinetic data structures (e.g., [4]). III. M OVING -O BJECT C LUSTERING This section first describes the representation of moving objects, then proposes a scheme to cluster moving objects, called Moving-Object Clustering (MC for short). A. Modeling of Moving Objects We assume a population of moving objects, where each object is capable of transmitting its current location and velocity to a central server. An object transmits new movement information to the server when the deviation between its current, actual location and its current, server-side location exceeds a specified threshold, dictated by the services to be supported. The deviation between the actual location and the location assumed by the server tends to increase as time progresses. In keeping with this, we define the maximum update time (U ) as a problem parameter that denotes the maximum time duration in-between any two updates to any object. Parameter U can be built into the system to require that each object must issue at least one update every U time units. This is rational due to the concern that if an object did not communicate with the server for a long time, it is hard to know whether this object keeps moving in the same way or disappears accidentally without being able to notify the server. Each moving object has a unique ID, and we model its point position in two-dimensional Euclidean space as a linear function of time. Specifically, an object with ID OID can be represented by a four-tuple (OID, x¯ u , v¯ , tu ), where x¯ u is the position of the object at time tu and v¯ is the velocity of the object at that time.
3
Then the (server-side) position of this object at time t can be computed as x¯ (t) = x¯ u + v¯ (t − tu ), where t ≥ tu . B. Object Movement Dissimilarity We aim to cluster objects with similar movements, taking into account both their initial position and velocity. In particular, we use weighted object positions at a series of time points to define object dissimilarity. The computation of dissimilarity proceeds in three steps. We first select m, m ≥ 1, sample timestamps t1 , ..., tm , each of which is associated with a weight wi . Their properties are described as follows, where tnow denotes the current time: ∀i (ti < ti+1 ∧ tnow ≤ ti ≤ tnow + U ∧ wi ≥ wi+1 )
We thus only consider trajectories of moving objects within a period of duration U after the current time, and sample points are given higher weight the closer they are to the current time. This allows modeling of predicted positions that become less accurate as time passes. The details of the selection of weight values follow in Section IV. In the second step, object positions are computed at the chosen timestamps according to their movement functions. Given an object O, its positions at times t1 , ..., tm are x¯ (1) , ..., x¯ (m) . The (i) (i) Euclidean distance (ED) between a pair of positions x¯ 1 and x¯ 2 (i) (i) of two objects O x1 , x ¯2 ) = q1 and O2 at time ti is given by ED(¯ (i) (i) ¯ 2 | = (xi11 − xi21 )2 + (xi12 − xi22 )2 , where xijk is the |¯ x1 − x kth dimensional position value of object Oj at time ti . Third, we define the dissimilarity function between O1 and O2 : M (O1 , O2 ) =
m X
i=1
(i)
(i)
wi · ED2 (¯ x1 , x ¯2 )
(1)
Note that when m = 1 and w1 = 1, the function reduces to the (squared) Euclidean distance. We extend the function to apply to an object and a cluster C that consists of N objects and has center Oc : M (O, C) =
m N X (i) wi · ED2 (¯ x (i) , x ¯c ) N +1
(2)
i=1
The center Oc of a cluster is defined formally in the following section.
CF ′ = (N, CX + CV (tnow − t), CX 2 + 2CXV (tnow − t) + CV 2 (tnow − t)2 , CV , CV 2 , CXV + CV 2 (tnow − t), tnow ).
Proof: The number of moving objects N , the sum of the velocities CV , and the sum of the squared velocities CV 2 remain the same when there are no updates. The three components that involve positions need to be updated to the current time according to the ′ moving function. For example, CX will be updated to CX as follows. ′ P CX = N x ¯ (tnow ) Pi=1 i = N (¯ x i (t) + v¯ i (tnow − t)) i=1 P P = N ¯ i (t) + (tnow − t) N i=1 x i=1 v¯i = CX + CV (tnow − t)
The other two components are derived similarly.
2
Claim 2: Assume that an object given by (OID, x¯ ,¯ v , t) is inserted into or deleted from a cluster with clustering feature CF = (N, CX, CX 2 , CV , CV 2 , CXV , t). The resulting clustering feature CF ′ is computed as: CF ′ = (N ± 1, CX ± x¯ , CX 2 ± x¯ 2 , CV ± v¯ , CV 2 ± v¯ 2 , CXV ± x ¯ v¯ , t). Proof: Omitted.
2
Definition 2: Given a cluster C , its (virtual, moving) center object Oc is (OID, CX/N , CV /N , t), where the OID is generated by the system. This center object represents the moving trend of the cluster. Definition 3: The average radius R(t) of a cluster is the timevarying average distance between the member objects and the center object. We term R(t) the average-radius function. v u N u1 X ED2 (¯ x i (t), x ¯ c (t)) R(t) = t N i=1
This function enables us to measure the compactness of a cluster, which then allows us to determine when a cluster should be split. More importantly, we can efficiently compute the time when a cluster needs to be split without tracking the variation of the bounding box of the cluster.
C. Clustering Feature
Claim 3: The average-radius function R(t2 ) can be expressed as a function of time, R(∆t), and can be computed based on the clustering feature given at time t1 (t1 ≤ t2 ).
We proceed to define the clustering feature for moving objects, which is a compact, incrementally maintainable data structure that summarizes a cluster and that can be used for computing the average radius of a cluster.
Proof: Let the clustering feature be given as of time t1 and assume that we want to compute R(t2 ) for a later time t2 . We first substitute the time variation ∆t = t2 − t1 for every occurrence of t2 − t1 in function R(t2 ).
Definition 1: The clustering feature (CF) of a cluster is of the form (N , CX , CX 2 , CV , CV 2 , CXV , t), where N is the number PN of moving objects in the cluster, CX = ¯ i (t), CX 2 = i=1 x PN P P N N 2 2 ¯ i (t), CV = ¯ i (t), CV = ¯ 2i (t), CXV = i=1 x i=1 v i=1 v PN (¯ x (t)¯ v (t)) , and t is the update time of the feature. i i i=1 A clustering feature can be maintained incrementally under the passage of time and updates.
Claim 1: Let tnow be the current time and CF = (N , CX , CX 2 , CV , CV 2 , CXV , t), where t < tnow , be a clustering feature. Then CF at time t can be updated to CF ′ at time tnow as follows:
P ED2 (¯ x i (t), x ¯ c (t)) = N (¯ x (t ) − x ¯ c (t2 ))2 PNi=1 2i 2 x i (t2 ) − 2¯ = i=1 (¯ x i (t2 )¯ x c (t2 ) + x ¯ 2c (t2 )) PN 2 = i=1 ((¯ x i + v¯ i ∆t) − 2(¯ x i + v¯ i ∆t)(¯ x c + v¯ c ∆t) + (¯ x c + v¯ c ∆t)2 )
Then we represent function R(t2 ) as a function of ∆t: p R(∆t) = (A∆t2 + B∆t + C)/N where N N X X A= v¯ 2i − 2¯ vc v¯ i + N v¯ 2c i=1 N X
B = 2(
i=1
i=1
(¯ x i v¯ i ) − v¯ c
N X
i=1
x ¯i − x ¯c
N X
i=1
v¯ i + N x ¯ c v¯ c )
4
C=
N X
i=1
x ¯ 2i − 2¯ xc
N X
Insert (O) Input: O is an object to be inserted
x ¯i + N x ¯ 2c
i=1
Subsequently, the coefficients of function ∆t can be expressed in terms of the clustering feature. A = CV 2 − (CV )2 /N B = 2(CXV − CXCV /N ) C = CX 2 − (CX)2 /N
2
D. Clustering Scheme We are now ready to present our clustering scheme, which employs the proposed dissimilarity function and clustering feature, thus enabling many traditional incremental clustering algorithms based on cluster centers, to handle moving objects. Our scheme utilizes the framework provided by the Birch clustering algorithm, which, however, requires several modifications and extensions: (i) concerning the data structure, we introduce two auxiliary data structures in addition to the hierarchical data structure; (ii) we propose algorithms for the maintenance of the new clustering feature under insertion and deletion operations; (iii) for the split and merge operations, we propose algorithms that quantify the cluster quality and compute the split time. 1) Data Structures: The clustering algorithm uses a disk-based data structure that consists of directory nodes and cluster nodes. The directory nodes store summary information for the clusters. Each node contains entries of the form hCF , CP i, where CF is the clustering feature and CP is a pointer to either a cluster node or the next directory node. The structure allows the clusters to be organized hierarchically according to the center objects of the clusters, and hence is scalable with respect to data size. The directory node size is one disk page. Each cluster node stores the data objects, each represented as (OID, x ¯ , v¯ , t), according to the cluster they belong to. Unlike the directory node, each cluster node may consist of multiple disk pages. The maximum capacity of a cluster is an application dependent parameter, which can be given by users. By using the concept of maximum cluster capacity, we guarantee that the clustering performance is stable, i.e., the maintenance cost for each cluster is similar. it should be noted that the maximum cluster capacity is only associated with the leaf cluster nodes. The nodes at higher levels correspond to bigger clusters and can also be returned to the users according to their requests. In addition to this clustering feature structure, two auxiliary structures, an event queue and a hash table, are also employed. The event queue stores future split events htsplit , CIDi in ascending order of tsplit , where tsplit denotes the split time and CID is the cluster identifier. The hash table maps object IDs to cluster IDs, i.e., OID s to CID s, so that given the ID of an object, we can efficiently locate the cluster that this object belongs to. These two structures store much less data than the whole dataset (the event queue and the hash table are only 1% and 10% of the whole data set size, respectively), and hence they can be either cached in main memory or stored contiguously on disk for efficient scanning and loading into main memory. 2) Insertion and Deletion: We proceed to present the algorithms that maintain a clustering under insertions and deletions. The outline of the insertion algorithm is given in Figure 2. To insert an object O given by (OID, x¯ , v¯ , tu ), we first find the center object of some cluster C that is nearest to the object according to M . A global partition threshold ρg is introduced
1. 2. 3. 4. 5. 6. 7. 8. 9. 10. 11. 12. 13. 14. 15. 16. 17. end
find the nearest center object Oc of O // Oc belongs to cluster CID if M (Oc , O) > ρg then create a new cluster for O else ts ← SplitTime(CID, O) if ts is not equal to the current time and cluster CID is not full then insert O into cluster CID adjust the clustering feature of cluster CID if ts > 0 then insert event (ts , CID) into the event queue insert O to the hash table else split(CID, O, newCID) if CanMerge(CID, CID1 ) then merge(CID, CID1 ) if CanMerge(newCID, CID2 ) then merge(newCID, CID2 ) Insert.
Fig. 2.
Insertion Algorithm
that controls the clustering. Threshold ρg gives the possible maximum M distance between two objects belonging to two closest neighboring clusters. To estimate ρg , we first need to know the average size of a cluster Sc . Without any prior knowledge, Sc is computed as Sc = Area/(N/f ) based on a uniform distribution (Area is the area of the domain space, N is the total number of objects, and f is the cluster capacity). If the data distribution is known, Area can be computed as the area of the region covered by most objects. √ 2 Pm We can now define ρg = i=1 wi · (2 Sc ) . The idea underlying this definition is that if the distance between two objects is always twice as large as the average cluster diameter during the considered time period, these two objects most possibly belong to two different clusters. By using ρg , we can roughly partition the space, which saves computation cost. If the distance between object O and cluster C exceeds ρg , we create a new cluster for object O directly. Otherwise, we check whether cluster C needs to be split after absorbing object O. If no split is needed, we insert object O into cluster C and then execute the following adjustments. • Update the clustering feature of C to the current time, according to Claim 1; then update it to cover the new object, according to Claim 2. • Calculate the split time, if any, of the new cluster and insert the event into the event queue. Details to do with splits are addressed in the next section. • Update the object information in the hash table. If cluster C is to be split after the insertion of object O, we check whether the two resultant clusters (CID and newCID ) can be merged with other clusters. The function CanMerge may return a candidate cluster for merge operation. Specifically, an invocation of function CanMerge with arguments CID and CID ′ , looks for a cluster that it is appropriate to merge cluster CID with, and if such a cluster is found, it is returned as CID ′ . The merge policy will be explained in Section III-D.3. Next, to delete an object O, we use the hash table to locate the cluster C that object O belongs to. Then we remove object O
5
R2
Delete (O) Input: O is an object to be deleted
R2
CID = Hash(O) // object O belongs to cluster CID 2. delete O from the hash table 3. delete O from cluster CID 4. adjust the clustering feature of cluster CID 5. if cluster CID is in underflow 6. if CanMerge(CID, CID ′ ) 7. then merge(CID, CID ′ ) 8. else 9. delete old event of cluster CID from the event queue 10. insert new event of cluster CID into the event queue end Delete. 1.
Fig. 3.
Deletion Algorithm
x
x
∆t
O3
O4 O3 O2 O1
O2 O1
time
time
Average Radius Examples
Our task is to determine the time, if any, in-between the current time and the maximum update time when the cluster must be split, i.e., ∆t ranges from 0 to U . Given the split threshold ρs , three
ρ2s ∆t
∆t
time
ρ2s
time
R2
ρ2s
ts
ρ2s
time
R2
2
R ∆t
∆t
∆t
time
time
ts
time
Squared Average Radius Evolution
kinds of relationships between R2 (∆t) and ρ2s are possible—see Figure 5. In the first, leftmost two cases, radius R2 remains below threshold ρ2s , implying that no split is caused. In the second, middle two cases, radius R2 (0) exceeds threshold ρ2s , which means that the insertion of a new object into cluster CID will make the new radius larger than the split threshold and thus cause an immediate split. In the last two cases, radius R2 exceeds threshold ρ2s at time ts , causing an event hts , CIDi to be placed in the event queue. The next step is to identify each of the three situations by means of function R2 (∆t) itself. We first compute R2 (0). If this value exceeds ρ2s , we are in the second case. Otherwise, R2 (U ) is computed. If this value is smaller than ρ2s , we are in the first case. If not, we are in the third case, and we need to solve the equation (A∆t2 + B∆t + C)/N =p ρ2s , where the split time ts is the larger solution, i.e., ts = (−B+ B 2 − 4A(C − ρ2s N ))/(2A). Note that when the coefficient of ∆t2 equals 0, function R2 (∆t) degenerates to a linear function and ts = (ρ2s N − C)/B . Figure 6 summarizes the algorithm. At the time of a split, the split starts by identifying the pair of objects with the largest M value. Then, we use these objects as seeds, redistributing the remaining objects among them, again based on their mutual M values. Objects are thus assigned to the cluster that they are most similar to. We use this splitting procedure mainly because it is very fast and running time is an important concern in moving object environments. The details of
SplitTime (CID, O) Input: Cluster CID and object O Output: The time to split the cluster CID with O get function R(t) from the cluster CID and O if R2 (0) > ρ2s then return current time // need to split at the current time 4. else 5. if R2 (U ) ≤ ρ2s then 6. return −1 // no need to split during U 7. else 8. compute the split time ts by R2 (ts ) = ρ2s 9. return ts // return the future split time end SplitTime. 1. 2. 3.
O4
R2
ρ2s 2
Fig. 5.
from the hash table and cluster C , and we adjust the clustering feature. Specifically, we first update the feature to the current time according to Claim 1 and then modify it according to Claim 2. If cluster C does not underflow after the deletion, we further check whether the split event of C has been affected and adjust the event queue accordingly. Otherwise, we apply the merge policy to determine whether this cluster C can be merged with other clusters (denoted as CID′ ). The deletion algorithm is outlined in Figure 3. 3) Split and Merge of Clusters: Two situations exist where a cluster must be split. The first occurs when the number of objects in the cluster exceeds a user-specified threshold (i.e., the maximum cluster capacity). This situation is detected automatically by the insertion algorithm covered already. The second occurs when the average radius of the cluster exceeds a threshold, which means that the cluster is not compact enough. Here, the threshold (denoted as ρs ) can be defined by the users if they want to limit the cluster size. It can also be estimated √ as the average radius of clusters given by the equation ρs = 14 Sc . We proceed to address the operations in the second situation in some detail. Recall that the average radius of a cluster is given as a function of time R(∆t) (cf. Section III-C). Since R(∆t) is a square root, for simplicity, we consider R2 (∆t) in the following computation. Generally, R2 (∆t) is a quadratic function. It degenerates to a linear function when all the objects have the same velocities. Moreover, R2 (∆t) is either a parabola opening upwards or an increasing line—the radius of a cluster will never first increase and then decrease when there are no updates. Figure 4 shows the only two cases possible for the evolution of the average radius when no updates occur, where the shaded area corresponds to the region covered by the cluster as time passes.
Fig. 4.
ρ2s
Fig. 6.
Split Time Algorithm
6
Split (CID1 , O, CID2 ) Input: Cluster CID1 and object O Output: New cluster with ID CID2 1. 2. 3. 4. 5. 6. 7. 8. 9. 10. 11. 12. 13. 14. 15. end
pick the farthest pair of objects (seed 1 , seed 2 ) from cluster CID1 and O based on M initialize cluster CID2 insert seed 2 into cluster CID2 delete seed 2 from cluster CID1 for each remaining object Or in CID1 do Dm1 ← M (Or , seed 1 ) Dm2 ← M (Or , seed 2 ) if Dm1 > Dm2 then insert Or into cluster CID2 modify the hash table if Or belongs to cluster CID1 then delete Or from cluster CID1 adjust the clustering feature of cluster CID1 compute the clustering feature of cluster CID2 return CID2 Split.
Fig. 7.
Split Algorithm
the algorithm are shown in Figure 7. We first pick up the farthest pair of objects seed 1 and seed 2 (line 1), which will be stored in cluster CID1 and CID2 respectively. For each remaining object Or in cluster CID1 , we compute its distances to seed 1 and seed 2 using M (lines 6–7). If Or is close to seed 1 , it will remain in cluster CID1 . Otherwise, Or will be stored in cluster CID2 . After all the objects have been considered, we compute the clustering features of both clusters (lines 11–12). After a split, we check whether each cluster C among the two new clusters can be merged with preexisting clusters (see Figure 8). To do this, we compute the M -distances between the center object of cluster C and the center object of each preexisting cluster. We consider the k nearest clusters that may accommodate cluster C in terms of numbers of objects. For each such candidate, we execute a “virtual merge” that computes the clustering feature assuming absorption of C . This allows us to identify clusters where the new average radius is within threshold ρg . Among
CanMerge(CID 1 , CID 2 ) Input: Cluster CID 1 , waiting for a merge operation Output: Cluster CID 2 , a candidate for a merge operation 1. 2. 3. 4. 5. 6. 7. 8. 9. 10. 11. 12. 13. end
for each cluster CID x except CID 1 do if cluster CID x has enough space to absorb cluster CID 1 then Dm ← M (Ox , O1 ) // Ox is the center object of cluster CID x // O1 is the center object of cluster CID 1 update list Lc that records the k nearest clusters for each cluster CID 2 in Lc do CF ← CF (CID 2 ) + CF (CID 1 ) compute possible split time ts from CF if ts < 0 then // no need to split return CID 2 else record CID 2 with the largest ts return CID 2 CanMerge.
Fig. 8.
Identifying Clusters to be Merged
Merge(CID 1 , CID 2 ) Input: Cluster CID 1 and CID 2 to be merged 1. 2. 3. 4. 5. 6. 7. 8. 9. 10. end
CF 1 ← CF (CID 1 ) at the current time CF 2 ← CF (CID 2 ) at the current time CF 1 ← CF 1 + CF 2 for each object O in cluster CID 2 do store O in cluster CID 1 update the hash table delete cluster CID 2 delete split event of cluster CID 2 from event queue compute split time ts of new cluster CID 1 modify split event of cluster CID 1 in event queue Merge.
Fig. 9.
Merge Algorithm
these, we choose a cluster that will lead to no split during the maximum update time, if one exist; otherwise, we choose the one that will yield the latest split time. Finally, we execute the real merge: we update the clustering feature, the hash table, and the event queue. The merge algorithm is shown in Figure 9. IV. A NALYSIS OF D ISSIMILARITY V ERSUS C LUSTERING In this section, we study the relationship between dissimilarity measure M and the average radius of the clusters produced by our scheme. To facilitate the analysis, we initially assume that no updates occur to the dataset. This enables us to set the weights used in M to 1—decreasing weights are used to make later positions, which may be updated before they are reached, less important. Also to facilitate the analysis, we replace the sum of sample positions in M with the corresponding integral, denoted as M ′ , from the time when a clustering is performed and U time units into the future. Note that M ′ is the boundary case of M that is similar to the integrals used in R-tree based moving object indexing [21]. The next theorem states that inclusion of an object into the cluster with a smaller M ′ value leads to a tighter and thus better clustering during time interval U . Theorem 1: Let O = (OID, x, v, tu ) denote an object to be inserted at time tu ; Ci , i = 1, 2, denote two existing clusters with Ni objects, center objects Oci = (OID ci , xci , v ci , tu ), and average radii Ri at time tu . Let Ri,O be the average radius of Ci after absorbing object O. If M ′ (O, C1 ) < M ′ (O, C2 ) then the average squared distance between objects and cluster centers after inserting O to cluster C1 is less than that after inserting O to cluster C2 : Z
U 0
2 (N1 + 1)R1,O + N2 R22
N1 + N 2 + 1
dt
wj+1 , 1 ≤ j ≤ k − 1; (ii) equal weights: wj = wj+1 , 1 ≤ j ≤ k − 1. From now on, we use the total radius (i.e., the product of the average radius and the number of clusters) as the clustering effect measurement since the numbers of clusters are different for the different weight values. Figure 18 shows the total radius of clusters generated by using these two types of weight values. It is not surprising that the one using decreasing weight values 18000 16000 14000 Total Radius
CPU Time (s)
0 4
12000 10000 8000 6000 Decreasing Weight
4000
Equal Weight
2000 0 0
6 12 18 24 30 36 42 48 54 60 Time Units
Fig. 18.
Clustering Effect with Different Types of Weight Values
yields better performance. As we mentioned before, the closer to the current time, the more important the positions of moving objects are because later positions have higher probabilities of being changed by updates. 3) Effect of Time Interval Length between Sample Points: Another parameter of the dissimilarity measurement is the time interval length between two consecutive sample positions. We vary the interval length and examine the performance of the MC algorithm as time progresses (see Figure 19(a)). As expected, we can see that the one with the shortest interval length has the smallest radius (i.e., best clustering effect). However, this does not mean that the shortest interval length is an optimal value
11
30000
8 7
25000
MC
20000
Update I/Os
Total Radius
6
15000 10000 Interval length 5 Interval length 20 Interval length 60
5000
5 4 3 2
Interval length 10 Interval length 30
1
0
0 0
6 12 18 24 30 36 42 48 54 60
10K
Time Units
30K
50K
70K
90K
Number of Moving Objects
(a) Clustering Effect Fig. 20.
Update I/O Cost
0.5 I/O cost
Total CPU Time (ms)
0.45
Computation cost
0.4
usually affects only one or two clusters. This suggests that the MC algorithm has very good update performance.
0.35 0.3 0.25
VI. C ONCLUSION
0.2 0.15 0.1 0.05 0 5
10
20
30
60
Interval Length
(b) Maintenance Time Fig. 19.
Effect of Different Interval Lengths
considering the overall performance of the MC algorithm. We need to consider the time efficiency with respect to the interval length. In addition, we also observe that the difference between the time intervals equal to 60 and 30 is much wider than the others. The possible reason is that when time interval is 60, there are only two sample points (start and end points of an object trajectory), which are not able to differentiate the two situations shown in Figure 4. Therefore, it is suggested to use no less than three sample points so that the middle point of a trajectory can be captured. Figure 19(b) shows the maintenance cost of the MC algorithm when varying the time interval length. Observe that the CPU time decreases with the increase of the time interval length, while the I/O cost (expressed in milliseconds) does not change much. This is because the longer time interval results in less sample positions, and hence less computation. In contrast, the I/O cost is mainly due to the split and merge events. When the time interval length increases, the dissimilarity measurement tends to be less tight, which results in less split and merge events. Considering the clustering effect and time efficiency together, the time interval length should not be larger than 30, as we need at least three sample points, and it should not be too small, as this will yield unnecessarily many computations. Therefore, we choose the number of sample points to be a little more than 3 as a tradeoff. In our experiments, the number of sample points is 6, corresponding to the time interval length 10. 4) Update I/O Cost: We now study the update I/O cost of the MC algorithm solely. We vary the dataset size from 10K to 100K and run the MC algorithm for the maximum update interval. Figure 20 records the average update cost. As we can see, the update cost is only 2 to 5 I/Os because each insertion or deletion
This paper proposes a fast and effective scheme for the continuous clustering of moving objects. We define a new and general notion of object dissimilarity, which is capable of taking future object movement and expected update frequency into account, with resulting improvements in clustering quality and running time performance. Next, we propose a dynamic summary data structure for clusters that is shown to enable frequent updates to the data without the need for global re-clustering. An average radius function is used that automatically detects cluster split events, which, in comparison to existing approaches, eliminates the need to maintain bounding boxes of clusters with large amounts of associated violation events. In future work, we aim to apply the clustering scheme in new applications. ACKNOWLEDGEMENT The work of Dan Lin and Beng Chin Ooi was in part funded by an A∗ STAR project on spatial-temporal databases. R EFERENCES [1] R. Agrawal, J. Gehrke, D. Gunopulos, and P. Raghavan. Automatic subspace clustering of high dimensional data for data mining application. In Proc. ACM SIGMOD, pp. 94–105, 1998. [2] M. Ankerst, M. Breunig, H.P. Kriegel, and J. Sander. OPTICS: Ordering points to identify the clustering structure. In Proc. ACM SIGMOD, pp. 49– 60, 1999. [3] Applied Generics. RoDIN24. www.appliedgenerics.com/downloads/ RoDIN24-Brochure.pdf, 2006. [4] J. Basch, L. J. Guibas, and J. Hershberger. Data structures for mobile data. Algorithms, 31(1): 1–28, 1999. [5] C. S. Jensen, D. Tiesyte, and N. Tradisauskas. The COST BenchmarkComparison and Evaluation of Spatio-temporal Indexes. Proc. DASFAA, pp. 125–140, 2006. [6] T. F. Gonzalez. Clustering to minimize the maximum intercluster distance. Theoretical Computer Science, 38: 293–306, 1985. [7] S. Guha, R. Rastogi, and K. Shim. CURE: An efficient clustering algorithm for large databases. In Proc. ACM SIGMOD, pp. 73–84, 1998. [8] M. Hadjieleftheriou, G. Kollios, D. Gunopulos, and V. J. Tsotras. Online discovery of dense areas in spatio-temporal databses. In Proc. SSTD, pp. 306–324, 2003. [9] S. Har-Peled. Clustering motion. Discrete and Computational Geometry, 31(4): 545–565, 2003. [10] V. S. Iyengar. On detecting space-time clusters. In Proc. KDD, pp. 587– 592, 2004. [11] A. K. Jain, M. N. Murty, and P. J. Flynn. Data clustering: A review. ACM Computing Surveys, 31(3):264–323, 1999.
12
[12] C. S. Jensen, D. Lin, and B. C. Ooi. Query and update efficient B+ -tree based indexing of moving objects. In Proc. VLDB, pp. 768–779, 2004. [13] P. Kalnis, N. Mamoulis, and S. Bakiras. On discovering moving clusters in spatio-temporal data. In Proc. SSTD, pp. 364–381, 2005. [14] G. Karypis, E.-H. Han, and V. Kumar. Chameleon: Hierarchical clustering algorithm using dynamic modeling. In IEEE Computer, 32(8):68–75, 1999. [15] D. Kwon, S. Lee, and S. Lee. Indexing the current positions of moving objects using the lazy update R-tree. In Proc. MDM, pp. 113–120, 2002. [16] Y. Li, J. Han, and J. Yang. Clustering moving objects. In Proc. KDD, pp. 617–622, 2004. [17] J. Macqueen. Some methods for classification and analysis of multivariate observations. In Proc. Berkeley Symp. Math. Statiss, pp. 281–297, 1967. [18] S. Nassar, J. Sander, and C. Cheng. Incremental and effective data summarization for dynamic hierarchical clustering. In Proc. ACM SIGMOD, pp. 467–478, 2004. [19] R. Ng and J. Han. Efficient and effective clustering method for spatial data mining. In Proc. VLDB, pp. 144–155, 1994. [20] J. M. Patel, Y. Chen, and V. P. Chakka. STRIPES: An efficient index for predicted trajectories. In Proc. ACM SIGMOD, pp. 637–646, 2004. ˇ [21] S. Saltenis, C. S.Jensen, S. T. Leutenegger, and M. A. Lopez. Indexing the positions of continuously moving objects. In Proc. ACM SIGMOD, pp. 331–342, 2000. [22] M. Spiliopoulou, I. Ntoutsi, Y. Theodoridis, and R. Schult. MONIC: modeling and monitoring cluster transitions. In Proc. KDD, pp. 706– 711, 2006. [23] Y. Tao, C. Faloutsos, D. Papadias, and B. Liu. Prediction and indexing of moving objects with unknown motion patterns. In Proc. ACM SIGMOD, pp. 611–622, 2004. [24] Y. Tao, D. Papadias, and J. Sun. The TPR*-tree: An optimized spatiotemporal access method for predictive queries. In Proc. VLDB, pp. 790– 801, 2003. [25] W. Wang, J. Yang, and R. Muntz. Sting: a statistical information grid approach to spatial data mining. In Proc. VLDB, pp. 186–195, 1997. [26] M. L. Yiu and N. Mamoulis. Clustering objects on a spatial network. In Proc. ACM SIGMOD, pp. 443–454, 2004. [27] Q. Zhang and X. Lin. Clustering moving objects for spatio-temporal selectivity estimation. In Proc. ADC, pp. 123–130, 2004. [28] T. Zhang, R. Ramakrishnan, and M. Livny. BIRCH: An efficient data clustering method for very large databases. In Proc. ACM SIGMOD, pp. 103–114, 1996.
Christian S. Jensen (Ph.D., Dr.Techn.) is a Professor of Computer Science at Aalborg University, Denmark, and an Adjunct Professor at Agder University College, Norway. His research concerns data management and spans issues of semantics, modeling, and performance. With his colleagues, he has published widely on these subjects. With his colleagues, he receives substantial national and international funding for his research. He is a member of the Danish Danish Academy of Technical Sciences, the EDBT Endowment, and the VLDB Endowment’s Board of Trustees. He received Ib Henriksen’s Research Award 2001 for his research in mainly temporal data management and Telenor’s Nordic Research Award 2002 for his research in mobile services. His service record includes the editorial boards of ACM TODS, IEEE TKDE and the IEEE Data Engineering Bulletin. He was the general chair of the 1995 International Workshop on Temporal Databases and a vice PC chair for ICDE 1998. He was PC chair or co-chair for the Workshop on Spatio-Temporal Database Management, held with VLDB 1999, for SSTD 2001, EDBT 2002, VLDB 2005, MobiDE 2006, and MDM 2007. He is a vice PC chair for ICDE 2008. He has served on more than 100 program committees. He serves on the boards of directors and advisors for a small number of companies, and he serves regularly as a consultant.
Dan Lin received the B.S. degree (First Class Honors) in Computer Science from Fudan University, China in 2002, and the Ph.D. degree in Computer Science from the National University of Singapore in 2007. Currently, She is a visiting scholar in the Department of Computer Science at Purdue University, USA. Her main research interests cover many areas in the fields of database systems and information security. Her current research includes geographical information systems, spatial-temporal databases, location privacy, and access control policies.
Beng Chin Ooi received the B.S. (First Class Honors) and Ph.D. degrees from Monash University, Australia in 1985 and 1989 respectively. He is currently a professor of computer science at the School of Computing, National University of Singapore. His current research interests include database performance issues, index techniques, XML, spatial databases and P2P/grid Computing. He has published more than 100 conference/journal papers and served as a PC member for a number of international conferences (including SIGMOD, VLDB, ICDE, EDBT and DASFAA). He is an editor of GeoInformatica, the Journal of GIS, ACM SIGMOD Disc, VLDB Journal and the IEEE TKDE. He is a member of the ACM and the IEEE.