Conceptual Framework for Discrete Event Simulation of Interstate Traffic. Bernard J. Schroer .... hourly flow rate is approximately 45 passenger cars per hour per ...
Conference Proceedings, Huntsville Simulation Conference, October 2009
Conceptual Framework for Discrete Event Simulation of Interstate Traffic Bernard J. Schroer, Gregory Harris and Michael Anderson University of Alabama in Huntsville Huntsville, AL USA Michael Spayd Garver LLC Huntsville, AL USA Dietmar P.F. Moeller University of Hamburg Hamburg, Germany
ABSTRACT This paper presents the development of a conceptual framework for simulating interstate traffic. ProcessModel was selected as the simulation package. The framework has been successfully used to model interstate I-65 from Montgomery to Birmingham, AL. The study corridor begins near the Alabama River Bridge north of downtown Montgomery at mile marker 172 and extends north to mile marker 234 near Alabaster and the southern Birmingham suburbs. The conceptual framework provided an excellent template in the rapid development of interstate traffic ProcessModel. The framework greatly reduced development time, model debugging and verification and validation. Using the conceptual framework it is possible to construct the model in pieces, or one segment at a time. Consequently, each segment can be debugged and verified separately thus reducing development time. A similar interstate traffic model using CORSIM has been developed and compared very favorably with the ProcessModel results. For basic planning applications of longer rural freeway corridors that do not have complex lane drops or significant merging issues, ProcessModel may be a useful tool to indicate when traffic congestion may occur in an existing or future condition. However, when detailed analysis is needed at a specific interchange or in urban areas where lane changing and ramp merging and weaving are more pronounced, CORSIM may be a better alternative. Included in this paper are a description of the modeling framework, description of the application implementation and conclusions. KEYWORDS Discrete event simulation, traffic, transportation, interstate
1 INTRODUCTION A number of difficulties exist for the successful development and implementation of traffic simulation models. The time to create, validate and verify a simulation project seems to be the most significant barrier to overcome. In many instances the data needed for a successful simulation do not exist. Or, on the other hand, the data are generally not readily available in a form that can be easily used. Even then the available data are not credible, incomplete or inaccurate. Most models often become too detailed and take considerably longer to develop than estimated, thus driving up delays and costs and infuriating management. Complex models are difficult to debug. In many instances model verification and validation (V&V) are minimized or more frequently just ignored. V&V generally takes more time than estimated or available. Trained simulation personnel or the ability to recruit the necessary personnel to assure a successful simulation is another difficulty. Many companies do not have such a simulationist on the payroll. The research focus of this paper is on developing a conceptual framework that reduces the impact of many of the previously stated difficulties. In addition, the framework has been successfully applied to a ProcessModel of interstate I-65 from Montgomery north to Birmingham, AL. 2 PREVIOUS RESEARCH The Alabama Transportation Infrastructure Model (ATIM) simulates the impact of changing freight patterns in order to more accurately plan for future transportation infrastructure development [5]. ATIM uses ProModel [4]
Conference Proceedings, Huntsville Simulation Conference, October 2009
interfaced with spreadsheets that are read as arrays. The transportation network is specified by the user and includes the amount of freight shipped via road, rail and water; the origin and destination locations of freight shipments; road, rail, and water traffic paths; road capacities such as number of lanes, speed limits. Other inputs are vehicle routing that determines the number of arrivals of trucks, barges, and trains and the route each vehicle takes from its origin to its destination point. ATIM output includes performance measures that are continually updated during the replication such as average traveling speed, congestion indicators, fuel utilization for the three freight modes, highway capacity utilization for user-specified zones and flow volumes. The second category of outputs is aggregate measures that are reported at the end of each replication: volume of traffic flow on roadways, average speed on roadways links, and the standard ProModel output reporting such as entities in the system, entities that exited the system and resource utilization.
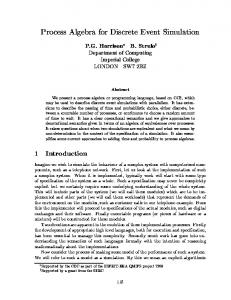
theories. CORSIM also incorporates the randomness that can occur within a network by including different types of drivers, vehicles and traffic system characteristics. Spayd have also compared the results of CORSIM with a similar model developed using the discrete event simulation package ProcessModel. 3 MODELING FRAMEWORK Figure 2 is a sketch of the conceptual framework for the interstate traffic model development. The framework consists of a number of roadway segments. Each segment has its own data input and entities with specific attributes. Data are shared between the segments by global variables. The content of global variables can be altered within any segment with the new values immediately shared and used by any other segment. These global variables not only pass data between the segments but can also be used in logic statements to control the movement and routing of entities, branching logic, and updating entity attributes.
Data
Figure 1 is a portion of the screen display showing the movement of entities over the road, water and rail networks in southern Alabama. ATIM development took over one man-year and excludes the time for data collection and V&V.
Roadway Segment 1 – n)
Data
Data
Data
Data
Entity attributes 1
2
3
4
n
Traffic
Continuous Continuous displayof of display resultsin in results labelboxes boxes label Global variables
Figure 2. Conceptual framework
Figure 1. Screen Shot of ATIM Simulation Animation Spayd, et.al [6] have developed an interstate traffic simulation using CORSIM [1]. CORSIM was originally developed by the Federal Highway Administration to analyze both freeway and arterial traffic flow conditions. CORSIM models traffic flow based on complex car following, gap acceptance and lane-changing
Figure 3 is a generic sketch of a typical segment of an interstate network. Cars and trucks can enter at the exit before the roadway segment and can leave at the exit after the roadway segment. There are also cars and trucks that do not exit and continue through the roadway segment. Each roadway segment can be joined together to simulate a stretch of interstate.
Conference Proceedings, Huntsville Simulation Conference, October 2009
Cars Entering at Exit
Cars Leaving at Next Exit
Interstate Segment i Cars Continuing Trucks Continuing
Cars Continuing Trucks Continuing
Trucks Entering at Exit Trucks Leaving at Next Exit Car
Truck
Figure 3. Typical roadway segment Global variables for each segment are traffic, capacity, speed and travel time. The entity attribute is vehicle and defined as either a car or truck. In order to develop a simulation that replicates traffic conditions in ProcessModel, the global variables based on traffic engineering parameters were developed. The traffic global variable served as a proxy for the traffic density (number of vehicles per mile) in each freeway segment. As passenger cars and trucks enter each segment, the traffic global variable is incremented (by one space for a passenger car or 2.5 spaces for a truck) until the capacity of the segment spaces is met. The capacity variable was based on generalized traffic engineering relationships for speeddensity-flow listed in the Highway Capacity Manual [2]. These relationships are simplified and vary by location. The maximum hourly volume on a freeway does not occur at maximum density, but rather at a density in which vehicles can travel at a faster speed with acceptable following distances. The critical density that produces a maximum hourly flow rate is approximately 45 passenger cars per hour per lane [2]. Likewise the speed variable was constructed to move vehicles through each interstate segment as a function of the segment’s density. The free-flow speed (70 mph) of a freeway occurs at low densities; however the maximum flow occurs at a lesser speed. The critical speed that produces a maximum hourly flow rate occurs at approximately 50
miles per hour [2]. Thus the speed variable was constructed within ProcessModel to range linearly between free-flow speed (70 mph) at low densities and critical speed (50 mph) at maximum density. 4 MODEL VERIFICATION AND VALIDATION Model verification can be defined as determining if the model is correctly represented in the simulation code. Model validation is determining if the model is an accurate representation of the real world system. To assist in the verification and validation the conceptual framework includes a set of ProcessModel Label blocks that display current values from the global variables (such at traffic and capacity of each segment) during the running of the simulation. These values are generally overlaid on top of the simulation model so the user can observe the movement of entities as well as any bottlenecks. 5 MODELING SYSTEM ProcessModel [3] was selected for the simulation package. ProcessModel has a set of building blocks that closely match the conceptual framework. These building blocks are entities, activities, labels, resources and storages. Entities are items (such as cars and trucks) or people being processed. Activities are task performed on activities (such as driving on roadway segment). Labels are used to display contents of global variables during simulation run. Resources are agents used to perform activities and move entities (not used in traffic model). Storages are stock spaces where entities wait for further processing (not used in traffic model). Figure 4 gives the ProcessModel for a typical roadway segment. A roadway segment is defined as the distance between two interstate exits. Cars and trucks arrive from a previous segment. Also cars and trucks arrive, or enter, at the beginning of the roadway segment. Vehicles spend time at activity Segment i which is equivalent to traveling the length of roadway for the segment. The activities D1i, D2i, D3i and D4i are only used for routing vehicles. No time elapses at these activities. At activity D1i two conditional tests are made. If the entity attribute Vehicle = Car then the vehicle entity goes to D2i. If the entity attribute Vehicle = Truck then the vehicle entity goes to D3i. The logic at activity D2i routes a percentage of the cars to activity D4i which is the exit at the end of the
Conference Proceedings, Huntsville Simulation Conference, October 2009
roadway segment while the remaining percentage of cars continue on the interstate to activity Segment i+1. Likewise, the logic at activity D3i routes a percentage of the trucks to activity D4i that is the exit while the remaining percentage of trucks continue on the interstate to Segment i+1. Two ProcessModel label blocks are used for each segment to continually display the contents of two global variables: traffic in Segment i and capacity of Segment i. The capacity (maximum spaces) is a constant depending of the segment length. The traffic is the number of spaces occupied in the segment (car takes one space and truck takes 2.5 spaces). The ProcessModel action logic embedded in the activity Segment i is as follows: IF Vehicle = Car THEN BEGIN (car logic) WAIT UNTIL Traffic i