J. Dairy Sci. 93:373–386 doi:10.3168/jds.2009-2296 © American Dairy Science Association®, 2010.
Conceptual modeling of postmortem evaluation findings to describe dairy cow deaths C. S. McConnel,*1 F. B. Garry,* A. E. Hill,* J. E. Lombard,*† and D. H. Gould* *Integrated Livestock Management, Colorado State University, Fort Collins 80523 †USDA-Animal and Plant Health Inspection Service-Veterinary Services, Centers for Epidemiology and Animal Health, 2150 Centre Ave., Bldg. B, Fort Collins, CO 80526-8117
ABSTRACT
Dairy cow mortality levels in the United States are excessive and increasing over time. To better define cause and effect and combat rising mortality, clearer definitions of the reasons that cows die need to be acquired through thorough necropsy-based postmortem evaluations. The current study focused on organizing information generated from postmortem evaluations into a monitoring system that is based on the fundamentals of conceptual modeling and that will potentially be translatable into on-farm relational databases. This observational study was conducted on 3 highproducing, commercial dairies in northern Colorado. Throughout the study period a thorough postmortem evaluation was performed by veterinarians on cows that died on each dairy. Postmortem data included necropsy findings, life-history features (e.g., birth date, lactation number, lactational and reproductive status), clinical history and treatments, and pertinent aspects of operational management that were subject to change and considered integral to the poor outcome. During this study, 174 postmortem evaluations were performed. Postmortem evaluation results were conceptually modeled to view each death within the context of the web of factors influencing the dairy and the cow. Categories were formulated describing mortality in terms of functional characteristics potentially amenable to easy performance evaluation, management oversight, and research. In total, 21 death categories with 7 category themes were created. Themes included specific disease processes with variable etiologies, failure of disease recognition or treatment, traumatic events, multifactorial failures linked to transition or negative energy balance issues, problems with feed management, miscellaneous events not amenable to prevention or treatment, and undetermined causes. Although postmortem evaluations provide the relevant information necessary for
Received April 15, 2009. Accepted October 6, 2009. 1 Corresponding author:
[email protected]
framing a cow’s death, a restructuring of on-farm databases is needed to integrate this level of detail into useful monitoring systems. Individual operations can focus on combating mortality through the use of employee training related to postmortem evaluations, detailed forms for capturing necropsy particulars and other relevant information related to deaths, and standardized nomenclature and categorization schemes. As much as anything, the simple act of recognizing mortality as a problem might be the most fundamental step toward controlling its progression. Key words: mortality, necropsy, dairy, cow INTRODUCTION
Dairy cow mortality levels in the United States are excessive and increasing over time. Analysis of DHI data (15,025,035 lactations in 45,032 herds) demonstrated a 1.6% increase in death frequency from 1995 to 2005 (Miller et al., 2008). Similarly, the USDAAnimal and Plant Health Inspection Service-Veterinary Services National Animal Health Monitoring System (NAHMS) Dairy 2007 survey reported that 5.7% of the January 2007 dairy cow inventory died on-farm during 2006, a significant increase from 4.8% of the January 2002 inventory and 3.8% of the January 1996 inventory (USDA, 2007b). These numbers are perhaps even more poignant when one considers that this increase in death is occurring even as the age of the US dairy population declines (Hare et al., 2006). This is a growing concern for dairy producers, both because of the obvious economic liability it represents and because of ethical and welfare dimensions (Thomsen and Houe, 2006; NDAWB, 2008). One might suspect an underlying genetic component to increasing death losses as a result of genetic selection biased toward production indices, with little consideration of animal longevity or disease occurrence. In fact, data suggest that Jersey and crossbred dairy cows have a substantially reduced mortality level relative to purebred Holsteins (G. W. Rogers, Global Technical Advisor, Geno Global Ltd.; personal communication). However, overall favorable genetic trends for survival
373
374
MCCONNEL ET AL.
imply that the decline in dairy cow survival is primarily the result of changes in herd management as opposed to genetic selection (Dechow and Goodling, 2008). An exploration of US herd characteristics and practices demonstrated associations between greater levels of mortality and management changes related to intensification (McConnel et al., 2008). The preponderance of literature investigating dairy cow mortality has analyzed the association between mortality levels and population characteristics such as parity, disease prevalence, or days in lactation rather than describing cow death relative to specific necropsy findings (Thomsen and Houe, 2006; Bar et al., 2008; Dechow and Goodling, 2008; McConnel et al., 2008; Miller et al., 2008). Without necropsy examinations, the recorded cause of death is often determined by producer perceptions (McConnel et al., 2009). Many disease conditions can present with similar clinical abnormalities that when used on their own to categorize causes of death can lead to misclassifications (Loneragan et al., 2001). An important step in defining cause and effect and combating rising mortality lies in more clearly defining the reasons that cows die through a thorough necropsy-based postmortem evaluation. Recent publications have touted the benefits of and procedures for performing field necropsy examinations (White, 2005; Mason and Madden, 2007; Wagner, 2007). A dead animal that is not evaluated by necropsy is a total economic loss to a producer; however, a thorough necropsy examination can provide valuable management information that could benefit the herd (White, 2005). Although field necropsies can prove laborious, time consuming, and at times fruitless, there are many reasons for performing them. Necropsies are warranted when morbidity or mortality exceed historic or comfortable levels, when there is a perceived treatment failure, for acquiring samples necessary for confirmation of a tentative clinical diagnosis, when presenting signs are dramatic or unusual, or to characterize a disease process when no antemortem observation has been made (Mason and Madden, 2007). Information derived from a necropsy should be viewed in conjunction with background information related to clinical history and treatments to form a thorough postmortem evaluation. Whereas the costs incurred from necropsies vary depending on who performs the task, the value of a postmortem evaluation is directly related to the accuracy and maintenance of data collected and its application to operational management. It can be difficult to maintain accurate postmortem records that can be easily retrieved to provide valuable insight into historical death patterns and to guide future health planning and programs (White, 2005). Current record systems such as those provided for DHI herds can provide coJournal of Dairy Science Vol. 93 No. 1, 2010
pious concrete data regarding life-history features of dead cows but are not configured to facilitate analysis of previous health events that result in a current condition, nor do they assess the cause and effect of various phenomena. In fact, the least-available dairy herd data comprise records of disease and management events and are subject to tremendous variability in the rigor and consistency of their recording (Kelton, 2006). Establishing record system templates that document dairy cow deaths consistently across operations and within the context of historical influences would allow for the easy determination of the number, distribution, and causes of deaths over a period of time and could guide management practices toward the goal of reduced mortality (McConnel et al., 2009). The current study was founded on the premise that thorough postmortem evaluations could be used to explore causes of dairy cow death not simply as a function of anatomic pathologies but by viewing necropsy findings within the context of historical and environmental influences. Data collection forms have been created that facilitate the capture of concrete data related to the individual animal being evaluated (White, 2005). Such records typically focus on specific life-history features (e.g., birth date, lactation number, lactational and reproductive status), health events, treatments, and necropsy and adjunctive diagnostic findings. Expanding and improving record systems to capture more data related to farm management dynamics can be facilitated through the use of conceptual modeling principles. Modeling provides a foundation for database schemes that prevent redundancy, provide easy entry and retrieval of information, and accommodate new and unexpected items of information (Lescourret et al., 1993). This study focused on organizing information generated from postmortem evaluations into a monitoring system that is based on the fundamentals of conceptual modeling and will potentially be translatable into current on-farm relational databases. MATERIALS AND METHODS The Problem as it Relates to Dairy Complexity
Necropsy examinations of dead animals to assess and monitor causes of death are rarely performed on US dairies (USDA, 2007a), unlike other intensive livestock management systems, including poultry, swine, and feedlot enterprises (USDA, 2000b) where necropsy monitoring is routine. Dairy industry efforts to effectively decrease mortality losses are thus hampered by a lack of monitoring and information to provide an accurate assessment of the problem. Comparing the dairy and feedlot industries makes it easier to understand the apparent inertia associated with dairy postmor-
375
OUR INDUSTRY TODAY
tem evaluations. Within the feedlot industry a small number of observed disease complexes warrant action. Relative to dairy operations, cattle entering feedlots are typically subject to a shorter period within the system and are not faced with the various production challenges of a dairy cow. Demands on feedlot cattle do not include the physiologic challenges associated with pregnancy, parturition, and lactation. Nor are animals in a feedlot operation required to undergo the physical strain of processing (milking, reproductive exams, etc.) multiple times a day as is demanded from milking dairy cattle. As a result, the problems encountered by feedlot cattle are relatively limited and are consequently easier to monitor as compared with the substantially more complex dairy operations. Feedlot Versus Dairy Mortalities
The mortality ratio for cattle entering feedlots did not significantly increase from 1994 to 1999 based on the NAHMS Feedlot 1999 survey findings (Loneragan et al., 2001), yet during that same period, the percentage of dead feedlot cattle that had a postmortem examination substantially increased from 45.9% to 53.9% (USDA, 2000a). This increase in postmortem examinations was primarily the product of an increase in necropsies performed by nonveterinarians (USDA, 2000a). Most of the feedlot-associated deaths documented in the NAHMS survey resulted from bovine respiratory disease complex (61.2%), whereas 21.9% of animals were classified as having died from digestive tract disorders, and 16.9% died of other disorders (Loneragan et al., 2001). Conversely, the percentage of dairy cows that die onfarm has significantly increased from 1996 to 2007, yet the NAHMS Dairy 2007 study reported that necropsies were performed on only 13% of operations (~9,750 operations) and only 4.4% of dead dairy cows (~23,000 cows) (USDA, 2007a). Furthermore, the range of dairy producer–attributed causes of death within the Dairy 2007 study included lameness or injury (20.0%); mastitis (16.5%); calving problems (15.2%); respiratory problems (11.3%); scours, diarrhea, or other digestive problems (10.4%); other known reasons (11.6%); and unknown reasons (15.0%). The perception is that dairy cows die from a wider range of problems than are typically recognized within the feedlot industry, yet substantially less effort is made in terms of postmortem evaluations to more fully define how and why dairy cows die.
of milk/cow per year, respectively), commercial dairies in northern Colorado. Dairy A participated in the study from October 2006 through November 2007, Dairy B participated from November 2006 through September 2007, and dairy C participated from October 2006 through January 2007. Dairies A and C maintained essentially stable inventories of 1,500 and 2,000 Holstein cows (lactating and dry), respectively. Dairy B’s inventory of approximately 800 cows consisted of 25% Jersey and 75% Holstein cattle (lactating and dry). Lactating cows on dairies A and C were predominantly housed year-round in freestall barns with bedding consisting of sand on dairy A and composted manure on dairy C. Lactating cows on dairy B were held in drylots during summer months and freestall barns bedded with sawdust during the winter months. All 3 dairies held dry cows in drylots. Arithmetic mean SCC were 247,698, 198,218, and 219,789 cells/mL for dairies A, B, and C, respectively. Cows were milked 3 times a day on all of the dairies. Approximately 40% of cows on dairy A received bST, whereas dairies B and C did not use bST. Hoof-care programs on all dairies involved both the treatment of animals observed with lameness and twice-annual maintenance trimming. Nutritional management for all dairies included the use of a TMR and forage testing, with ration formulation by a professional consultant based on production and stage of lactation. The dry period was approximately 55 d for all dairies. Maternity housing was separate from housing used for other dry cows or lactating cows. On dairies A and B, heifers and mature cows were grouped together within the close-up maternity housing, but on dairy C, heifers and mature cows were grouped separately. On dairies A and C, the majority of cows calved in a multiple animal area, whereas on dairy B, the majority calved in an individual animal area cleaned after 2 or more calvings. Fresh cows were penned separately from hospital cows, and first-lactation cows were grouped separately from mature cows on all dairies. Approximately 28, 18, and 43 full-time staff participated in milking and cow management activities on dairies A, B, and C, respectively, with training sessions performed multiple times per year to cover protocols related to milking, calving, and fresh-cow monitoring. Routine veterinary services on dairy A were provided by the Colorado State University College of Veterinary Medicine. Dairies B and C each employed an in-house veterinarian to provide veterinary services. Operational management on all dairies included the use of on-farm computer systems to track cow- and herd-level data.
Project Framework
Postmortem Evaluations
This observational study was conducted on 3 (A, B, and C) high-producing (13,184, 11,915, and 11,275 kg
Throughout the study period, a thorough postmortem evaluation was performed on most cows that died Journal of Dairy Science Vol. 93 No. 1, 2010
376
MCCONNEL ET AL.
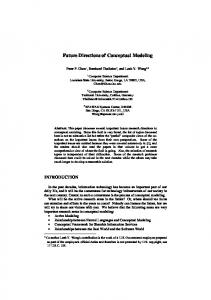
Figure 1A. Postmortem data collection sheets, page 1.
on each dairy. Necropsies were performed on dairy A by one of 2 Colorado State University veterinarians and on dairies B and C by the respective in-house veterinarians. All 4 participating veterinarians were trained in standard necropsy techniques (Severidt et al., 2002) via a necropsy protocol overview performed at the Colorado State University Veterinary Diagnostic Laboratory before commencing the project. When possible, the participating veterinarians performed antemortem clinical evaluations on animals to be killed. Necropsy examinations were performed as soon as possible after death and within a maximum of 24 h. If a participating veterinarian could not attend to a cow within 24 h postmortem, the animal was excluded from the study. The submission of appropriate tissue or biologic samples for further diagnostics was discretionary and based on necropsy findings when additional insight was Journal of Dairy Science Vol. 93 No. 1, 2010
warranted to confirm or determine the cause of death. Carcasses were disposed of through on-site composting on dairies A and C and were removed by a renderer on dairy B. Results from the postmortem evaluation were recorded in a standardized format (Figure 1A and 1B) that captured concrete data related to specific life-history features (e.g., birth date, lactation number, lactational and reproductive status), health events, treatments, and necropsy findings. No timeframe was set before death for inclusion of events; rather, the veterinarian overseeing the postmortem examination recorded health problems and treatment episodes believed to have potentially influenced the final outcome of death. Most often this included health and treatment events within a current lactation, although data from a previous lactation did occasionally provide useful informa-
377
OUR INDUSTRY TODAY
Figure 1B. Postmortem data collection sheets, page 2.
tion related to a death. The participating veterinarians also included more dynamic data inherent to the dairy and believed to be relevant to the death. These data included aspects of operational management that were subject to change and considered integral to the poor outcome. Whereas it was believed that the proximate cause of death could most often be described through necropsy findings, the additional management-oriented information provided a more thorough analysis of any underlying or key determinant causes of death. Borrowing from the language of pathology, this was comparable to establishing a “definitive diagnosis” through the naming of a disease (proximate cause) versus an “etiological diagnosis” that incorporates both cause and effect as might be defined by infectious agents and resultant lesions (key determinant causes).
dation for reported necropsy findings. Digital imaging has been used as part of the collection of necropsy information from feedlots. In feedlot animals, 4 to 8 views should be adequate for establishing a diagnosis, using a standard necropsy technique and comprehensive written protocols (Wildman et al., 2000). In the current study, 3 standard images were taken: the unopened carcass lying on its left side, the opened abdominal cavity, and the opened thoracic cavity. Other images were discretionary and represented notable findings depicting abnormalities documented on the postmortem data sheet. For instance, if the only notable pathological alteration was gross evidence of hemorrhagic bowel syndrome, then an additional digital image was taken of the affected intestinal section. Conceptually Modeling Postmortem Findings
Digital Image Capture
Digital images were taken during each necropsy to provide a general overview of the carcass, to document specific pathological changes, and to provide data vali-
Results from the postmortem evaluation were conceptually modeled as described by Lescourret et al. (1993). Such a model provides analysis at a conceptual level in that it is free of the constraints of database Journal of Dairy Science Vol. 93 No. 1, 2010
378
MCCONNEL ET AL.
Table 1. Descriptive statistics and chi-squared analysis of annual dairy cow deaths with no necropsy examination versus deaths with a necropsy examination on 3 dairies separately and in combination by parity and days postpartum1 Dairy A
Dairy B
Necropsy, n Item
No
Yes
Total per dairy Parity 1 2–4 ≥5 Days postpartum ≤15 16–30 31–60 >60
43
68
1
Necropsy, n χ2 P-value
No
Yes
21
39
0.08 19 22 2
17 43 8
8 5 5 25
18 5 3 42
Dairy C Necropsy, n
χ2 P-value
No
Yes
206
67
0.97 5 9 7
9 18 12
6 4 3 8
11 7 5 16
0.36
Combined dairies Necropsy, n
χ2 P-value
No
Yes
270
174
82 141 47
44 98 32
57 32 36 145
45 21 16 92
0.97 58 110 38
18 37 12
43 23 28 112
16 9 8 34
1.00
χ2 P-value 0.51
0.88
0.46
Due to multiple comparisons per category, a P-value of ≤0.01 was used to establish significant differences.
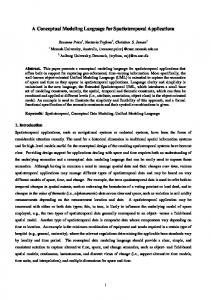
management system implementation; a single model can be translated into different data structures. A representation of this conceptual data modeling is shown in Figure 2 and was based on the entity-relationship approach, with entities describing real objects (cow, dairy) and relationships providing connections between such entities (i.e., cows belong to a dairy). In this model, the entity cow was defined by several concrete characteristics or attributes. Similarly, the entity dairy consisted of several potentially influential dynamic attributes. The relationship between the dairy and the cow also contained an attribute establishing the period of time that the cow was on the farm. However, the relationship between the dairy and the cow primarily served as a conduit for incorporating influential operational characteristics into the postmortem evaluation. Categories were then formulated on this complete representation of the individual animal and dairy attributes such that a relationship formed between each death and a categorical descriptor for that death. This relationship between the cow and a death category was defined by an attribute based on the specificity of the cause of death. This relational attribute reflected whether a particular mortality was most effectively categorized via a proximate cause such as a specific disease or a key determinant cause founded on more general temporal or managerial influences. Themes were then applied to like categories based on a relational attribute describing the type of death in terms of problems related to clinical disease, disease recognition or treatment, trauma, nutrition, or the stage of lactation.
total number of dead and sold cows, respectively, over the 12-mo period extending from November 1, 2006, to October 31, 2007, divided by the number of dairy cows present on the operation at the end of that period. For each dairy and for the combined dairies, the distributions of total annual necropsied deaths by parity and by days postpartum were compared with the distributions of nonnecropsied deaths using a chi-squared test (PROC FREQ, SAS, version 9.1, SAS Inst. Inc., Cary, NC). In addition, the distribution of deaths by parity, days postpartum, lactation status, pregnancy status, type of death (killed versus unassisted), and recumbency ≥24 h before death were compared among dairies using chisquared testing. Similarly, the distribution of specific and combined health events and treatments that were recorded per necropsied animal were compared among dairies, as were the distribution of anatomic systems with pathologic necropsy findings, the primary anatomic pathology associated with death, and the distribution of necropsied animals placed within specific categorical themes. For all comparisons in which more than 20% of contingency table cell counts were less than 5, SAS PROC FREQ computed Fisher’s exact test using the network algorithm of Mehta and Patel (1983). For evaluations of a single null hypothesis, P ≤ 0.05 was considered statistically significant. For multiple comparisons, the significance level was adjusted by dividing the desired significance level (0.05) by the number of null hypotheses evaluated. RESULTS Postmortem Comparisons of Life-History Features
Comparisons Between Dairies
For comparison, each dairy’s annual mortality and sold-to-slaughter percentages were calculated using the Journal of Dairy Science Vol. 93 No. 1, 2010
During the study, 174 postmortem evaluations were performed. Dairy C’s involvement was restricted to 4 mo because of the departure of the in-house veterinar-
379
OUR INDUSTRY TODAY
ian. Of the 174 postmortems, 68 were performed on dairy A, 39 on dairy B, and 67 on dairy C (Table 1). Of those 39 postmortems on dairy B, 7 were from Jerseys as opposed to Holsteins, a similar distribution to the breed distribution within the herd and comprising a relatively small sample from which to make meaningful comparisons based on breeds. Total deaths on dairies A, B, and C over a 12-mo period extending from November 1, 2006, to October 31, 2007, were 111, 60, and 273, respectively. Herd inventories for the 3 dairies were 1,529 (A), 777 (B), and 2,255 (C) on October 31, 2007. Annual mortality percentages for dairies A, B, and C were 7.3, 7.7, and 12.1% and the annual percentages of cattle sold to slaughter were 31.5, 17.4, and 30.4%, respectively. The consequent percentages of overall removals that resulted from death loss rather than other, more economically favorable culling decisions equated to 18.8, 30.8, and 28.5% for dairies A, B, and C, respectively. The distribution of necropsied deaths by parity did not differ from the distribution of annual nonnecropsied deaths by parity (Table 1). Nor was the distribution of necropsied cows by days postpartum different from the distribution of annual deaths by days postpartum (Table 1). The distribution of necropsied cows by parity, days postpartum, pregnancy status, and recumbency status before death were not dependent
on the dairy (Table 2). However, the distributions of necropsied cows by lactation status and type of death were dependent on the dairy (Table 2). Postmortem Comparisons of Health Events, Treatments, and Necropsy Findings
Relevant health events and treatments were recorded for each of the 174 deaths. The distribution of deaths by specific health events and treatments showed some dependency on the dairy (Table 3). Occurrences of milk fever and lameness varied according to dairy. When health events were categorized by the number of occurrences per animal (0, 1, 2, >2), there was no dependence on the dairy. Of the treatments given, only the use of anti-inflammatories, intravenous fluids and electrolytes, and vitamins varied according to dairy. When treatments were categorized by the number of occurrences per animal (0, 1, 2, >2), the categories representing 2 and >2 varied with dairy. The distribution of deaths by specific anatomic lesion diagnoses and the anatomic system with the primary pathology associated with death demonstrated some variation among dairies (Table 3). Pathological changes associated with the abdomen or peritoneum, abomasum, heart, liver, lungs, oral cavity, and trachea varied with dairy. The
Figure 2. Conceptual data model used to organize necropsy-based postmortem information into a categorical scheme developed for monitoring dairy cow mortality. Journal of Dairy Science Vol. 93 No. 1, 2010
380
MCCONNEL ET AL.
Table 2. Descriptive statistics and chi-squared analysis from 174 deaths on 3 dairies by parity, days postpartum, lactation status, pregnancy status, type of death, and recumbency status before death1 Dairy A Item Parity 1 2–4 ≥5 Days postpartum ≤15 16–30 31–60 >60 Lactation status Lactating Dry Pregnancy status Pregnant Open Type of death Killed Unassisted Recumbent ≥24 h before death Yes No
Dairy B
Dairy C
n
%
n
%
n
%
17 43 8
25 63 12
9 18 12
23 46 31
18 37 12
27 55 18
18 5 3 42
26 7 4 62
11 7 5 16
28 18 13 41
16 9 8 34
24 13 12 51
66 2
97 3
38 1
97 3
58 9
87 13
15 53
22 78
4 35
10 90
16 51
24 76
24 44
35 65
4 35
10 90
14 53
21 79
18 50
26 74
16 23
41 59
24 43
36 64
Combined dairies χ2 P-value
n
%
44 98 32
25 56 18
45 21 16 92
26 12 9 53
162 12
93 7
35 139
20 80
42 132
24 76
58 116
33 67
0.18
0.27
0.03 0.21 0.01 0.26
1
A P-value of ≤0.05 was used to establish significant differences.
anatomic system listed as the primary pathology associated with death differed among dairies for the small intestine. The number of anatomic systems with pathologic abnormalities per death (0, 1, 2, 3, 4, 5, >5) was not dependent upon the dairy. Digital Image Utility
Digital image documentation of dairy cow necropsies proved to be a complicated endeavor in large part because of the often varied disease processes culminating in a death. As shown in Table 3, over a third of deaths (36%) demonstrated 5 or more systems with evidence of pathology. Although not all documented pathologies were integral to the final outcome of death, capturing the relevant affected anatomic systems required a detailed examination with a thorough understanding of bovine physiology. Although many images clearly captured a specific pathology, capturing all significant pathologies within an individual animal and providing sufficient explanation for images that failed to demonstrate pathologic context was difficult. For instance, ruptured vessels were easily enough observed within an image but often required a detailed explanation of the anatomic location and other potential pathologic influences if the cause of death was to be more fully understood. Ultimately, the digital images provided a discussion point when reviewing individual deaths but were not useful as the sole explanation of pertinent lesions. Their utility was limited by the complexities Journal of Dairy Science Vol. 93 No. 1, 2010
of the necropsy examination and reliant on thorough input from the prosector. Dairy and Veterinarian Differences
Although the majority of comparisons between dairies for life-history features, health events, treatments, and necropsy findings were not significantly different, the differences identify difficulties in reliably documenting the complexities associated with dairy postmortems. The differences between dairies likely represented variations in operational management and environment and veterinary perspective. For instance, dairy A likely documented greater levels of oral cavity and tracheal pathologies because a veterinarian on dairy A more closely scrutinized those anatomic systems, not because of a disease complex specific to that dairy. This potential for relativism underscores the importance of establishing an information system that views each death as a whole. For this study, this included the assessment by the participating veterinarians of more dynamic data related to operational management and considered important to the final outcome. Although still subjective, these data provided a more complete picture of the events leading up to the death such that each death could be viewed within the context of the complexity of a cow’s life on a dairy. Conceptual Model
Relevant attributes related to the dairy and cow entities and the relationship between them were
381
OUR INDUSTRY TODAY
Table 3. Descriptive statistics and chi-squared analysis from 174 deaths on 3 dairies by specific health events, health events categorized by number of occurrences per animal, treatments, treatments categorized by number of occurrences per animal, specific anatomic systems with pathologic necropsy findings, the number of anatomic systems with pathologic abnormalities per death, and the anatomic system with the primary pathology associated with death1
Item Health events (P significant ≤0.004)
Health event occurrences per animal (P significant ≤0.01) Treatments (P significant ≤0.005)
Treatment occurrences per animal (P significant ≤0.01) Specific anatomic systems with pathologic necropsy findings (P significant ≤0.002)
Number of anatomic systems with pathologic abnormalities per death (P significant ≤0.007)
Clinical mastitis Milk fever Ketosis Lameness Respiratory problems Diarrhea >48 h Melena: ulcers/HBS2 Abortion Retained placenta Dystocia Metritis Displaced abomasum Neurological problems 0 1 2 >2 No treatments Antibiotics (IM, IV, SC)3 Intramammary antibiotics Intrauterine antibiotic/flush Anti-inflammatories IV fluids/electrolytes Oral fluids/electrolytes Vitamins Hoof block/trim Surgical intervention 0 1 2 >2 No abnormalities Abdomen/peritoneum Abomasum Bladder Brain Esophagus Eyes Heart Kidneys Large intestine/cecum Liver Lungs Musculoskeletal Oral cavity Rumen, reticulum, omasum Small intestine Spleen Systemic Trachea Udder Uterus 0 1 2 3 4 5 >5
Combined dairies
Dairy A
Dairy B
Dairy C
n
%
n
%
n
%
χ2 P-value
14 1 4 6 10 3 1 3 2 12 9 8 1 16 35 12 5 12 28 5 1 25 16 26 1 2 7 18 12 22 16 2 33 22 0 0 3 4 29 6 5 16 37 15 8 12 20 1 25 12 18 15 0 8 11 12 12 6 19
21 1 6 9 15 4 1 4 3 18 13 12 1 24 51 18 7 18 41 7 1 37 24 38 1 3 10 26 18 32 24 3 49 32 0 0 4 6 43 9 7 24 54 22 12 18 29 1 37 18 26 22 0 12 16 18 18 9 28
12 9 2 3 4 5 2 2 5 8 7 1 1 10 13 7 9 2 25 4 0 32 20 19 5 1 2 3 7 9 20 1 22 5 1 0 0 4 8 1 3 18 10 11 0 1 15 0 16 0 10 12 1 4 6 10 6 9 3
31 23 5 8 10 13 5 5 13 21 18 3 3 26 33 18 23 5 64 10 0 82 51 49 13 3 5 8 18 23 51 3 56 13 3 0 0 10 21 3 8 46 26 28 0 3 38 0 41 0 26 31 3 10 15 26 15 23 8
14 4 3 24 8 5 0 1 5 13 12 16 1 8 27 21 11 6 38 8 2 47 38 37 30 6 16 9 13 6 39 0 13 43 0 1 1 2 38 4 3 38 41 23 0 6 12 1 24 2 12 21 0 3 9 11 18 10 16
21 6 4 36 12 7 0 1 7 19 18 24 1 12 40 31 16 9 57 12 3 70 57 55 45 9 24 13 19 9 58 0 19 64 0 1 1 3 57 6 4 57 61 34 0 9 18 1 36 3 18 31 0 4 13 16 27 15 24
0.42