JOURNAL OF EARLY ADOLESCENCE / February 2005 10.1177/0272431604272460 Theokas et al. / CONCEPTUALIZING THRIVING
Conceptualizing and Modeling Individual and Ecological Asset Components of Thriving in Early Adolescence Christina Theokas Jason B. Almerigi Richard M. Lerner Tufts University
Elizabeth M. Dowling ImagineNations Group
Peter L. Benson Peter C. Scales Search Institute
Alexander von Eye Michigan State
Using two randomly selected separate subsamples of 50,000 middle or high school students drawn from the 1999 to 2000 Search Institute Profiles of Student Life Attitudes and Behavior survey, first- and second-order factors of items assessing internal and external assets were identified. In both samples, first-order exploratory factor analyses produced 14 scales with conceptual integrity and adequate reliability, although differences were found between the middle and high school samples (e.g., further differentiation of scales). The factors in the middle school sample loaded on two second-order constructs, representing individual and ecological assets. These second-order factors accounted for unique variance in an index of thriving. The concept of developmental assets and the role of these assets in early adolescent development are discussed. Keywords: thriving; individual assets; ecological assets; developmental systems theory
Correspondence concerning this article should be addressed to Christina Theokas, Eliot-Pearson Department of Child Development, Tufts University, Medford, MA 02155; e-mail:
[email protected]
Journal of Early Adolescence, Vol. 25 No. 1, February 2005 113-143 DOI: 10.1177/0272431604272460 © 2005 Sage Publications 113
114
JOURNAL OF EARLY ADOLESCENCE / February 2005
The healthy development of youth has been a value and goal of American society. Traditionally, families and schools (and more recently, communities) have been charged with nurturing, socializing, and educating children to be productive, positively contributing members of society. However, the theory and research traditions associated with psychology, and developmental psychology in particular, have been framed in a deficit perspective about youth. G. Stanley Hall (1904) initiated this perspective with his description of adolescence as a time of inevitable storm and stress. Similarly, Anna Freud (1969) viewed adolescence as a period of normative developmental disturbance, and Erik Erikson (1968) believed that youth identity was born of crisis. Much of the work following the deficit conceptualization of youth emphasized a medical model that relies on the diagnosis and treatment of problems. An entire manual, the Diagnostic and Statistic Manual of Mental Disorders (Fourth Edition; American Psychiatric Association, 1994), has been devoted to cataloging the potential disorders and deficits that can occur across development. Focus was placed on what makes people ill, rather than what makes people healthy (Larson, 2000). Recent data collected regarding youth indicates that young people today face greater risks to their healthy development than ever before, contributing to the idea that youth are broken and in need of fixing (Dryfoos, 1990; Lerner, 1995; Perkins & Borden, 2003). Consequently, youth have often been discussed in relation to the risk behaviors that they engage in and the negative and destructive choices that they make. Healthy development has become synonymous with the lack of risk behaviors and not with the presence of adaptive choices, happiness, optimism for the future, purpose, and meaningful relationships (Benson, 2003; Benson, Scales, & Mannes, 2003; Damon, Menon, & Bronk, 2003). Research in the latter decades of the 20th century, however, began to focus on the study of positive youth development. This alternative conception is derived from developmental systems theories (Lerner, 1998), which underscores the potential for plasticity in human development and, thus, legitimates the assumption that youth are resources to be developed, as compared to youth as problems to be managed (Roth, Brooks-Gunn, Murray, & Foster, 1998). Instead of anticipating and trying to fix or prevent problems, this new paradigm considers the strengths, competencies, and contributions that youth can make and ways to align these strengths with resources and supports in the environment to maximize healthy development of individuals and society. Preparation and engagement of youth is the goal (Pittman, 1996). Youth are seen as active and equal participants, as opposed to immature adults that need to be controlled and directed toward positive outcomes.
Theokas et al. / CONCEPTUALIZING THRIVING
115
Instead of making youth the recipients of services, education, and training by adults, young people, through their initiative and leadership, can actively contribute and shape society and the future (Lerner, 2004). As a result of this new vision regarding youth, a new vocabulary regarding youth development has emerged, including terms such as well-being, flourishing, thriving, and the Five Cs of positive youth development (competence, confidence, connection, character, and caring) to describe adolescents who are doing well (Benson, 1997; Eccles & Gootman, 2002; Keyes, 2003; Lerner, 2004; Seligman & Csikszentmihalyi, 2000). Problem behaviors and involvement in risky behaviors are still measured and documented, but increasing attention has been directed toward naming, defining, and measuring what constitutes optimal development. For example, Peterson and Seligman (2003) have developed a taxonomy of character strengths and virtues that they hope will be psychology’s positive response to psychiatry’s DSM-IV. Keyes (2003), also challenging the deficit model implicit in the mental health movement, attempts to define health as more than the absence of risk. He proposes three components of flourishing: (a) emotional well-being, operationalized as positive affect, happiness, and life satisfaction; (b) social well-being, measured by having warm, trusting relationships, empathy, and intimacy; and (c) psychological well-being, indexed by self-acceptance, purpose in life, mastery, autonomy, and positive relations with others. Lerner et al. (2005 [this issue]), addressing adolescents specifically, operationalize positive youth development as the Five Cs and provide the first empirical basis of this conception of the healthy, successful development of individuals along the way to idealized personhood. Moreover, Lerner et al. (2005) hypothesize that when the Five Cs are present in youth across time, contribution, a sixth C, will emerge. Documentation of these attributes and behaviors deviates significantly from counting decreasing numbers of high school dropouts, pregnant teenagers, and teenage substance users and abusers to index the status of positive functioning among youth. Another example of this vocabulary and vision about the strengths of youth comes from Search Institute (Benson, 1997, 2003). They propose and measure seven behavioral indicators of thriving, including (a) school success, (b) leadership, (c) helping others, (d) maintenance of physical health, (e) delay of gratification, (f) valuing diversity, and (g) overcoming adversity (Leffert et al., 1998; Scales, Benson, Leffert, & Blyth, 2000). These indicators are intended to be indices of positive outcomes comparable to indices of problem behaviors traditionally used to describe youth. They are not necessarily inclusive of all behaviors that describe a successful youth, but Scales et al. (2000) has suggested these actions and activities are descriptive of core
116
JOURNAL OF EARLY ADOLESCENCE / February 2005
adolescent tasks (e.g., school success, individuation, and connection to others) and are related to other short- and long-term positive outcomes (e.g., self-esteem, peer acceptance, and problem solving), as well as a lowered incidence of risk behaviors. Previous research conducted by Search Institute has demonstrated that these indicators are positively related to the level, or overall number, of developmental assets present in an adolescent’s life (Benson, Leffert, Scales, & Blyth, 1998). Developmental assets may be internal to a young person (e.g., personal values) or external to him or her (e.g., support or boundaries and expectations) and are conceptualized as the essential building blocks of healthy youth development. Moreover, these developmental assets account for a significant portion of variance in individual thriving indicators (Scales et al., 2000), for example, achievement motivation and school engagement, which are internal assets, in combination with time spent in youth programs, which is an external asset, significantly predicted school success for six different racial or ethnic groups of 6th to 12th grade students. Developmental Systems Theory and Thriving The focus on human strengths and competence suggests a revaluation, if not a complete rejection, of the deficit perspective and a focus solely on prevention to, instead, a science that is focused on understanding what builds thriving individuals, families, institutions, communities, and society. This new vocabulary and paradigm for discussing young people, focusing on indicators of well-being—providing snapshots of healthy youth development for single moments in time—is a beginning (Bornstein, Davidson, Keyes, Moore, & The Center for Child Well-Being, 2003); however, it needs to be embedded in a theory of developmental change to explain positive development across time, both within and between individuals. Developmental systems theory provides this theoretical explanation of developmental change by describing and explaining positive development as a life-span process in which the individual and context are dynamically fused across time in mutually beneficial interactions (Lerner, 2002). As noted above, recognizing the individual and the context as dynamically interactive, as opposed to development being deterministically based either only on one’s genetic inheritance or only on social experiences, introduces the potential for plasticity (or change) in human development and, thus, the potential in every individual for positive, healthy change across the life span (Baltes, Lindenberger, & Staudinger, 1998; Brandtstädter, 1998; Lerner, 1998). When these bidirectional interactions between individual and context advance the well-being of both components, they are termed adaptive devel-
Theokas et al. / CONCEPTUALIZING THRIVING
117
opmental regulations (Lerner, 2004). Youth who are adaptively functioning across time with their environments are seen as individuals who are enhancing and contributing to the positive development of self, family, community, and civil society (Lerner, 2004; Youniss, McLellan, & Yates, 1999). Moreover, these youth are described as thriving and on their way to idealized personhood (Lerner, 2004; Lerner, Dowling, & Anderson, 2003). Thriving is thus a concept denoting a change or a process; it is not a trait (a behavior that does not vary across time and place) or a state (a status describing behaviors that are representative of a person at only one time or place). Thus, a trait is a time-irrelevant concept, and a state connotes a behavioral point in time. Thriving, however, is representative of an active individual who is functioning across time and place to interact with an active context in manners that enhance both person and setting. All behaviors do not have to be perfectly matched with the context at all times; rather, the individual must have a flexible behavioral repertoire to meet changing opportunities and challenges. Modal behavior of such a person would reflect adaptive developmental regulations, however. Thriving represents, then, an overall range of behaviors that reflect a fit with the context. Thus, there would be differences within individuals across time, and differences between individuals, that reflect this goodness of fit with the multiple settings (family, school, community) of one’s context. Although a developmental systems approach to studying the thriving process is most compatible with longitudinal analyses, having multiple indicators of thriving behaviors—to determine the behavioral repertoire, rate, and direction of thriving across time within individuals—Search Institute’s rich archival database of hundreds of thousands of middle and high school students can be exploited to understand the frequency and distribution of static indicators of thriving behaviors across adolescence. In addition, these thriving behaviors can be examined in relation to different perceived individual and contextual assets that are also assessed by Search Institute. As previously noted, Search Institute has assessed the relationship between the number of assets that individuals possess and the above noted set of thriving indicators, through analysis of a large database of youth who were administered the Profiles of Student Life: Attitudes and Behavior Scale (PSL-AB) in 1996 to 1997 (Leffert et al., 1998; Scales et al., 2000). However, structural relationships have not been examined between empirically derived asset scales and thriving behaviors. Limitations associated with single-item asset measures and the limited reliability of some multi-item asset measures included in the survey have prevented the organization of the asset items into empirically derived superordinate categories or domains. Search Institute has reported theoretically conceptualized asset groups that are meaningful
118
JOURNAL OF EARLY ADOLESCENCE / February 2005
and descriptive for public communication and education purposes. The goal has been to mobilize and unite community-based efforts, based on knowledge of the average total number of assets present in youth in a community and on a report of the presence of assets in internal categories (commitment to learning, positive values, social competencies, and positive identity) and external ones (support, empowerment, boundaries and expectations, and constructive use of time). The Current Study The present study attempts to ascertain the first- and second-order empirical factor structure of the developmental asset items included in the PSL-AB. A secondary research question, regarding this empirical structure, considers the developmental significance of the derived asset scales. A universal structure for the second decade of life has been proposed by Search Institute (Benson et al., 1998). However, past research with the PSL-AB has indicated that middle school youth and high school youth often have different levels of assets, with a fairly consistent decline in the number of assets from middle school to high school (Leffert et al., 1998). Given the emerging cognitive skills, biological changes, interpersonal experiences, and contextual transitions experienced by youth across this time period, the structure of perceived assets may change across time. Therefore, the first question posed in the current analysis was whether the factor structure of the asset items is the same for middle school youth and high school youth. To continue the explication of constructs related to developmental systems theory and the promotion of positive youth development, the second goal of the current study is to examine the structural relationships between the empirically derived asset scales and a composite of thriving behaviors. Developmental systems theory proposes that when there is a good match between internal setting conditions and external setting conditions, positive youth development, or thriving, will occur. Particular assets may be more salient and related to thriving behaviors. Certain ranges and combinations of asset scales may lead to optimal outcomes, whereas other assets may have limited added value. These possibilities are explored in the present research. METHOD Participants A sample of 229,596 youth from public schools across the United States in grades 6 to 12 responded to the Search Institute’s PSL-AB survey in 1999
Theokas et al. / CONCEPTUALIZING THRIVING
119
and 2000. The survey was administered to all students present in school on the day of data collection (males = 47%; females = 53%). Participants were between the ages of 10 and 19 years old (mean age for boys = 14.47, SD = 1.94; mean age for girls = 14.37, SD = 1.92) and were predominantly European American (78.2%).1 Communities self-select to administer the survey to their youth and, thus, are not necessarily a representative sample. Place of residence for participants included in the overall sample include 38.5% cities, 32.1% towns, 16.5% rural areas, and 7.5% farms; less than 1% of participants live on reservations. Two random nonoverlapping samples of 50,000 sixth to eighth grade students were drawn from the overall sample. Group 1 students (mean age = 12.7, SD = 1.0) were relatively evenly distributed across the three grades in school (Grade 6 = 26.6%, Grade 7 = 31.7%, and Grade 8 = 41.8). Group 2 students (mean age = 12.7, SD = 1.0) matched the characteristics of Group 1 (Grade 6 = 26.6%, Grade 7 = 31.6%, and Grade 8 = 41.7%) and were used to cross-validate the results of the empirical analyses of the structure of the asset items. In addition, a random sample of high school students, Group 3, (Grade 9 = 27.3%, Grade 10 = 30.9%, Grade 11 = 24%, and Grade 12 = 17.7%) was drawn from the database to examine if the empirical structure of the asset items was equivalent across age groups. Table 1 displays the demographic characteristics of the three sample groups in relation to the overall sample. Measure As noted above, the 1999 to 2000 administration of the Search Institute’s PSL-AB youth survey was used as the data-collection instrument. Surveys were anonymously completed during a school class period with standard instructions provided to facilitate its completion. Completed surveys were placed in a sealed envelope and mailed to Search Institute for processing and for the development of a community wide report about the presence and level of assets of youth in the community. There are 156 items in the PSL-AB survey. Seven items were designed to measure thriving behaviors (school success, leadership, helping others, maintenance of physical health, delay of gratification, values diversity, and overcome adversity; Scales et al., 2000). Each item is measured with a Likert-type scale; five of the items are measured with a 5-point scale, one with an 8-point scale (grades in school), and one with a 6-point scale (helping others). In the following analyses, the individual thriving items are standardized and summed, and the mean is computed to form a composite score for each individual. Using a composite is intended to reflect the range of behaviors possible that might describe thriving and the overall level of thriving
120
JOURNAL OF EARLY ADOLESCENCE / February 2005
TABLE 1:
Comparison of Demographic Variables Between the Overall Sample and the Three Randomly Selected Subsamples From the 1999 Through 2000 Search Institute PSL-AB survey
Total Sample Gender Males Females Ethnic identity European American African American Hispanic Asian American American Indian Multiracial Mother’s education Grade school Some high school High school Some college College Graduate school Do not know Family Composition Two parents One parent—mother One parent—father Part-time—mother or father
Subsample 1: Subsample 2: Subsample 3: Grades 6 Grades 6 Grades 9 Through 8 Through 8 Through 12
47 53
49.1 50.4
49.2 50.2
48.2 51.4
78.2 5.7 6.1 2.7 1.5 5.2
76.5 6.0 6.5 2.5 2.0 5.9
76.5 6.1 6.5 2.5 2.0 5.7
79.7 5.3 5.8 2.9 1.1 4.6
2.2 4.4 23.0 11.3 26.4 14.7 8.0
2.4 5.5 21.5 13.4 26.0 13.8 10.1
2.4 5.5 21.8 13.4 25.7 13.7 10.1
2.2 6.6 26.5 17.8 27.1 12.2 5.0
74.7 14.4 3.1 7.8
73.8 13.4 2.4 9.8
73.5 13.3 2.5 10.0
74.6 15.1 3.5 6.0
NOTE: PSL-AB = Profiles of Student Life: Attitudes and Behavior. Numbers represent the percentage of the sample.
within an individual at a single point in time. It is not expected that all individuals will have high scores on all indicators, but that individuals with higher overall scores on the index will have a broader repertoire of behaviors that reflects a modal response of thriving, as compared to individuals with lower overall scores. For example, it is not necessarily reasonable to assume that all youth will earn straight As, be a leader in multiple groups and organizations, and help other people 11 or more hours a week. When using single item behavioral indicators, thriving can be achieved through multiple pathways, and more of some behaviors and less of others are reasonable for any given individual. Evidence for the potential utility of this rationale for forming a thriving com-
Theokas et al. / CONCEPTUALIZING THRIVING
TABLE 2:
121
Descriptive Statistics for Individual Thriving Indicators
Thriving Indicator Succeeds in school Values diversity Exhibits leadership Delays gratification Overcomes adversity Maintains physical health Helps others
Range
X
SD
Skewness
Kurtosis
1 through 8 1 through 5 1 through 5 1 through 5 1 through 5 1 through 5 1 through 6
6.1 3.6 2.7 3.2 4.0 3.5 2.7
1.7 1.1 1.5 1.4 1.1 1.2 1.3
–.841 –.577 .262 –.230 –.995 –.457 .767
.098 –.503 –1.4 –1.16 .215 –.793 .037
posite score is that it approximates a normal curve (mean = 0, SD = .50); in turn, individual thriving behaviors, because of their restricted variability and chosen response metric, are often skewed and less useful for group analyses. Table 2 reports the descriptive statistics for the individual thriving behaviors in the total sample. Ninety-two items are used on the PSL-AB to measure internal and external developmental assets. The developmental assets are defined by Search Institute as a set of “building blocks that when present appear to enhance important developmental outcomes” (Leffert et al., 1998, p. 209). The 40 developmental assets are grouped into 8 main categories, with support, empowerment, boundaries and expectations, and constructive use of time comprising the four categories for 20 external assets and commitment to learning, positive values, social competencies, and positive identity describing the four categories for the 20 internal assets (see Leffert et al., 1998, for a complete description of the items and the psychometric properties of the individual asset measures). External assets are provided to youth by parents, peers, schools, and communities, whereas internal assets are intended to be self-processes and dispositions that develop across time and enhance the probability of engagement in positive actions. The response formats for all items are Likert-type scales, with the majority (86%) measured on a 5-point scale. The remaining items in the PSL-AB assess demographic characteristics and risk behaviors and patterns. Data Analysis Procedures The data analysis of the PSL-AB survey items followed multiple steps. As previously mentioned, three subsamples of 50,000 cases were randomly selected from the total sample. The criterion for selection into the groups was
122
JOURNAL OF EARLY ADOLESCENCE / February 2005
grade level. The goal was to have two groups comprised of sixth to eighth grade students with comparable characteristics: one core sample and one sample for cross-validation at the middle school level and a third sample of high school students. An empirical question for the current analysis was whether 6th- to 8th-grade students have a different asset-factor structure than 9th- to 12th-grade students. The developmental asset items were analyzed with exploratory factor analytic procedures, separately for the two grade groups. As noted, 92 individual items comprise the measurement of the internal and external developmental assets. There are 50 items for the measurement of external assets and 42 items for internal assets. One internal asset item (No. 132: “Imagine that someone at your school hit you or pushed you for no reason. What would you do?”) was excluded from the analyses because, in contrast to the other items in the survey, the responses were nominal and not ordinal or interval. As a result, 91 items were included in the factor analysis to determine the empirical structure of the developmental asset items. Both orthogonal and oblique factor analyses were conducted. Both methods yielded similar results. The primary difference was the strength of the loading of individual items on scales. The data presented are based on Promax rotational procedures along with a root 1 criterion for extraction of factors. The Promax solution was retained as the scales are theoretically believed to be correlated. Scales were retained if they included a minimum of three items that had individual loadings of .30 or above. Results of the exploratory factor analysis were confirmed with the cross-validation sample. Exploratory factor analytic procedures were conducted with the sample of 9th- to 12th-grade students. The factor structure that emerged differed from that of the 6th- to 8th-grade students; thus, further analyses were only conducted with the early adolescent students. Further analyses will be conducted to examine the factor structure of the asset items across the adolescent years. The next step in data analysis was examination of the relationship between the empirically based factors that emerged during the factor analysis of the 91 asset items. Mean scale scores were computed for each of the factors by summing the individual items (with factor loadings ±.30) that comprised the factor and dividing by the total number of items. Internal consistency of the scales was measured with Cronbach’s coefficient alpha (Cronbach, 1951). Mean-scale scores were correlated with factor scores and also correlations were examined among the individual scales. A second exploratory factor analysis was conducted with the scale scores to examine if the scales loaded on different conceptual factors (e.g., internal vs. external assets). Again, both orthogonal and oblique rotation methods were conducted and, once more, they yielded similar results. The Promax solution was retained because of the
Theokas et al. / CONCEPTUALIZING THRIVING
123
belief that the second-order factors were significantly correlated with one another. Finally, the structural relationships among first- and second-order asset categories and the thriving index were examined. Regression analyses and multivariate analysis of variance were used to understand which asset categories best predicted and accounted for the variance in the thriving behavior composite. RESULTS First-Order Factor Structure of PSL-AB Asset Items The dimensionality of the 91 asset items included in the PSL-AB survey was analyzed, for middle school youth in Group 1, using principal axis factoring. As noted above, both orthogonal and oblique factor rotation methods were employed. The results of the two methods yielded similar results, with slight differences noted in the order and magnitude of the item loadings within each factor. For example, four of the resulting factors with the Varimax solution had an additional item that loaded significantly on the factor, as compared to the Promax solution. In two of the four cases, the item was not conceptually matched with the factor. Furthermore, the Varimax solution yielded one factor including all items pertinent to families and parents. In the Promax solution, the items regarding families and parents were split between a scale representing connection to family and a scale including items regarding parent involvement in school. The similarity of the results of these two factor-analytic approaches is evidence of a strong structure inherent in the items. Given the expectation that the factors would be correlated and appropriate for a second-order exploratory factor analysis, the Promax solution was retained. The initial factor solution yielded 15 interpretable factors, with eigenvalues greater than 1.0 and with three or more individual items loading (±.30) on each factor. The factors accounted for 50.69% of the variance. Sixteen items did not load significantly on any factor, and one item was not conceptually consistent with the factor that it loaded on. A second principal axis exploratory factor analysis, with Promax rotation, was conducted with the resulting 74 items. This solution yielded 14 interpretable factors with initial eigenvalues greater than 1.0, with at least three items that had significant and unique factor loading greater than ±.30 on each factor. One item loaded significantly and meaningfully on two factors (No. 129: “Frequency you feel afraid of getting hurt at home”). This item was retained on the factor (Contex-
124
JOURNAL OF EARLY ADOLESCENCE / February 2005
tual Safety) for which it improved the internal consistency of the scale and was removed from the factor for which it decreased the reliability of the scale (Connection to Family). This model explained 53.65% of the variance. One difference was noted between the original solution and the final model. Two separate factors in the original solution combined to form one factor in the final model with the removal of items with insignificant loadings. Conceptually, the two factors in the initial solution represented (a) appreciates racial or ethnic diversity and (b) interpersonal values and competence. The factors were assigned labels using item content. Table 3 presents a list of the factors, a representative item, total number of items in the factor, and the rotated eigenvalue. The results of Group 1 were cross validated with Group 2 middle school students. The same factor structure emerged with only slight differences noted with the saliency of individual-item loadings on factors. The results of Group 1 were also compared with the results of Group 3, a random sample of high school students. The structure that emerged was conceptually similar to that of the middle school students. However, differentiation of scales that could not be reliably discriminated in the middle school version occurred, yielding 16 meaningful and interpretable scales. Whereas appreciates diversity and interpersonal skills and values could not be differentiated in the middle school population, in the high school sample, the two scales had discrete item loadings. Moreover, an additional scale comprising items related to planning and decision making (that were removed from the prior analyses because of insignificant loading values) emerged as a meaningful factor with the older students. In addition, single items that did not meet item loading criteria (±.30) achieved significance in the high school sample. The saliency of factors was also slightly modified. Given the structural differences in the two samples, further analyses were only conducted with Group 1 middle school students. Further research will be directed toward understanding the potential developmental changes in the factor structure of the asset items. Second-Order Factor Structure Analysis Search Institute’s model suggests that the first-order asset scales are interrelated. In particular, it is hypothesized that about half of the items are strengths, processes, and dispositions arising within the individual (internal assets) and that half of the items are external assets that are provided to the individual from the context (families, other adults, peers, schools, and communities). The factor correlation matrix from the first-order factor analysis
125
7.89 7.22 6.99 9.12 3.76 8.35 6.12 10.28 4.88 11.4 8.8 7.8 7.04 1.8
Eigenvalue Degree important to reduce hunger and poverty in the world On the whole, I like myself Amount close friends drink alcohol Adults in town listen to what I say Frequency parents ask about homework Degree like me- care about others feelings Number of adults give you lots of encouragement Teachers push me to be my best Hours per week—nonsport school club or organization Get along well with parents Degree important—do what I believe is right My family has clear rules for conduct Frequency come to class without books Frequency afraid—get hurt by someone at school
Representative Item
Factor Structure Identified With Descriptive Features
Social conscience Positive identity Risk avoidance Community connection Parent involvement Interpersonal values Adult mentors School connection Activity participation Connection to family Personal values Rules and boundaries School engagement Contextual safety
Label
TABLE 3:
6 6 7 5 5 6 4 7 6 6 5 4 4 3
# Items
126
JOURNAL OF EARLY ADOLESCENCE / February 2005
displays multiple medium to large correlations between factors supporting the conceptualization of second-order factors (see Table 4). Specifically, large correlations (> .60) were noted between Social Conscience and Personal Values and between Social Conscience and Interpersonal Values. Positive Identity and Expectations and Boundaries were strongly related to Connection to Family and, also, School Connection and Community Connection were highly correlated. It is theoretically quite important to note that the empirically identified factors do not exclusively contain either internal asset items or external asset items. For example, an internal asset item (“I care about the school I go to”) is grouped with external asset items regarding a caring school climate (e.g., “I get a lot of encouragement at my school”) and forms the Connection to School scale. Of course, all items are self-report and represent perceived assets, thus, it is difficult to conceptually distinguish exclusively internal or external processes. Perceptions of external assets are not independent measures of external assets; they are individual level measures that may reflect scores pertinent to the views of youth regarding their integrative relationships with the settings within which they act. Moreover, developmental systems theory suggests it is the bidirectional adaptive regulations between person and context that drive development. The items previously described in the Connection to School scale reflect these bidirectional relations by including how the individual responds to the setting and how the setting reacts to the individual. A thriving young person should be part of a structured whole with a goodness of fit between internal and external setting conditions for positive youth development. Nevertheless, seven factor scales that emerged in the first-order analysis represent constructs pertaining to the individual, his or her behavior, and feelings about himself or herself with the seven additional scales representing one or more layers of the multitiered context in the developmental system. Scales reflective of individual behavior and attributes include Social Conscience, Risk Avoidance, Positive Identity, Interpersonal Values, Activity Participation, and Personal Values. Scales representing external setting conditions, support, or resources provided to the individual include Community Connection, Parent Involvement, School Connection, Adult Mentors, Rules and Boundaries, Connection to Family, and Contextual Safety. A second-order factor analysis was conducted with the factors that emerged in the first exploratory factor analysis to determine if a superordinate factor structure would emerge. Given the correlations among factors and the multiple small loadings of items on multiple factors, mean scale scores were computed for each individual on each factor to reduce the measurement redundancy that might occur with the computed factor scores.
127
.986
1 2 3 4 5 6 7 8 9 10 11 12 13 14
.175 .926
2 .343 .263 .921
3 .373 .519 .374 .977
4 .134 .280 .106 .276 .935
5 .566 .319 .344 .427 .135 .976
6 .274 .366 .193 .439 .242 .429 .989
7 .483 .471 .497 .639 .254 .507 .372 .968
8
NOTE: Diagonal is correlation between factor scores and scale summary scores.
1
Factor Correlation Matrix for First-Order Exploratory Factor Analysis
Factor
TABLE 4:
.362 .177 .266 .365 .181 .440 .407 .352 .957
9 .414 .616 .519 .629 .466 .483 .434 .657 .301 .488
10 .668 .284 .473 .375 .156 .564 .297 .536 .354 .550 .542
11
.413 .305 .491 .437 .328 .450 .330 .590 .306 .632 .539 .370
12
.354 .387 .569 .401 .077 .459 .316 .556 .326 .548 .509 .389 .899
13
–.255 .208 –.201 –.010 .007 –.182 –.014 –.133 –.215 –.096 –.287 –.268 –.096 .485
14
128
JOURNAL OF EARLY ADOLESCENCE / February 2005
The diagonal in Table 4 shows the correlations between factor scores and scale summary scores. Factor-score and scale-summary-scores correlations range from .370 and .986, with the majority being large correlations. Scale summary score statistics including Cronbach’s alpha reliability are displayed in Table 5. Mean scores are generally moderate to high with 12 of the 14 reliabilities in the excellent range. The two scales with moderate reliabilities are Rules and Boundaries and School Engagement. The Rules and Boundaries scale crosses multiple external contexts. The low reliability suggests that the external setting conditions may vary in the saliency of rules and boundaries provided to the youth. The School Engagement scale is comprised of items regarding preparation for school and effort in school. Response scales vary for the items comprising this factor. Principal axis factoring with Promax rotation yielded a two-factor solution in three iterations, accounting for 48% of the variance. Twelve of the 14 scales loaded significantly on only one of the factors (see Table 6). Two scales did not discriminate well between factors and loaded on both factors, but each had a higher loading on the second factor. The first second-order factor was comprised of six of the seven scales pertaining to the individual (Social Conscience, Personal Values, Interpersonal Values, Risk Avoidance, Activity Participation, and School Engagement) and one external setting scale, Rules and Boundaries. It seems these middle school youth have internalized the rules and boundaries present in their ecologies, leading to more similarity with their individual values and behaviors. Rules and Boundaries might work to promote the other individual activities and behaviors. The opposite pattern was noted on the second-order factor. Positive Identity, a scale describing an individual’s feelings regarding him or herself, loaded with six scales detailing perceptions of external setting conditions, Connection to Family, Community Connection, Parent Involvement, School Connection, Contextual Safety, and Adult Mentors. The theoretical cross specification of this scale can be interpreted that a youth’s identity is so closely linked to their bi-directional interactions with the multiple layers of their context (e.g., involvement in adaptive developmental regulations) that it cannot be empirically identified as separate from the context. The two factors were significantly correlated (r = .640). Although two scales were theoretically cross specified on each factor, the factors were labeled Individual Assets and Ecological Assets, respectively, representing the overall conceptual integrity of the scale. However, based on the concept of adaptive developmental regulation (Lerner, 2004) and the empirical presence of one cross specified scale on each second-order factor, it seems clear that the Individual Assets second-order factor actually represents a bidirectional relation between the individual and the context, where
129
1.00 1.00 1.00 1.00 1.00 1.00 1.00 –2.28 1.00 1.00 1.00 1.00 –2.68 1.00
5.00 5.00 5.00 5.00 5.00 5.00 5.00 1.43 6.00 5.00 5.00 5.00 .93 5.00
Maximum 3.80 3.82 4.10 3.33 3.76 3.62 3.40 0.00 2.18 3.97 3.89 3.83 0.00 4.56
X .82 .79 .72 .87 .78 .82 1.1 .66 .84 .80 .83 .72 .69 .62
SD –.74 –.62 –1.05 –.32 –.70 –.57 –.41 –.50 1.00 –1.06 –.87 –.60 –.70 –1.93
Skewness .25 .13 .92 –.03 .32 .09 –.80 .07 1.24 1.16 .53 .40 .38 4.12
Kurtosis
.847 .802 .760 .841 .723 .802 .850 .790 .660 .824 .805 .604 .634 .800
Cronbach’s
a. The School Connection and School Engagement scales are standardized as the item response formats vary for individual items included in the scales.
Social Conscience Positive Identity Risk Avoidance Community Connection Parent Involvement Interpersonal Values Adult Mentors a School Connection Activity Participation Connection to Family Personal Values Rules and Boundaries a School Engagement Contextual Safety
Minimum
Summary Scale Statistics (N = 50,000)
Summary Scale
TABLE 5:
130
JOURNAL OF EARLY ADOLESCENCE / February 2005
TABLE 6:
Hierarchical Factor Structure of the Second-Order Factors
Factor Summary Scale 1 11 6 3 9 12 13 10 2 4 5 8 14 7
Label Social Conscience Personal Values Interpersonal Values Risk Avoidance Activity Participation Rules and Boundaries School Engagement Connection to Family Positive Identity Community Connection Parent Involvement School Connection Contextual Safety Adult Mentors
1 .897 .812 .657 .437 .405 .355 .333
.348 –.315
2
.747 .744 .591 .507 .455 .431 .344
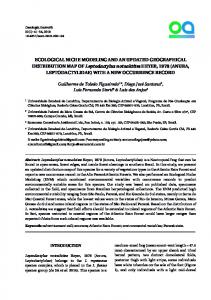
the emphasis is on the individual contribution to the relation. In turn, on the Ecological Assets second-order factor the emphasis is on the context’s contribution to the relation. However, for youth thriving to occur, both types of contributions must be fused. Figure 1 illustrates this dynamic. Girls report higher scores on both factors. Girls have slightly higher Individual Asset scores (mean = .25) than Ecological Asset scores (mean = .05), whereas boys have slightly higher Ecological Asset scores (mean = –.05) than Individual Asset scores (mean = –.25). Age is negatively correlated with both Individual Assets (r = –.224) and Ecological Assets (r = –.203). Mother’s education level, a proxy for socioeconomic status2 was not correlated with the factor score for Individual Assets (r = .056) or the factor score for Ecological Assets (r = .069). Prediction of Second-Order Factors on the Thriving Composite Index A set of multiple regression models were tested to evaluate the best predictors and overall solution for the prediction of thriving. The criterion variable was the thriving score composite created from standardizing, summing, and finding the mean of the seven individual thriving behavior questions included on the PSL-AB. The predictors that were tested included the two factors scores (Individual Assets and Ecological Assets) obtained from the
Theokas et al. / CONCEPTUALIZING THRIVING
Social Conscience
Connection to Family
Personal Values
Community Connection
Interpersonal Values Rules and Boundaries
Risk Avoidance
131
School Connection Contextual Safety Adult Mentors Positive Identity
School Engagement Activity Participation
Parent Involvement
Figure 1: The fusion of internal and external setting conditions for PYD: Ecological assets and individual assets are linked through the presence within each asset set of a variable that constitutes an attractor of the other asset set. NOTE: PYD = positive youth development.
second-order factor analysis of the empirically derived scales from the PSLAB and three demographic variables—mothers’ education level, age, and gender. For the gender variable, boys were coded 0 and girls were coded 1. Table 7 presents the seven models tested. Model 2 represents the most parsimonious model predicting the thriving composite. First, the Ecological Assets factor score was entered in Model 1, followed by the Individual Assets factor score in Model 2. The initial model accounts for 28% of the variance in the thriving index. The inclusion of Individual Assets improves the model fit (R2 = .384). The two factor scores are moderately correlated and share a significant portion of variance, but over and above the relationship between Ecological Assets, Individual Assets adds predictive validity to the model. The standardized beta coefficients indicate a stronger relationship between Individual Assets and the thriving index. The interaction between Individual Assets and Ecological Assets was added in Model 3. The interaction between Individual Assets and Ecological Assets does not contribute much to the goodness of fit of the model (less than a 1% increase in R2), although it is a significant predictor. It was not retained in the model, as the significance of the predictor was a result of the large sample size.
132 .289 .420
R2 SSE .384 .391
.000 .206*** .453***
M2
.386 .390
.000 .210*** .462*** .044***
M3
.386 .389
.038***
–.05 .202*** .455***
M4
Model
.387 .390
.052***
–.324 .210*** .461***
M5
NOTE: OLS = ordinary least squares; SES = socioeconomic status; SSE = sum of squared errors. ***p < .0001.
.000 .537***
M1
.385 .390
–.027***
.040 .198*** .466***
M6
.393 .388
–.425 .203*** .486*** .044*** .041*** .057*** –.027***
M7
Standardized Beta Coefficients, Approximate p values, and Associated Goodness of Fit Statistics for a Nested Taxonomy of OLS-fitted Regression Models That Describe the Relationship Between Thriving and Individual and Ecological Assets Controlling for Age, SES, and Gender (N = 50,000)
Intercept Ecological assets Individual assets Individual × Ecological SES Age Gender
TABLE 7:
Theokas et al. / CONCEPTUALIZING THRIVING
133
0.6
Thriving Behavior
0.4 0.2 Low Eco Assets
0
Middle Eco Assets High Eco Assets
-0.2 -0.4 -0.6 Low
Middle
High
Individual Assets
Figure 2: Relationship between levels of individual and ecological assets and the thriving behaviors composite score.
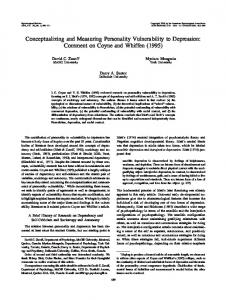
A follow-up two-way ANOVA was conducted to elucidate the relationship between Individual Assets and Ecological Assets and thriving behaviors. A 3 × 3, between-between, fixed effects ANOVA was conducted to evaluate the effects of three levels of Individual Assets (low, medium, high) and three levels of Ecological Assets (low, medium, high) on the thriving composite score. The levels of Individual Assets and Ecological Assets were determined by finding the lowest 25% (low group), the middle 25% through 75% of the sample (middle group), and the highest quartile 75%+ (high group). The ANOVA indicated a significant main effect for both Individual Assets and Ecological Assets, as would be anticipated from the results of the regression analysis. There was also a significant effect for the interaction term (F(4,49,974) = 20.3, p = .000); however, the effect size was again negligible η2 = .002. Figure 2 displays the relationship between Individual Assets and Ecological Assets. Having high assets in either domain improves thriving behaviors, even if assets are low in the other domain. Having low assets in both domains produces the lowest amount of thriving, and high assets in both domains produces the greatest amount of thriving behaviors. However, when Individual Assets are high, there is little discrimination in thriving behaviors between the low and medium Ecological Assets groups. High Ecological Assets in combination with High Individual Assets improves thriving behaviors over and above low or medium Individual Assets.
134
JOURNAL OF EARLY ADOLESCENCE / February 2005
The three demographic variables were entered one at a time in each of the three remaining models (M4 through M6). None were retained in the final model, as they did not improve the goodness of fit of the model. Each predictor was significant because of the large sample size, but the effect size was minimal. The three demographic variables combined accounted for approximately 1% of the variance in the prediction of thriving. Model 7 displays the full model with all variables entered simultaneously. Relationship Between First-Order Asset Factors and the Composite Thriving Index To examine if certain individual or ecological assets were more strongly related to increases in thriving behaviors, multiple analyses were conducted to look at the relationship between level of thriving and scores on each of the first-order asset scales. The thriving index was split into three groups: the lowest quartile (low), the two middle quartiles (middle), and the upper quartile (high). A one-way MANOVA was conducted to determine the effect of level of thriving on the seven dependent variables that define the Individual Assets factor. Significant differences were found among the three levels of thriving Wilks’ lambda = .66, F(14,99958) = 1663, p < .001. The partial η2 was .19. Table 8 contains the means, standard deviations, and effect sizes for each dependent variable for the three levels of thriving. Univariate analyses of variance for each dependent variable were conducted as follow-up tests for the MANOVA. Using the Bonferonni method to correct for experiment-wise error when running multiple tests, each ANOVA was tested at the p < .005 level. All ANOVAs were significant at the p < .001 level. Interpersonal Values, Activity Participation, and Personal Values had the highest effect sizes. Post hoc analyses for the univariate ANOVAs for the individual asset scales consisted of conducting pairwise comparisons to find which level of thriving affected scores most strongly. Each pairwise comparison was tested at the .001 level (.005 divided by 3). All groups significantly differed from one another. A second MANOVA was computed with the same three thriving groups (low, middle, high) with the seven dependent variables that define the Ecological Asset scale. Again, significant differences were found among the three levels for thriving Wilks’ lambda = .74, F(14,99958) = 1136, p < .001. The partial η2 was .14. Table 9 contains the means, standard deviations, and effect sizes on each dependent variable for the three groups. The effect size for Positive Identity was the largest. The effect size for Contextual Safety was negligible. Univariate analyses of variance on each dependent variable were conducted as follow-up tests for the MANOVA. Using the Bonferonni
Theokas et al. / CONCEPTUALIZING THRIVING
TABLE 8:
Means, Standard Deviations, and Effect Sizes on the Individual Asset Dependent Variables for the Three Levels of Thriving
Asset Scale Social Conscience Risk Avoidance Interpersonal Values Activity Participation Personal Values Rules and Boundaries School Engagement
TABLE 9:
135
Level 1
Level 2
Level 3
X
SD
X
SD
X
SD
Partial
3.36 3.72 3.06 1.75 3.41 3.57 2.60
.90 .73 .87 .65 .93 .77 .49
3.83 4.15 3.65 2.13 3.93 3.84 2.89
.74 .66 .71 .74 .73 .68 .42
4.19 4.40 4.11 2.70 4.32 4.08 3.09
.65 .58 .61 .93 .62 .67 .38
.130 .114 .204 .162 .153 .063 .141
2
Means, Standard Deviations, and Effect Sizes on the Ecological Developmental Dependent Variables for the Three Levels of Thriving
Asset Scale Positive Identity Community Connection Adult Mentors School Connection Connection to Family Contextual Safety Parent Involvement
Level 1
Level 2
Level 3
X
X
X
SD
Partial
4.22 3.78 3.98 3.68 4.33 4.61 4.06
.66 .81 .96 .62 .66 .57 .68
.151 .135 .133 .137 .129 .005 .084
SD
3.36 .80 2.88 .85 2.80 1.1 2.97 .68 3.53 .85 4.50 .70 3.42 .84
SD
3.85 .72 3.34 .78 3.41 1.1 3.37 .62 4.00 .73 4.56 .60 3.77 .73
2
method, each ANOVA was tested at the p < .005 level. All ANOVAs were significant at the p < .001 level. Post hoc pairwise comparisons between the three thriving levels for each dependent variable were all significant, at the p < .001 level, indicating that the three groups all differed significantly from one another. DISCUSSION The purpose of this study was to test ideas derived from developmental systems theory regarding the thriving process and the integration of individual and ecological assets to promote positive youth development. Thriving youth are engaged in mutually beneficial interactions with their multilevel
136
JOURNAL OF EARLY ADOLESCENCE / February 2005
context. These individual ↔ context relations support the individual development of youth and the development of social institutions and civil society (Lerner, 2004). Balancing the effects of the person on the context and the effects of the context on the person in ways that support healthy, positive changes in both are termed adaptive developmental regulations (Brandstädter, 1998). This regulation of individual and context can only be assessed across time; however, cross-sectional data can identify behaviors that reflect developmental competencies (e.g., school success) and socially valued behavior (e.g., prosocial behavior, leadership), termed thriving behaviors, and can assess if the range and level of behaviors in youth reflect a state of well-being that is consistent with such regulation (Bornstein et al., 2003; Lerner et al., 2003). For instance, one can appraise whether these behaviors covary with perceived individual and ecological assets in a pattern consistent with this notion within developmental systems theory. An existing dataset, PSL-AB survey administered by Search Institute in hundreds of communities across the United States in 1999 through 2000, was reanalyzed to derive the first- and second-order empirical structure of 91 items designed to assess self-perceived assets within the individual and the multiple layers of his or her context. Substantively, items represent youth actions (e.g., amount of time involved in youth programs), beliefs (e.g., satisfaction with oneself), and values (e.g., degree it is important to do what one believes is right), as well as youth perceptions of external setting conditions (e.g., “I get a lot of encouragement at school,” “I have lots of good conversations with my parents,” “Adults in town make me feel important”). Exploratory factor analysis yielded 14 conceptually meaningful scales (e.g., Positive Identity, Social Conscience, Connection to Family, Adult Mentors, and Contextual Safety) for middle school youth. A more differentiated factor structure was present for high school youth, thus, further analyses were conducted with only middle school youth. The derived scales descriptively represented youth choices (e.g., Risk Avoidance), youth beliefs (e.g., Personal Values), youth connection to people (e.g., Connection to Family) and institutions (e.g., School Connection), and perceived contextual resources (e.g., Adult Mentors). Items within scales that were representative of social connections included items that reflected both the actions of the context and the actions of the youth, thus capturing the bidirectional regulatory relations specified in developmental systems theory. There were significant correlations between the scales to suggest a higher order structure present in the data, and, moreover, the scales could be divided into either the Individual (7) or Ecological (7) domain. A second-order exploratory factor analysis indeed yielded a two-factor solution. Twelve of the 14 scales were able to be theoretically associated with Individual Assets
Theokas et al. / CONCEPTUALIZING THRIVING
137
or Ecological Assets and to load on their appropriate second-order factor. However, two scales, Positive Identity and Rules and Boundaries loaded on the opposite constructs. It is possible to view these two cross-specified factors as evidence of the weakness of the factor solution and as reflecting problems with the Search Institute asset framework or its pool of items. However, we view this finding as relevant to an important feature of developmental systems theory. Developmental systems theory indicates that it is the fusion, or integration, of internal and external setting conditions that promotes positive development. The commingling of scales captures this feature of the developmental system. For example, Positive Identity, a scale capturing youth’s feelings about themselves and their future, loads significantly with the scales pertaining to youths’ connection with family, school, and community and, also, to the presence of adult mentors and perceived safety. In these middle school youth, it seems that their individual identities are inherently linked with their experiences in external-setting conditions. Respecification of the model with this construct loading on the Individual domain does not provide a good fit for the data. Similarly, perceived Rules and Boundaries from the settings within which youth interact was empirically linked with youth values and school and activity engagement. Although youth were asked about rules present in external settings, it seems youth have internalized these standards and expectations, and, thus, a strong relationship emerges between these perceptions and their actual actions and personal and social values. There can be no pure discrimination between internal and external settings in a youth who is actively engaging and is engaged by the context. From a developmental-systems perspective, there must be integration between the setting conditions for positive youth development and the attributes of such functioning (Lerner, 2004). If there were no such integration, then the person would not be adaptively fused within the multiple levels of the system. In the case of these youth, it seems there is a good fit between individual and context. Additional analyses more fully explored the relationship between Individual Assets and Ecological Assets, as empirically identified, by examining their individual and combined predictive ability with a summary score of thriving behaviors. The thriving summary score represents an individual’s functioning across a number of indicators at a particular point in time. Individuals are not expected to be perfect and have high scores across all indicators, nor do all contexts offer opportunities for, or demand, all instances of thriving behaviors at all times. The combined score for an individual reflects their overall functioning and development of a subset of socially valued
138
JOURNAL OF EARLY ADOLESCENCE / February 2005
behaviors. Adolescence is a time of trying out new roles, experimenting with behaviors, and developing a stable sense of self (Lerner, 2002). Thus, intraindividual differences in behaviors during this negotiation process will emerge. For example, an adolescent with his or her first job and independent source of income may not be able to delay gratification (a thriving indicator) and keep from spending money right away. However, it may be that adult mentors model financial decision making and balancing competing needs, and also new competencies emerge (e.g., learning to balance a checkbook in a life skills class) that support the development of this thriving indicator. There exists in society the expectation that, across time, as adolescents have more experiences and abilities, these thriving behaviors will grow and reflect a goodness of fit between the individual’s strengths and the demands and resources of the context. Both domains of assets contributed unique variance to the thriving composite, with the individual assets factor more strongly predictive of thriving. Individual assets are more proximal to the measurement of individual behaviors than are ecological assets, which may account for the stronger relationship. For example, a young person who is actively engaged in multiple clubs and activities is more likely to have leadership opportunities and opportunities to help others. Similarly, there is conceptual similarity between a young person with strong character values and a youth who values diversity. Individual dispositions are more closely tied to individual engagement in actions. In turn, ecological assets provide the setting conditions or supportive environment to prime the development of thriving behaviors and, thus, is a more distal measurement. For example, supportive relationships and the presence of mentors are anticipated to encourage school success and overcoming adversity, but do not necessarily provide opportunities for such behavior. As such, ecological assets should and do contribute unique variance to the predication of thriving and, when combined with individual assets, maximize thriving outcomes. The combined relationship of individual and ecological assets to the prediction of thriving, and as well as the close relationship between positive identity and the scales that represent connections with social contexts, suggests that when we invest in policies and programs that build and mobilize the energies of individuals and institutions, we are making a good investment in the thriving of youth and society. Furthermore, the findings suggest that high assets in either domain contribute to higher levels of thriving. Thus, intervention can occur at either level. Policy makers and practitioners may not be limited to or required to allocate resources across multiple levels to effect positive development; rather, targeted interventions that
Theokas et al. / CONCEPTUALIZING THRIVING
139
are unique to the community and resources available may be developed and applied for positive benefits. Moreover, both sets of asset scales were more predictive of thriving behaviors than demographic variables, including socioeconomic status, age, or gender which, in total, accounted for less than 1% of the variance in thriving. The large sample size had the power to detect even small differences; however, the effect sizes for each of the variables were negligible. In contrast, the assets scales that reflected an adolescent’s perceptions of the bidirectional exchanges between themselves and their contexts were associated with substantial effect sizes on thriving behaviors. Future research will examine if the asset scales and hierarchical structure identified is generalizable across all racial or ethnic groups, as it appears to be for socioeconomic levels. The results of the current analyses are, of course, dependent on the items included in the PSL-AB survey and, therefore, may not capture the full nature of the thriving construct or of individual and ecological assets. For example, the seven thriving behavior indicators are not inclusive of all desired outcome behaviors within young people. For example, Dowling, Gestdottier, Anderson, von Eye, Almerigi, et al. (2003) and Dowling, Gestdottier, Anderson, von Eye, & Lerner (2003) employed other data sets in the Search Institute archives and identified different dimensions of thriving (see, also, King et al., 2005). For instance, some of the dimensions of thriving identified by Dowling, Gestoditier, Anderson, von Eye, & Lerner (2003) included Presence of a Moral Compass, Path to a Hopeful Future, and Search for a Positive Identity. Moreover, expectations for youth behavior may change with age. For example, expectations for a middle school youths’ prosocial behavior (currently operationalized as frequency of time spent helping others) may be operationalized quite differently than that of an older adolescent who has more autonomy to make choices and commit to a project or service in the community. In addition, the motivation to engage in such behaviors may differ for different age children. For example, high school youth may engage in activities to build their resumes for college and not for altruistic reasons. This variation in motivation or developmental appropriateness of activities might account for the different factor structure of the asset items observed for the high school students. Furthermore, all measures in the present data set are self-report and, as such, reflect individual level assessment of perceived conditions within the multitiered developmental system. There is no triangulation of measurement of external-setting conditions or behaviors of youth from other reporters such as parents, teachers, or youth program leaders. Similarly, youth report on sin-
140
JOURNAL OF EARLY ADOLESCENCE / February 2005
gle behaviors within thriving domains. For example, leadership is measured by the number of times a youth has held a leadership position in a group or organization. However, leadership can be demonstrated in many ways; for example, a youth can be a leader in the classroom by listening and accepting other’s opinions or by being a member of a team who demonstrates good values and is a role model for other players about how to interact with more junior members (see Damon, 1997). Despite some limitations of measurement, the current results suggest future directions for research to continue to explicate the regulatory relationship that exists between individual and context that promotes positive development. In particular, work needs to be done to differentiate individual assets, as a setting condition for positive youth development, from measurement of individual thriving behaviors. An individual who is thriving will be giving back to self and developing new competencies and behaviors. In addition, care must be taken to understand the interactions and, indeed, the fusion that exist between individual and ecological assets. Youth who are adaptively functioning across time with their environments are youth who will be engaged and contributing to self, family, community, and civil society, thus making it difficult to unearth pure individual or ecological assets. In fact, the two cross-specified factors identified in the present research attest to this difficulty. Objectively measuring the resources present in the multiple contextual niches of individuals could add a significant dimension to the work, enabling better understanding of how actual setting conditions contribute to an individual’s connection to his or her environment and ultimate positive development (Theokas & Lerner, 2005). Second, the preliminary analyses conducted to explicate the factor structure of the asset items in the PSL-AB highlighted the possible developmental significance of certain items and scales and as well as the emergence of different constructs related to the age of the survey respondents. Future research should continue to examine how youth of different ages think of, and are able to differentiate, assets within themselves or the environment. Increasing cognitive abilities and changing social experiences might result in a reorganization of perceived assets or, indeed, a greater fusion of constructs. The research might also explicate the sex differences noted in the current sample. Finally, longitudinal analyses are needed to determine the rate of change and growth of functional adaptive behaviors in individuals and among individuals to understand thriving as a process of mutually beneficial individual ↔ context relations (Lerner, 2004), one that may culminate in young people becoming actively engaged citizens contributing effectively to civil society.
Theokas et al. / CONCEPTUALIZING THRIVING
141
NOTES 1. Given that the majority of the sample is European American and also the large sample sizes used for the analyses would identify significant differences, despite psychologically meaningless effect sizes, race or ethnicity is not examined specifically in any of the subsequent analyses. Future analyses will be conducted to determine if the present results can generalize to all cultural groups. 2. Students reported mother’s educational attainment ranging from 1 (completed grade school or less) through 6 (graduate or professional school after college; mean = 4.5; SD = 1.5). Past research has used this indicator as a proxy for socioeconomic level (Glasgow, Dornbusch, Troyer, Steinberg, & Ritter, 1997).
REFERENCES American Psychiatric Association. (1994). Diagnostic and statistical manual of mental disorders (4th ed.). Washington, DC: Author. Baltes, P. B., Lindenberger, U., & Staudinger, U. M. (1998). Life-span theory in developmental psychology. In W. Damon (Series Ed.) and R. M. Lerner (Vol. Ed.), Handbook of child psychology: Theoretical models of human development (5th ed., Vol. 1, pp. 1029-1144). New York: Wiley. Benson, P. L. (1997). All kids are our kids: What communities must do to raise caring and responsible children and adolescents. San Francisco, CA: Jossey-Bass. Benson, P. L. (2003). Developmental assets and asset building communities: Conceptual and empirical foundations. In R. M. Lerner & P. L. Benson (Eds.), Developmental assets and asset-building communities: Implications for research, policy, and practice (pp. 19-43). Norwell, MA: Kluwer Academic. Benson, P. L., Leffert, N., Scales, P. C., & Blyth, D. A. (1998). Beyond the “Village” rhetoric: Creating healthy communities for children and adolescents. Applied Developmental Science, 2(3), 138-159. Benson, P. L., Scales, P. C., & Mannes, M. (2003). Developmental strengths and their sources: Implications for the study and practice of community building. In R. M. Lerner, F. Jacobs, & D. Wertlieb (Eds.), Handbook of applied developmental science: Applying developmental science for youth and families: Historical and theoretical foundations (Vol. 1, pp. 369-406). Thousand Oaks, CA: Sage. Bornstein, M. H., Davidson, L., Keyes, C. M., Moore, K., & the Center for Child Well-Being (Eds.). (2003). Well-being: Positive development across the life course. Mahwah, NJ: Lawrence Erlbaum. Brandtstädter, J. (1998). Action perspectives on human development. In W. Damon (Series Ed.) & R. M. Lerner (Vol. Ed.), Handbook of child psychology: Theoretical models of human development (5th ed., Vol. 1, pp. 807-863). New York: Wiley. Cronbach, L. (1951). Coefficient alpha and the internal structure of tests. Psychometrika, 16, 297-334. Damon, W. (1997). The youth charter: How communities can work together to raise standards for all our children. New York: Free Press.
142
JOURNAL OF EARLY ADOLESCENCE / February 2005
Damon, W., Menon, J., & Bronk, K. C. (2003). The development of purpose during adolescence. Applied Developmental Science, 7, 119-128. Dowling, E. M., Gestsdottier, S., Anderson, P. M., von Eye, A., Almerigi, J., & Lerner, R. M. (2003). Structual relations among spirituality, religiosity, and thriving in adolescence. Applied Developmental Science, 8(1), 7-16. Dowling, E. M., Gestsdottier, S., Anderson, P. M., von Eye, A., & Lerner, R. M. (2003). Spirituality, religiosity, and thriving among adolescents: Identification and confirmation of factor structures. Applied Developmental Science, 7(4), 253-260. Dryfoos, J. G. (1990). Adolescents at risk: Prevalence and prevention. New York: Oxford University Press. Eccles, J. S., & Gootman, J. A. (Eds.). (2002). Community programs to promote youth development. Washington, DC: National Academy Press. Erikson, E. (1968). Identity, youth, and crisis. New York: Norton. Freud, A. (1969). Adolescence as a developmental disturbance. In G. Caplan & S. Lebovici (Eds.), Adolescence (pp. 5-10). New York: Basic Books. Glasgow, K. L., Dornbusch, S. M., Troyer, L., Steinberg, L., & Ritter, P. L. (1997). Parenting styles, adolescents’ attributions, and educational outcomes in nine heterogeneous high schools. Child Development, 68, 507-529. Hall, G. S. (1904). Adolescence: Its psychology and its relations to physiology, anthropology, sociology, sex, crime, religion, and education. New York: Appleton. Keyes, C. L. (2003). Complete mental health: An agenda for the 21st century. In J. Haidt (Ed.), Flourishing (pp. 293-312). Washington, DC: American Psychological Association. King, P. E., Dowling, E. M., Mueller, R. A., White, K., Schultz, R. M., Osborn, P., Dickerson, E., Bobek, D. L., Lerner, R. M., Benson, P. L., & Scales, P. C. (2005). Thriving in adolescence: The voices of youth-serving practitioners, parents, and early and late adolescents. Journal of Early Adolescence, 25(1), 94-112. Larson, R. (2000). Toward a psychology of positive youth development. American Psychologist, 55(1), 170-183. Leffert, N., Benson, P. L., Scales, P. C., Sharma, A. R., Drake, D. R., & Blyth, D. A. (1998). Developmental assets: Measurement and prediction of risk behaviors among adolescents. Applied Developmental Science, 2(4), 209-230. Lerner, R. M. (1995). America’s youth in crisis: Challenges and options for programs and policies. Thousand Oaks, CA: Sage. Lerner, R. M. (1998). Theories of human development: Contemporary perspectives. In W. Damon (Series Ed.) & R. M. Lerner (Vol. Ed.), Handbook of child psychology: Theoretical models of human development (5th ed., Vol. 1, pp. 1-24). New York: Wiley. Lerner, R. M. (2002). Concepts and theories of human development (3rd ed.). Mahwah, NJ: Lawrence Erlbaum. Lerner, R. M. (2004). Liberty: Thriving and civic engagement among America’s youth. Thousand Oaks, CA: Sage. Lerner, R. M., Lerner, J. V., Almerigi, J., Theokas, C., Phelps, E., Gestsdottir, S., Naudeau, S., Jelicic, H., Alberts, A., Ma, L., Smith, L., Bobek, D., Richman-Raphael, D., Simpson, I., Christiansen, E. D., von Eye, A. (2005). Positive youth development, participation in community youth development programs, and community contributions of fifth-grade adolescents: Findings from the first wave of the 4-H Study of Positive Youth Development. Journal of Early Adolescence, 25(1), 17-71. Lerner, R. M., Dowling, E., & Anderson, P. M. (2003). Positive youth development: Thriving as a basis of personhood and civil society [Special issue]. Applied Developmental Science, 7, 172-180.
Theokas et al. / CONCEPTUALIZING THRIVING
143
Perkins, D., & Borden, L. (2003). Positive behaviors, problem behaviors, and resiliency in adolescence. In I. Weiner (Series Ed.), R. M. Lerner, A. Easterbrooks, & J. Mistry (Vol. Eds.), Handbook of psychology: Developmental psychology (Vol. 6, pp. 373-394). Hoboken, NJ: Wiley. Peterson, C., & Seligman, M. (2003). Character strengths and virtues: A handbook and classification. London: Oxford University Press. Pittman, K. (1996). Community, youth, development: Three goals in search of connection. New Designs for Youth Development, 12(1), 4-8. Roth, J., Brooks-Gunn, J., Murray, L., & Foster, W. (1998). Promoting healthy adolescents: Synthesis of youth development program evaluations. Journal of Research on Adolescence, 8(4), 423-459. Scales, P. C., Benson, P. L., Leffert, N., & Blyth, D. A. (2000). The contribution of developmental assets to the prediction of thriving among adolescents. Applied Developmental Science, 4, 27-46. Seligman, M. E. P., & Csikszentmihalyi, M. (2000). Positive psychology: An introduction. American Psychologist, 55, 5-14. Theokas, C., & Lerner, R. M. (in press). Promoting positive development across variations in socioeconomic status and poverty: Framing the Corwyn and Bradley structural equation modeling approach with a developmental systems perspective. In A. Acock, K. Allen, V. L. Bengtson, D. Klein, & P. Dilworth-Anderson (Eds.), Sourcebook of family theory and research. Thousand Oaks, CA: Sage. Youniss, J., McLellan, J. A., & Yates, M. (1999). Religion, community service, and identity in American youth. Journal of Adolescence, 22, 243-253.
Christina Theokas is a doctoral student in the Eliot-Pearson Department of Child Development at Tufts University. Jason B. Almerigi is a postdoctoral fellow at the Institute for Applied Research in Youth Development in the Eliot-Pearson Department of Child Development at Tufts University. Richard M. Lerner is the Bergstrom chair in applied developmental science and the director on the Institute for Applied Research in Youth Development in the Eliot-Pearson Department of Child Development at Tufts University. Elizabeth M. Dowling is the director research at the ImagineNations Group in Baltimore, MD. Peter L. Benson is president of the Search Institute in Minneapolis, MN. Peter C. Scales is a senior fellow at the Search Institute and an adjunct professor of psychology at Saint Louis University. Alexander von Eye is a professor in the Department of Psychology at Michigan State University.