Condition monitoring system for characterization of electric motor ball bearings with distributed fault using fuzzy inference tools L. Navarro, M. Delgado, J. Urresty, J. Cusidó, L. Romeral Electronic Engineering Department – MCIA Group Universitat Politècnica de Catalunya Terrassa (Spain)
[email protected] Abstract - The present work shows a condition monitoring system applied to electric motors ball bearings. Unlike most of the previous work on this area, which is mainly focused on the location of single-point defects in bearing components – inner and outer races, cage or ball faults -, this research covers wide range irregularities which are very often more difficult to analyse. In addition to traditional techniques like vibration and current signals, high frequency current bearing pulses and acoustic emissions are also analysed. High frequency bearings current pulses are acquired using motors especially modified. This modification isolates ball bearings from the motor stator frame, except for a bearing housing single point connected to ground through a proper cable where the pulses signal is measured. A multivariable fuzzy inference analysis approach is presented to get around the diagnosis difficulty.
represents a good approach but overlooks other types of more complex failures, like wear distributed over a big area of the rings, which can be difficult to predict as a result of the lack of consistent characteristic fault harmonics in the spectral decomposition. This implies an overall spectrum energy increment not easily detectable at early stages of the fault development. [3] Therefore, it is difficult to examine bearings faults by analysing only specific fault harmonics due to the existing fault signal complexity and (in the case of asynchronous motors) also slip factor introduces an extra difficulty.
Keyword: fault anticipation system, electromechanical actuator, fuzzy inference system, bearings condition monitoring
The solution to monitor the condition of electric motor ball bearings with distributed fault proposed in this work is based in problem analysis from a multivariable point of view, what is to say the obtaining of a fault level result from the combined analysis of different signals with the use of fuzzy logic inference techniques. This is proposed to achieve a reinforced diagnose that will be more effective when it comes to detect bearings failure than just the use of a single signal, especially when it comes to damage severity evaluation.
I.
INTRODUCTION
Electric motors are nowadays widely used in all kind of industrial applications due to their simplicity, robustness and ease of control through inverters. Therefore, any effort with the aim of improving condition monitoring techniques applied to them will result in a reduction of overall production costs by means of productive lines stoppage reduction and increment of the industrial efficiency. Fig. 1 shows the motor percentage failure distribution according to [1]. The biggest percentage of failure is related to bearings damage.
Figure 1. Motor percentage failure by component.
Typically, bearings faults are classified by their specific location (inner and outer race, ball, cage faults) [2]. This
II.
III.
PRESENTED APPLICATION
THEORETICAL APPROACH
A. Vibration analysis Vibration analysis is one of the most extended condition monitoring techniques. Despite being a reliable, well studied robust technique, one of its drawbacks is that it requires that the motor under test has a vibration transducer installed, condition that makes its online application expensive. In this work vibration results are set out as a reference for the other techniques without this kind of restriction. Vibration frequency components related to specific faults (inner (firf), outer (forf) and ball (fbsf) faults) can be calculated using the expressions: 2 2 2
978-1-4244-2833-5/10/$25.00 ©2010 IEEE
1
cos
1
cos
1
cos
(1) (2) 2
(3)
With: n: number of balls fr: rotor speed bd: ball diameter pd: bearing pitch diameter : contact angle of the ball on the race As some works [4] show, a RMS vibration value evaluation of the motor also provides a good indicator for motor health, allowing machine overall fault diagnosis. B. Stator Currents Stator currents analysis (MCSA) represents an interesting alternative method with its own particularities and benefits; the most interesting of them is sparing the access inside the motor making it easy to perform its online fault analysis. As a result of motor airgap length variations due to bearings defect, flux density is influenced and then an additional magnetic flux appears. This magnetic flux (and its variations associated to rotor turning) creates additional components that can be found in the stator currents spectra. Previous works have shown the existing correlation between vibration and currents RMS values [5]. Although it is a complex function that relates both magnitudes, this work tries to check the RMS currents reliability in order to perform the motor status diagnose. Moreover, the mechanical vibration frequencies appear in the stator current spectra following: ,
(4)
With: fs: electrical supply frequency fi,o: fault distinctive frequency (1) (2) (3) With this knowledge, it is possible to execute an RMS calculation over the acquired current signals with the aim of performing a more precise and straightforward operation. C. High Frequency Common-Mode pulses One of the biggest culprits for bearings failure are commonmode circulating currents, which are generated by switching inverters and expose the motor terminals to high dv/dt. This phenomenon has been widely exposed in [6] and [7]. Fig. 2 shows the different paths that circulating currents use to reach ground. The most important current in this case is the one going from stator to rotor passing through bearings. A sinusoidal three phase power supply system could be considered symmetric and balanced, with instantaneous common mode voltage equal to zero. Nevertheless, in PWM switched systems that characteristic is not feasible and high dv/dt are applied over stator windings generating additional high frequency common mode currents that travel from stator windings to rotor through the capacitance existing between them.
Fig. 2. Circulating currents paths to ground
Capacitive effect variability on bearings is due to the width of the lubricant film between balls and rails. This capacity is then shortcircuited when common mode voltage surpasses the threshold value, giving rise to circulating currents trough the bearings, which are detectable acquiring signal in power supply wires using common-mode measurements. If this capacity due to bearings lubricant gets diminished, the number of common mode pulses is increased but their amplitude is generally lower. In this experiment, to limit the acquired signal to only pulses flowing through bearings (the responsible of balls degradation), a motor modification was introduced. All the ball bearing under test were aisled from the motor stator frame except for a point connected to ground through a cable where the pulses were measured. Bearings insulation was achieved by surrounding the piece with a PTFE flat ring with a hole mechanized in it to let the cable pass through. These currents typically show a frequency range of about 5 MHz with a typical period of 20 μs between bursts. D. Acoustic Emissions The Acoustic Emission Technique (AET) is a very promising tool that has practical application in several fields and specifically recent important relevance in condition monitoring of machines. [8] [9] [10] Acoustic emissions (AE) are high frequency elastic waves in the ultrasound range that appear when a material suffers localised plastic deformation. The analysis of this stress waves shows the nature of the original producing source and, therefore, enables the diagnose conducting to the actual element fault type and severity. In the bearings field, AE is a good tool to detect impulsive faults like wear, ball impacts and lubrication problems (like contaminants or degradation). IV.
EXPERIMENTAL TEST RIG
The test rig used during this research work consists of four ABB M2AA 1.1kW induction motors, three of them with the drive-end ball bearings under test and the other one used to regulate the applied load. Both driving and loading motors were controlled using inverters. Motor under test has also a cable attached to the drive-end bearings housing with the other
Nominal Power
1,1 kW
Nominal Speed
1410 rpm
Nominal Current
2,59 A
Nominal torque
7,5 Nm
Pole pairs
2
Table. 1. Induction Motor data
All three motors (Healthy, Lightly and Heavily Damaged) under test had SKF 6205 bearings with normal clearance and nine balls with diameter of 7.9 mm and pitch of 38.5 mm. A triaxial shear design MMF branded piezoelectric accelerometer model KS943B.100 with IEPE (Integrated Electronics Piezo Electric) standard output and linear frequency response from 0.5 Hz to 22 kHz with a maximum acceleration measurable of 60 g, was attached using stud mounting to the drive-end motor endshield. This model has a voltage sensitivity of 100±5% mV/g and a range up to 60 g. Its data was collected using a PXIe system from National Instruments sampling at 20kS/s, 10 seconds for each measurement. Phase currents were acquired using Hall Effect Tektronix A622 probes with a frequency range from DC to 100 kHz in 100 mV/A output mode. Data were collected using a Tektronix DPO oscilloscope sampling at 50 kHz, 100 ms for each measurement. High frequency bearings discharge signal was measured at the cable attached to the bearings housing with a Tektronix TCPA300 Amplifier and TCP303 current probe. This set provides DC to 15 MHz acquisition, a risetime of less than 23 ns with and accuracy of ±3% of reading at 25ºC and capable of reading currents as low as 5 mA. Acquisition was performed using a Tektronix DPO oscilloscope sampling at 50 MHz, 10 ms for each measurement. AE were acquired with the use of a Vallen-Systeme GmbH VS-150M sensor unit with a range from 100 kHz to 450 kHz and resonant at 150 kHz. A Vallen-Systeme GmbH AEP4 40dB preamplifier was used before data acquisition, it has an input range of 100 mVPK, ouptput data were then acquired at a sampling rate of 25MS/s, 20ms each measurement, with Tektronix DPO system. V.
RESULTS
Vibrations, phase currents and bearings discharges were acquired from three different units at different motor speeds and loads, concretely 300, 750, 1050 and 1500 rpm (corresponding to 10, 25, 35 and 50 Hz inverter supply frequency) and 0, 50, 100 % of motor nominal torque load.
Healthy Vibration RMS value (g)
ABB M2AA 090 S-4
A. Vibrations With regard to the bearings units under test, there was a healthy one (with very similar vibration levels to other new units tested in previous works) and the other two tested units had different levels of damage due their operation hours, qualitatively evaluated with a shock pulse tester from SPM Instruments. The shock pulse method is not properly a method to test physically deformed bearings but wear or lack of lubricant failures. Technically, it does not measure the vibration itself, it is oriented to evaluate the mechanical shock wave caused by impacts from which it originates. In this experiment, the dB values obtained were applied as a qualitative way of checking the bearings status in order to make comparisons with the other methods. Fig. 3, 4 and 5 show the evolution of the RMS value of each motor vibration for all speeds and load values tested. The healthy unit shows lower values especially detectable under nominal conditions. Clearly, the healthy motor in Fig. 3 shows lower RMS values of vibration in comparison to the other two units.
0,4 0,3 300
0,2
750
0,1
1050
0 0
50
100
1500
Nominal load percentage % Figure 3. RMS Vibration for healthy unit, all speeds in rpm and loads. Light Damage Vibration RMS value (g)
side connected to ground (a hole was mechanized in order to pass the cable through the motor shield), allowing a low resistance path for bearings currents discharge.
0,6 0,5 0,4 0,3 0,2 0,1 0
300 750 1050 0
50
100
1500
Nominal load percentage % Figure 4. RMS Vibration for lightly damaged unit, all speeds in rpm and loads.
Fig. 5 unit data, which was in the worst operational condition according to the SPM measurements performed, gave also the highest levels of RMS vibration values.
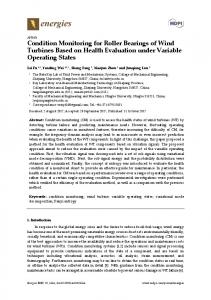
Number of bearing pulses over 3.5 A
Vibration RMS value (g)
Heavy Damage 400
0,7 0,6 0,5 0,4 0,3 0,2 0,1 0
Healthy
300 750 1050 0
50
1500
100
Nominal load percentage %
300 Lightly Damaged
200
Damaged
100 0
Figure 5. RMS Vibration for heavily damaged unit, all speeds in rpm and loads.
B. Stator Currents To avoid the influence of the main harmonic power value in the RMS measurement, signals have been previously filtered using a band-rejection 5th order Butterworth filter centred in the power supply main harmonic with a bandwidth of 20 Hz between higher and lower cut-off frequencies. Tables 1 and 2 compare the RMS filtered values of the heavily and lightly damaged units with the healthy one.
Figure 6 Number of bearing pulses over threshold value of 3.5 A for all motors under test. Healthy, lightly damaged and heavily damaged.
D. Acoustic Emission testing Acoustic Emission acquired data has been statistically classified by means of value binning tools and histogram presentation. Fifteen sets of data were acquired for each motor and averaged. Fig. 7 shows the results comparing the RMS voltage values acquired for the different units under test.
Heavily Damaged-Healthy (A RMS) Load % \ speed
300
750
1050
1500
0
0,004
-0,006
-0,008
-0,007
50
0,036
0,03
0,073
0,044
100
0,018
0,026
0,024
0,024
Table 1. Difference in RMS filtered current value between heavily damaged unit and healthy one used as reference.
Lightly Damaged-Healthy (A RMS) Load % \ speed
300
750
1050
1500
0
0,008
0,002
-0,003
-0,003
50
0,002
-0,011
-0,002
-0,005
100
0,02
0,012
0,003
0,014
Table 2. Difference in RMS filtered current value between lightly damaged unit and healthy one used as reference.
A significant difference can be clearly appreciated when the motor is heavily damaged under load condition. Light damage is noticeable under nominal load conditions but its detection does not seem to be easily reliable. C. High Frequency bearings pulses Bearings pulses threshold analysis has been executed to validate theories of correlation between bearings state (wear, lubrication, distributed defects, etc.) and pulses discharge over a threshold value. The results summarized in Fig.6 show that over a defined threshold level healthy bearings undergo a bigger number in comparison to the damaged units. It is noticeable also that this method is able to detect failure at its initial stage if the threshold is correctly placed.
Figure 7. Acoustic Emission voltage values classification
It is advisable that pulses over 8 V only appeared during the damaged motor testing while under 7 V that unit does not show more activity than the healthy and lightly damaged units. Then, the fuzzy inference system designed uses as reference the number of pulses that surpass the 7 V value, which is the zone where the distinction of the fault severity of the unit seemed to be more noticeable. VI.
FUZZY INFERENCE SYSTEM IMPLEMENTATION
The analysis of the actual bearing status was performed using a fuzzy logic inference implementation [11] [12] which maps given inputs to a single output at every speed and load under test. This mapping provides the system with a strategy for decisions to be made. As a result, we obtain an output scaled from 1 (Healthy) to 3 (Heavily Damaged). The inference method designed is a Sugeno type. For linear systems it is a more compact and computationally efficient tool than the Mandani option, which gives as its output a distributed fuzzy set instead of a single spike.
as a heavily damaged set and two of the heavily damaged sets were identified as lightly damaged ones. Unit Healthy Lightly Damaged Heavy Damage
Matches 15/15 14/15 13/15
Success % 100 % 93,33% 86,66%
Table 3. System testing - Damage identification results Figure 8. Fuzzy Inference system inputs and its single output.
The membership functions, like Fig. 9, have been obtained through training and validation process, for each signal under analysis using real motor data. MATLAB “Adaptive neurofuzzy inference system” tool has been used for this purpose.
The percentage of success was reasonably high and there is still plenty of room for improvement as more data sets could be included during the system training stage. VIII. CONCLUSION This paper gives an overview of a condition monitoring system that uses a multisensory fuzzy inference approach used to characterize motor ball bearings and their application to a set of motors with distributed fault failure. The results show that a multivariable design contributes positively to damage monitoring of bearings, being a more solid solution than just using any of the single signals involved. REFERENCES [1]
Figure 9. Membership function plot for Current RMS. (motor speed: 1500 rpm, motor load: 0%)
Fig. 10 shows the obtained relationship between Vibration and Stator Current RMS values against the Failure Level output for a motor speed of 1500 rpm and a load of 0%. Similar surfaces were obtained for all inputs and conditions under test.
Figure 10. Plotted surface showing the relationship between the system inputs Vibrations RMS value (g) and Stator Currents RMS value (A) versus the Failure Level output. (Motor speed: 1500 rpm, motor load: 0%)
VII. RESULTS To perform the evaluation of the monitoring system designed, fifteen sets of data were collected from the same three motor units and processed. This implies data obtaining and processed values introduction to the designed system. Then the output was compared to the actual known status by rounding to the nearest integer value. Table 3 summarizes the obtained results. All healthy data sets were correctly identified, whilst one of the lightly damaged was recognised
IEEE Motor Reliability Working Group, “Report of large motor reliability survey of industrial and commercial installations,” IEEE Transactions on Industrial Applications, vol. IA-21, no. 4. 1986. [2] I. Howard, “A Review of Rolling Element Bearing Vibration. Detection, Diagnosis and Prognosis”, October 1994. [3] J. R. Stack, T. G. Habetler and R. G. Harley, “Fault classification and fault signature production for rolling element bearings in electric machines,” Industry Applications, IEEE Transactions on, vol. 40, pp. 735-739, 2004. [4] M. F. Cabanas, M. G. Melero, G. A. Orcajo, J. M. Cano Rodríguez, Juan Solares Sariego; “Tecnicas para el Mantenimiento y diagnóstico de Máquinas Eléctricas Rotativas”, Marcombo, Oviedo, Spain, 1996. [5] C. M. Riley, B. K. Lin, T. G. Habetler and G. B. Kliman, “Stator current harmonics and their causal vibrations: a preliminary investigation of sensorless vibration monitoring applications,” Industry Applications, IEEE Transactions on, vol. 35, pp. 94-99, 1999. [6] A. Binder, A. Muetze, “Systematical Approach to Bearing Current Evaluation in Speed Drive Systems,” ICEM2002. [7] D. Busse, J. Erdman, R. Kerkman, D. Schlegel, and G. Skibinski, “Characteristics of shaft voltage and bearing currents,” Industry Applications Magazine, IEEE, vol. 3, pp. 21-32, 1997. [8] D. Mba and Raj B. K. N. Rao, “Development of Acoustic Emission Technology forCondition Monitoring and Diagnosis of Rotating Machines: Bearings, Pumps, Gearboxes, Engines, and Rotating Structures,” The Shock and Vibration Digest, vol. 38, pp. 3, Jan 2006. [9] N. Tandon, A. Choudhury, A review of the vibration and acoustic measurement methods for detection of defects in rolling element bearings, Tribology International 32 (8) (1999) 469–480. [10] A. M. Al-Ghamd and D. Mba, “A comparative experimental study on the use of acoustic emission and vibration analysis for bearing defect identification and estimation of defect size,” Mechanical Systems and Signal Processing, vol. 20, pp. 1537-1571, 10. 2006. [11] X. Lou, K.A. Kenneth and A. Loparo, “Bearing fault diagnosis based on wavelet transform and fuzzy inference”, Mechanical Systems and Signal Processing, Volume 18, Issue 5, p. 1077-1095. [12] S. Ballal, Z.J. Khan, H. M. Suryawanshi, R.L. Sonolikar, “Adaptive Neural Fuzzy Inference System for the Detection of Inter-Turn Insulation and Bearing Wear Faults in Induction Motor”, IEEE Transactions on Industrial Electronics, 2007, Vol.54 Issue 1.