Condition Monitoring System for the Detection of Defects in Ceramic Insulators Based on Their Radio Frequency (RF) Signatures Shaharyar Anjum1*, Shesha Jayaram1, Ayman El-Hag1, Ali Naderian2 1.
Electrical and Computer Engineering Department University of Waterloo, Waterloo, Canada
[email protected]
2.Kinectrics Inc, Toronto, Canada M5G
[email protected]
initial investigation into the use of RF sensing techniques for polymeric insulator specimens [6] along with the feasibility of classification of the partial discharges. These preliminary studies have used simple geometries for the test samples and the effect of insulator profiles on the PD has not been investigated. The potential of a VHF (very high frequency; 30–300MHz) method to monitor the physical condition of ceramic insulators is reported by Wong using fractal analysis [7]. Further, a vehicle mounted system that is capable of detecting and locating the faulty string of insulators on a transmission line, based on the time delay between arrays of 4 antennas has been reported [8]. However, if the detection is based on using partial discharge (PD) activities as a means of the insulation degradation, in order to make the detection effective, it is required to use an ultra-high frequency (UHF; 300MHz – 3GHz) range as detection limits. Also, in identifying different types of defects, classification of the PD activities is necessary. In this paper, a novel condition assessment system for the defected outdoor ceramic insulators using the time varying RF signatures generated as a result of partial discharge activity due to insulator defects is presented. Different defected insulators removed from field, comprising three types of defects have been analyzed based on their RF signatures. .
Abstract— Despite the rapid rise of silicone rubber based outdoor insulators in recent years, ceramic insulators are still the most widely deployed insulators in power transmission systems across the world. Through discussion with utility professionals, it has been found that a sharp increase in defected ceramic insulators has been reported owing to the aging of the utility infrastructure. Utilities in North America are increasingly concerned about early detection of potential problems so that appropriate asset management can take place, minimizing extremely high costs associated with power outages and disruptions. Partial discharge (PD) is an early sign of defects within the insulators and it refers to the localized electrical discharges that partially bridge the insulation between the conductors due to high electrical stress. In this paper a novel condition assessment system for the defected outdoor ceramic insulators using the time varying RF signatures generated as a result of partial discharge activity due to insulator defects is presented. I.
INTRODUCTION
One of the most widely used and successful methods for testing ceramic insulators in field conditions is the online high voltage test (or the Hi pot test). This requires the application of high voltage across every insulator in the string to detect the defected insulator and can pose danger to the line men if more than a certain number of insulators are punctured in the string. Other methods like visual inspection, leakage current measurements, and insulation resistance measurements suffer from lack of accuracy and the inability to detect certain type of defects like cracks [1]. Despite their shortcomings, these methods are routinely employed in the transmission systems due to lack of other alternative methods. Therefore a robust non-contact insulation diagnostics method such as the one investigated in this paper using RF signatures has a great potential. The area of RF based condition monitoring of outdoor insulators is still quite nascent even though detection and localization of PD using RF measurements is now a matured discipline in gas insulated switchgear and transformers [2]-[4]. In fact, the existence of distinctive radio noise broadband frequency components for the discharge activity taking place within the polymeric and ceramic insulator samples has been demonstrated [5]. Also, Ibrahim et al. presented results of an
II.
MATERIALS AND METHODS
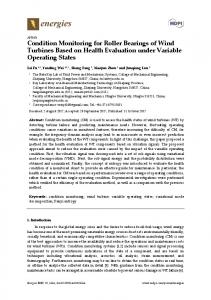
The defects in ceramic insulators can arise either during the manufacturing process itself or introduced later when they are in service due to high stresses. Three different types of insulator defects are investigated in this paper, which are commonly encountered by the utilities. First class consists of an intentionally cracked ceramic insulator disc, Figure 1. The second class considers a completely broken insulator disc. This type of defect can be easily detected visually if the ceramic disc is situated in the visible part of the string. However the detection becomes a problem if the defected insulator is present in visually inaccessible region of the string. A broken insulator was used to acquire the corresponding radiation patterns. A disc with a hole through the cap which results in generating internal discharges comprise the third case as shown in Figure 2. This hole would initiate internal discharges within the cap of the insulator. In addition a case of simple corona is considered to constitute a
131
total of 4 distinct classes of test cases. The presence of these defects results in the emission of electromagnetic radiation due to the initiation of partial discharge activities within the insulator.
PD sensor for capturing the RF signatures that are emitted as a result of PD activity within the defects in the samples. The antenna is in turn connected to a 2 GHz (10 GS/s) oscilloscope via a low impedance cable in an open loop arrangement as shown in Figure 3. The wideband antenna allows signals in the GHz range to be acquired with high fidelity. B. Feature Extraction Extraction of suitable features from the RF signatures comprises the preliminary step in the classification of the insulator defects. Subsequently the extracted features will be fed into the artificial neural network in order to complete the final step in the classification process. The two kinds of features that were employed are the spectral and the statistical features. The spectral features are the coefficients of the Discrete Fourier Transform (DFT) of the signal. The DFT coefficients are defined in equation (1):
Figure 1 Insulator disc with a deliberately introduced crack (left), and a broken insulator disc (right) as test samples.
( )
∑ ( )
( )
Where k = 0, 1, 2,… N-1. The other features used in this study are the statistical features. These are based on the time domain representation of the data. The statistical parameters like mean, median, variance, kurtosis, skewness and the standard deviation are considered as the statistical features for the ANN. The skewness measures the degree of asymmetry with respect to the sample mean. A negative value of skewness indicates that the spread of the data is towards the left of the mean; whereas, positive skewness indicates the spread is more towards the right. The skewness of a normal distribution is zero. Skewness S of a discrete signal x is defined by equation (2):
Figure 2 Insulator disc with a hole through the cap.
∑
(
)
( )
Kurtosis of a discrete distribution function x measures how peaky or “outlier prone” the distribution is with respect to the normal distribution. Normal distribution has a kurtosis of three so a kurtosis of less than three would mean data that is less prone to outliers than a normal distribution and vice versa for a value greater than 3. Mathematically kurtosis is given by equation (3):
Figure 3 Experimental Test Setup.
A. Test Setup and Data Acquisition(DAQ) In this initial study, each test sample consisted of one defected insulator disc. In the subsequent work the effect of incorporation of the defected samples within a string of insulators will be investigated. The samples are connected to high voltage end of the transformer at the cap and grounded at the lower end. A corona free test transformer (HIPOTRONICS Model T7150-20CF-L-G) is used, and the tests are conducted applying up to 13kVrms to test samples. The inception of the PD activity is analyzed using the classical PD measurement setup which along with a coupling capacitor is shown in the above circuit (Figure 3). A wideband horn antenna is used as a
∑
(
)
( )
C. ANN architecture: Back Propagation algorithm is the basis of the ANN technique that’s employed after successive testing with different algorithms. The architecture comprises of a two layer network where the two layers are the hidden and the output layers. All of the layers are made up of numerous neurons themselves with the input layer having 513 neurons corresponding to each of the data points in the DFT of the
132
in the spectral energy distribution for each of the different classes of defects. Thus these spectral features could be good candidates to serve as input feature vectors for ANN. The classification of the defects is based on the spectral and statistical features and a performance comparison was made of two approaches. Earlier in the paper, it has been established that different defects contribute to a different distribution of the spectral energies. Thus, these differences in the features are sensed by the neural network classification, allowing the network to alter its parameters based on the training data. Therefore, when presented with a large quantity of unseen test data, the algorithm is able to classify them with a high accuracy.
signatures. The hidden layer has 300 neurons and the output layer has 4 neurons. Every neuron has an associated input, bias, an activation function and an output. The input x is weighted by a weighting function as shown in Figure 4. Input Layer
Hidden Layer
Wij
513- Point DFT of the RF Signature as Input
x₀
S
x₁
S S
x₂ x₃
. . . . . 513
Output Layer
S S x
S.
S S
. . . . 300
0.04
4 0.03
Bias Inputs
1
0.01
Volts
1
0.02
Figure 4 ANN Architecture for extracting the spectral features.
0
-0.01
The total activation is determined by adding the weighted inputs with bias b. The hidden layer output is dependent on its activation function which for this particular network is a sigmoid function. In a similar manner the non-linear sigmoid function is used to calculate the output in the output layer. The ANN architecture that was employed for the statistical features is similar to the architecture depicted in Figure 4 except that the number of inputs is only 6 as opposed to 513 inputs. Moreover 10 hidden layer neurons were used with no improvement observed on increasing their numbers. III.
-0.02
-0.03 -5
-4
-3
-2
-1
0
1
2
3
4
5 -8
x 10
Time (s)
(a) 0.06
0.04
Volts
0.02
0
RESULTS AND DISCUSSION -0.02
A. RF signatures obtained from PD Activity The time domain versions of the RF signatures obtained for three different test samples are depicted in Figures 5-a through 5-c. Simultaneous recording of PD through the PD setup validates that these signatures are radiated as a result of PD activity; in which the inception voltages are compared. Differences in the time domain can be seen between the signatures and are reflected in the classification results based on spectral and statistical features. Owing to the stochastic nature of the PD signals, normalized FFT plots of 20 random samples each for three different classes are shown in Figures 6-a through 6-c. The spectral density for the insulator with a crack is spread over a wide range, between 1.5 GHz and 2.5 GHz, with the largest component at around 1.7 GHz; whereas, for the broken insulator this spread was not observed. This is attributed to the dimension of the crack that was deliberately introduced in the disc. The size and shape of this crack determines the amount of radiated electromagnetic waves due to PD activity within the defected disc, hence higher magnitude frequency components are radiated that fall in a wide bandwidth range. Similarly a unique spectral density plot is obtained for the case of corona noise with components in the 800 MHz and 2 GHz band. It can be concluded that distinct differences are present
-0.04
-0.06 -1
-0.8
-0.6
-0.4
-0.2
0
0.2
0.4
0.6
0.8
Time (s)
1 -7
x 10
(b) -3
6
x 10
4
Volts
Volts
2
0
-2
-4
-6 -8
-6
-4
-2
0 Time Time (s) (s)
2
4
6 -8
x 10
(c) Figure 5 RF Signatures obtained through oscilloscope for (a) Corona Noise (b) Insulator with a crack (c) Broken Insulator, respectively.
B. Classification Results The statistical feature vectors comprised of 6 features that were used to train and test the ANN. As seen in Table 1, the recognition rate when statistical features were used was just 63% which is very low, and could be attributed to self-
133
Table 1 Classification results using Statistical Features
similarity of the signals in the time domain. Thus DFT based feature vectors are applied. The corresponding DFT of the RF signatures for each of the classes described earlier were fed into the ANN. A total of 40 samples comprising 513 points from the normalized DFT from each of the 4 classes were fed into the neural network. These samples were randomized into training, testing and validation sets in order to evaluate the performance of the ANN. These steps were repeated 10 times in order to ascertain consistent high classification results which are shown in Table 2. It is apparent from Table 2 that high recognition rate was achieved when using the spectral features as the input feature vector.
Overall Average Recognition Rate 63%
Overall Maximum Recognition Rate 70%
Table 2 Classification results using Spectral Features
Single-Sided Amplitude Spectrum of y(t)
Average Recognition Rate 100 84.95 87 93 91
Class 1 Rate Class 2 Rate Class 3 Rate Class 4 Rate Overall Rate
Maximum Recognition Rate 100 92 98 100 95.8
1
IV.
0.9
|Y(f)|
0.8
0.7
|Y(f)|
0.6
0.5
0.4
0.3
0.2
0.1
0
0
0.5
1
1.5
2
Frequency (GHz)
2.5 Frequency (Hz)
3
CONCLUSIONS
In this study the feasibility of using a non-contact monitoring system for detecting the defects in ceramic insulators based on their RF signatures was investigated. The method not only provides the possibility of detecting the PD activity or the defect, but also the classification of the specific insulator defect which allows identifying the root of the problem for PD activity. A high recognition rate of over 91% was achieved when the normalized DFT components of the distinctive RF signatures obtained for each defect were used as training vectors for the ANN. The use of this technique therefor has potentials to develop a tool in condition-based maintenance of insulation systems, for detecting defected discs in string of insulators. 3.5
4
4.5
5
9
x 10
(a) Single-Sided Amplitude Spectrum of y(t) 1
V.
0.9
REFERENCES
C. Nyamupangedengu, L.P Luhlanga., and T Letlape,. “Acoustic and HF detection of defects on porcelain pin insulators”, Power Engineering Society Conference and Exposition in Africa. pp. 1-5, 2008.J. Clerk Maxwell, A Treatise on Electricity and Magnetism, 3rd ed., vol. 2. Oxford: Clarendon, 1892, pp.68-73. [2] M.D.Judd, “Radiometric partial discharge detection.”, International Conference on Condition Monitoring and Diagnosis pp. 1025-1030, 2008. [3] C. Min , K. Urano, , L. You-Cheng, , and A. Jinno, “Application of combined PD sensor for GIS PD detection and condition monitoring.”, International Conference on Condition Monitoring and Diagnosis pp. 456-460, 2008. Frequency (GHz) [4] M.D. Judd., L. Yang, and I. B Hunter,. “Partial discharge monitoring of (b) power transformers using UHF sensors. Part I: sensors and signal Single-Sided Amplitude Spectrum of y(t) interpretation.” Electrical Insulation Magazine, IEEE, 21(2), pp 5-14, 1 2005. 0.9 [5] B.G. Stewart , D. M. Hepburn, , I. J. Kemp, , A. Nesbitt, , and J 0.8 .Watson, “Detection and characterisation of partial discharge activity on 0.7 outdoor high voltage insulating structures by RF antenna measurement 0.6 techniques”. Eleventh International Symposium on High Voltage Engineering ,Vol. 5, pp. 188-191, 1999. 0.5 [6] I.Y. Shurrab, A.H. El-Hag, K. Assaleh, , R.A. Ghunem, and S. Jayaram, 0.4 “RF-based monitoring and classification of partial discharge on wet 0.3 silicone rubber surface”, IEEE Transactions on Dielectrics and Electrical 0.2 Insulation, 20(6), 2188-2194, 2013. 0.1 [7] K.L.Wong,“Application of very-high-frequency (VHF) method to 0 ceramic 4insulators.” IEEE Transactions on Dielectrics and Electrical 0 0.5 1 1.5 2 2.5 3 3.5 4.5 5 Frequency (Hz) Insulation, 11(6), 1057-1064, Frequency (GHz) x 10 2004. [8] P.J. Moore , I. E. Portugues, , and I. A Glover,. “Remote diagnosis of (c) overhead line insulation defects.” IEEE Power Engineering Society Figure 6 Normalized FFT plots of 20 RF Signatures for (a) Corona Noise GeneralMeetingVol.2pp.1831-1835, 2004. (b) Insulator with a crack (c) Broken Insulator, respectively. [1]
|Y(f)|
0.8
0.7
|Y(f)|
0.6
0.5
0.4
0.3
0.2
0.1
0
0.5
1
1.5
2
2.5 Frequency (Hz)
3
3.5
4
4.5
5
9
x 10
|Y(f)||Y(f)|
0
9
134