What explains performance of students in a heterogeneous environment? Conditional e¢ ciency estimation with continuous and discrete environmental variables Kristof De Wittey
Mika Kortelainenz
February 2012
Abstract E¢ ciency estimations which do not account for the operational environment where production units are operating in may have only a limited value. This paper presents a fully nonparametric framework to estimate relative performance of production units when accounting for continuous and discrete background variables. Using insights from recent developments in nonparametric econometrics, we show how conditional e¢ ciency scores can be estimated using a tailored mixed kernel function with a data-driven bandwidth selection. The methodology is applied to the sample of Dutch pupils from the OECD PISA data set. We estimate students’performance and the in‡uence of its background characteristics. The results of our application show that several family- and student-speci…c characteristics have a statistically signi…cant e¤ect on the educational e¢ ciency, while school-level variables do not have impact on performance. Keywords: Education, Nonparametric estimation, Generalized kernel function, Bootstrap JEL-classi…cation: C14, C25, I21 We would like to thank Laurens Cherchye, Ali Emrouznejad, David Saal, Emmanuel Thanassoulis, Philippe Vanden Eeckaut, Marijn Verschelde, Paul Wilson and the participants of the workshop on ‘Exploring Research Frontiers in Contemporary Statistics and Econometrics’ at the Université Catholique de Louvain and The XI European Workshop on E¢ ciency and Productivity Analysis in Pisa for valuable comments. The usual caveat applies. y Top Institute for Evidence Based Education Research (TIER), Maastricht University, the Netherlands;
and Faculty of Economics and Business,
University of Leuven (KU Leuven),
Belgium,
[email protected]. z Government Institute for Economic Research (VATT), Helsinki, Finland, mika.kortelainen@vatt.…; and Economics, School of Social Sciences, University of Manchester, UK.
1
1
Introduction
Neglecting the operational environment where production units are operating in can make e¢ ciency estimations meaningless. If, for example, the e¢ ciency of the educational system is assessed, it is not fair or justi…ed to compare schools located in ‘advantageous’neighborhoods (e.g. measured by average education, income or percentage of migrants) with schools located in less advantageous areas. If the evaluated observations are a¤ected by external, exogenous factors, performance analysis should control for this heterogeneity. Performance can be estimated by comparing the resources (inputs) to the outcomes (outputs). This has been formalized in nonparametric techniques such as Data Envelopment Analysis (DEA; Charnes et al., 1978) and Free Disposal Hull (FDH; Deprins et al., 1984). Various approaches to incorporate heterogeneity in DEA and FDH models have been suggested. In general, as summarized in Fried et al. (2008), they face one or several of the following drawbacks: (1) only either continuous or categorical exogenous variables can be used, (2) the e¤ect of the environmental variable1 is required to be monotone in the production process, (3) the researcher has to choose a priori whether to model the environmental variable as an input or as an output, (4) in practice it is often not possible to include several environmental factors, and (5) one needs to assume a separability condition in that the operational environment would not in‡uence the attainable input-output set. Concerning the last drawback, in many applications the exogenous variables do not only in‡uence on e¢ ciency, but also on the production possibilities. Therefore, there is often no separability between inputs, outputs and environmental variables. Recently, Cazals et al. (2002) and Daraio and Simar (2005) suggested a nonparametric approach, the so-called conditional e¢ ciency model, to account for heterogeneity in performance assessments, which does not su¤er from the last four drawbacks. While Cazals et al. (2002) outlined the original idea on how to incorporate environmental variables in the nonparametric model, Daraio and Simar (2005) expanded their approach to a more general multivariate setup and presented a practical methodology to evaluate the impact of exogenous variables. The consistency and the asymptotic properties of di¤erent conditional e¢ ciency estimators have been also investigated (Cazals et al., 2002; Jeong et al., 2010). As the conditional e¢ ciency approach has a number of merits, it is increasingly used for several di¤erent research questions. Previous applications include performance analysis of water companies (De Witte and Saal, 2010; De Witte and Marques, 2011), mutual funds (Daraio and Simar, 2005, 2006; Badin et al., 2010), public libraries (De Witte and Geys, 2011) and education (Cherchye et al., 2010; De Witte and Rogge, 2011). The current paper contributes to the literature by focusing on several additional issues, which are very relevant in most empirical applications. First of all, we consider the inclu1 We
follow earlier literature and use environmental and exogenous variables as synonyms.
2
sion of both discrete and continuous environmental variables in the conditional e¢ ciency framework. The conditional e¢ ciency models used in previous studies have been basically designed for continuous environmental variables only. However, in interesting real-life applications the exogenous variables are both continuous and discrete. Although including discrete variables in this framework was shortly discussed by Badin et al. (2010), this paper shows how to do so in practice. In particular, we indicate how to adapt the nonparametric conditional e¢ ciency measures to include mixed (i.e. both continuous and discrete) exogenous variables by specifying an appropriate kernel function which smooths the mixed variables. As the second contribution, we use nonparametric tests to evaluate the signi…cance of the exogenous variables. We note that, so far, only descriptive analysis for studying the e¤ect of the environmental variables in conditional e¢ ciency framework has been suggested. For the signi…cance testing of continuous and discrete exogenous variables, we rely on recently developed nonparametric bootstrap-based procedures. Finally, we examine nonparametrically educational performance while examining and accounting for heterogeneity.2 Given tightening budget constraints, performance evaluations of pupils and schools have received recently large attention in economics of education (e.g. Cherchye et al., 2010; Perelman and Santin, 2011). However, to our best knowledge, there are no papers which nonparametrically estimate students’performance and its drivers while avoiding the separability condition. Besides, as parametric models assume an a priori speci…ed production or distance function, the parametric results could be biased due to this assumption. In the application, we avoid the latter two drawbacks. For the Dutch students in the PISA data set the educational performance in math, science and reading is assessed. In doing so we account for a broad range of unordered and ordered categorical and continuous environmental variables. In addition, to account for school-level unobserved heterogeneity we estimate two di¤erent models, one with school indicators and another using several schoollevel variables. The remainder of the paper unfolds as follows. The next section shortly reviews the probabilistic formulation of the production process and describes the conditional e¢ ciency approach. Section 3 presents the approach based on generalized kernel estimation and suggests the procedure to investigate the impact of environmental variables. Section 4 evaluates performance of students and examines nonparametrically which background variables a¤ect performance. Finally, we present the conclusions. 2 Obviously,
the scope of the generalized conditional e¢ ciency framework is much broader. Therefore, the
R code is available from the authors upon request. The code utilizes some features of np package by Hay…eld and Racine (2008).
3
Conditional e¢ ciency estimation3
2 2.1
Probabilistic formulation and order-m
We consider a production technology where production units are characterized by a set of inputs x (x 2 Rp+ ) and outputs y (y 2 Rq+ ). The production technology is the set of all feasible
input-output combinations: the set
= (x; y) 2 Rp+q j x can produce y . Obviously, in practice +
is unknown and have to be estimated from a random sample of production units
denoted by
n
= f(xi ; yi ) j i = 1; :::; ng.4 Besides the production set presentation, there exist
alternative ways to describe general production processes. The probabilistic formulation of
the production process presented …rst by Cazals et al. (2002) is particularly useful in many applications. The idea behind this alternative formulation is to examine the probability that an evaluated observation (x; y) is dominated using the joint probability function: HXY (x; y) = Pr(X
x; Y
y):
(1)
The joint probability function can be further decomposed as: HXY (x; y)
= Pr(Y = SY jX (Y
yjX
yjX
x) Pr(X
x)
x)FX (X
x)
(2)
= SY (y j x) FX (x) where SY (y j x) denotes the conditional survivor function of Y and FX (x) the cumulative distribution function of X: Now it can be shown that if
is free disposal (see e.g. Daraio
and Simar, 2007), the upper boundary of the support of SY (y j x) de…nes the traditional Farrell (1957) output-oriented technical e¢ ciency measure:
(x; y) = sup f j SY ( y j x) > 0g = sup f j HXY (x; y) > 0g .
(3)
To estimate e¢ ciency scores using the probabilistic formulation, one needs to …rst subb XY;n (x; y) for HXY (x; y) and SbY;n (y j x) for stitute the empirical distribution function H
SY (y j x), correspondingly. These empirical analogs are given by: n
X b XY;n (x; y) = 1 H I (xi n i=1
and
3 This
x; yi
y)
b XY;n (x; y) b XY;n (x; y) H H SbY;n (y j x) = = ; b b XY;n (x; 0) FX;n (x) H
(4)
(5)
section is based on earlier literature on the conditional e¢ ciency estimation (see e.g. Daraio and
Simar, 2007a), but is essential to understand extensions proposed in Section 3. 4 To clarify presentation, we denote the observed sample from which the e¢ ciency scores are estimated by lowercase letters (xi ; yi ) whereas uppercase letters (X; Y ) denote the unknown (and thus random) variables which can take any value.
4
where I( ) is an indicator function. Using the plug-in principle, the Free Disposal Hull (FDH) estimator for the output-oriented e¢ ciency score can be then obtained as bF DH (x; y) = n o sup j SbY;n ( y j x) > 0 . It should be noted that the traditional FDH estimator bF DH (x; y) is deterministic, which
is why it can be sensitive to outlying and atypical observations. Therefore, Cazals et al. (2002) suggested to consider the expected value of maximum output e¢ ciency score of the unit (x; y), when compared to m units randomly drawn from the population of units using inputs less than the level x. Thus, instead of considering the full frontier, the idea is to draw a partial frontier depending on a random set of m variables which consume maximally x resources. Taking the expectation of this less extreme benchmark, we obtain the order-m e¢ ciency measure
m (x; y).
Cazals et al. (2002) showed that the order-m e¢ ciency score
m (x; y)
has
an explicit expression that depends only on the conditional distribution SY (y j x): m (x; y)
=
R1 0
[1
(1
SY (uy j x))m ]du:
(6)
Similarly to FDH, one can then obtain the estimator for the order-m e¢ ciency by plugging R1 the SbY;n (y j x) to equation (6), which gives bm;n (x; y) = 0 [1 (1 SbY;n (uy j x))m ]du.
2.2
Conditional order-m e¢ ciency estimator
Using the probabilistic formulation, Cazals et al. (2002) suggested a conditional e¢ ciency approach which includes external environmental factors that might in‡uence the production process but are neither inputs nor outputs under the control of the producer. A major bene…t of this approach is that it can account for environmental factors in the e¢ ciency estimation without assuming a separability condition. The conditional e¢ ciency approach consists of conditioning the production process to a given value of Z = z, where Z denotes variables characterizing the operational environment. The joint probability function given Z = z can be de…ned as: HXY jZ (x; y j z) = Pr(X
x; Y
y j Z = z):
(7)
Again, this can be further decomposed into: HXY jZ (x; y j z)
= Pr(Y
yjX
x; Z = z) Pr(X
= SY (y j x; z) FX (x j z):
x j Z = z)
(8)
The support of SY (y j x; z) de…nes the production technology when Z = z: To mitigate the impact of outlying observations, again instead of using the full support of SY (y j x; z) one can
use the expected value of maximum output e¢ ciency score of the unit (x; y), when compared to m units randomly drawn from the population of units for which X
5
x. Analogously
to the unconditional order-m e¢ ciencies, conditional e¢ ciency measure expressed using the following integral: m (x; y
j z) =
R1 0
[1
(1
m (x; y
j z) can be
SY (uy j x; z))m ]du:
(9)
Estimating SY (y j x; z) nonparametrically is somewhat more di¢ cult than for the uncon-
ditional case, as we need to use smoothing techniques in z (due to the equality constraint Z = z): S^Y;n (y j x; z) =
Pn
I(xi x; yi y)Kbh (z; zi ) Pn ; x)Kbh (z; zi ) i=1 I(xi
i=1
(10)
where Kbh ( ) is a kernel function and b h is an estimate for bandwidth parameter h selected using some bandwidth choice method. The conditional order-m e¢ ciency estimator ^ m;n (x; y j z) is then obtained by plugging S^Y;n (y j x; z) into equation (9), i.e. ^ m;n (x; y j z) =
R1 0
[1
(1
S^Y;n (uy j x; z))m ]du:
(11)
Importantly, Cazals et al. (2002) showed that the convergence rate of the estimator bm;n (x; y j z) depends on the dimension of Z, being (nhr ) 1=2 , where r = dim(Z). This
means that although the order-m estimator avoids the curse of dimensionality, the accuracy of the conditional estimator depends on the dimension of Z due to the smoothing in z.
The current literature assumes that the univariate/multivariate Z is continuous. Clearly, an extension of the conditional e¢ ciency approach to a more general setting including both discrete and continuous variables requires changes to the presented framework, because in general it is not appropriate to treat discrete variables similarly with continuous (i.e. use continuous kernel for all ordered and unordered discrete environmental variables).
3 3.1
Estimation with mixed data Motivation
This section shows how to generalize the conditional e¢ ciency approach to the case of mixed environmental factors (i.e. having both discrete and continuous components). Firstly, it is important to notice that the conditional e¢ ciency approach presented in Section 2 is similar to traditional nonparametric methods used in regression and density estimation with respect to the presumption that the underlying data is continuous. The conventional approach in nonparametric estimation to allow for continuous and discrete variables would be to split the sample in subgroups corresponding to the di¤erent values of the discrete variables and then estimate separate models for those subsamples. This approach is sometimes referred to as a ‘frequency-based’ method. One could follow the frequency-based approach also in the 6
conditional e¢ ciency estimation by splitting the sample to subgroups with respect to the values of discrete variables, and then employ the methods presented in Section 2 for each of the subgroups. In essence, this would combine the conditional e¢ ciency approach with a so-called frontier separation (or metafrontier ) approach. However, the conventional method has two major drawbacks. The …rst drawback is that the frequency-based method will be problematic and even infeasible when the sample size is not large relative to the number of subgroups of discrete variables. In fact, e¢ ciency applications using parametric regression methods use frequently many discrete variables in relative small samples. A second relevant disadvantage of the frequency-based method concerns statistical inference. Although it is quite straightforward to test the e¤ect of a dummy variable using bootstrapping methods by comparing e¢ ciency distributions of separate groups, testing is much more challenging if there are more than two subgroups and in particular if one wants to test signi…cance of the categorical variable that has many classes. To avoid the problems of the frequency-based method, we propose to use an alternative approach that smooths also the discrete variables in a particular manner as …rst suggested by Aitchison and Aitken (1976). The idea of smoothing discrete along with continuous variables is based on novel kernel methods proposed and developed by Racine and Li (2004), Hall, Li and Racine (2004) and Li and Racine (2007, 2008). We introduce and adapt these techniques to the conditional e¢ ciency framework.
3.2
Mixed kernel estimation
As we treat continuous, discrete ordered and discrete unordered variables di¤erently in the estimations, we rede…ne the multivariate Z. De…ne a vector of observed environmental variables by zi = (zic ; zio ; ziu ), i = 1; :::; n, where the …rst component zic 2 Rr denotes a vector of continuous environmental variables, zio is a v-dimensional vector of environmental variables
that assume ordered discrete values and ziu is a w-dimensional vector of exogenous variables o u that assume unordered discrete values. In addition, let zis and zis denote sth components of o u zio and ziu . Without losing any generality, we assume that zis and zis can take cs
ds
2 di¤erent values, i.e.
o zis
= f0; 1; :::; cs
1g for s = 1; :::; v
for s = 1; :::; w. This means that the support of Su =
w Q
s=1
f0; 1; :::; ds
zio
and
ziu
o
u and zis v Q
are S =
1g, respectively.
s=1
2 and
= f0; 1; :::; ds
f0; 1; :::; cs
1g
1g and
To smooth both continuous and discrete variables, we use a standard multivariate product kernel for all three components in zi . By multiplying these multivariate kernel functions, we obtain a generalized product kernel function, formally expressed as: Kh (z; zi ) =
r Q 1 c l c s=1 hs
zsc
c zis
hcs
r+v Q
s=r+1
7
o lo (zso ; zis ; hos )
r+v+w Q
s=r+v+1
u lu (zsu ; zis ; hus ) ;
(12)
where lc ( ), lo ( ) and lu ( ) are univariate kernel functions and hcs , hos and hus are bandwidths for, respectively, continuous, ordered and unordered environmental variables. Regarding the continuous kernel function lc ( ), we know from the previous research that one should use kernels with compact support (i.e. kernels for which k(z) = 0 if jzj
1) such as the uniform,
triangle, Epanechnikov or quartic kernels. In this study we will use the Epanechnikov kernel (although other compact kernels deliver very similar results). For unordered variables we employ the Aitchison and Aitken (1976) discrete univariate kernel function that was designed for discrete variables without any order, while for ordered discrete variables we employ the Li and Racine (2007) discrete kernel function that also takes into account the ordering of the categories. Formally, these continuous and discrete kernel functions are given by:
lc
zsc
c zis
hcs
l
u
=
8 >
: 0
2
c zsc zis hcs
1 5
1
if
c zsc zis hcs
2
5
(13)
otherwise
u (zsu ; zis ; hus )
=
(
1
u if zis = zsu
hus
hus = (cs
1) o
o lo (zso ; zis ; hos ) = (hos )jzis
(14)
u if zis 6= zsu zso j
:
(15)
It is worth considering the two discrete kernel functions in more detail. Firstly, both the Aitchison and Aitken (1976) and Li and Racine (2007) kernel functions impose constraints for bandwidth parameters. For the former, bandwidth hus must be between 0 and (cs hos
whereas for the latter bandwidth limit values of
hus ,
1) =cs ,
can take values between [0,1]. By considering the
u u ; 0) = I(zis = zsu ) becomes we see that when hus = 0 then lu (zsu ; zis
an indicator function, while hus = (cs
u 1) =cs gives lu (zsu ; zis ; (cs
1) =cs ) = 1=cs , i.e. a
constant kernel function. The …rst special case is of particular interest, because the indicator function divides the sample to subgroups exactly the same way as the frequency-based method discussed in Section 3.1. Similarly, we can observe that when hos = 1, Li and Racine kernel o o function becomes lo (zso ; zis ; hos ) = 1 for all values of zso and zis 2 f0; 1; :::; cs
the irrelevant variable
zso
1g such that
will be smoothed out. In the conditional e¢ ciency setting, the
discrete kernel estimations boil intuitively down to in the order-m estimation drawing with a nonnegative probability of (1
hus ) observations which belong to the same class as the
evaluated observation, and with a nonnegative probability of hus = (cs for unordered variables
o o (hos )jzis zs j )
1) (or alternatively
observations which do not belong to this class. Drawing
observations which both belong to and not belong to the evaluated class smooths the discrete variable. Having presented the idea of smoothing the mixed variables with the generalized kernel approach, we apply the technique to the conditional e¢ ciency framework. For multivariate
8
z = (z c ; z o ; z u ) including continuous and unordered and ordered discrete components, the estimator for the conditional survivor function of Y can be expressed as: Pn I(xi x; yi y)Kbh (z; zi ) Pn ; SbY;n (y j x; z) = i=1 x)Kbh (z; zi ) i=1 I(xi
(16)
where Kbh (z; zi ) is the generalized multivariate kernel function speci…ed in equation (12) and b h is an estimated bandwidth vector. Further, one can again obtain the conditional e¢ ciency estimator bm;n (x; y j z) by plugging in SbY;n (y j x; z) in equation (6).
As mentioned above, the asymptotic properties of di¤erent conditional e¢ ciency estima-
tors have been studied by Cazals et al. (2002) and Jeong et al. (2010). The common …nding of these studies is the fact that the convergence rate of the conditional e¢ ciency estimator depends on the number of environmental variables. However, these studies have assumed that all the environmental variables are continuous. We know from nonparametric statistics and econometric theory that the convergence rates of the nonparametric estimators for conditional density and distribution functions involving mixed variables do not depend on the number of discrete variables. Based on the results of Li and Racine (2008), we show in the appendix that the conditional e¢ ciency estimator bm;n (x; y j z) is consistent and that its
convergence rate does not depend on the number of discrete variables in Z but only on the number of continuous variables.5 This is a relevant result for practitioners, since e¢ ciency applications use frequently several discrete exogenous factors in small or moderate samples. Finally, with respect to the estimation of bandwidth vector, it is worth noting that there does not exist a data-driven bandwidth selection approach for mixed conditional distribution function (or survivor function). However, Li and Racine (2008) suggest to estimate the bandwidth vector by the least squares cross-validation (LSCV) method based on the closely related conditional probability density function (PDF). As an advantage, this procedure can remove irrelevant covariates by oversmoothing them. Therefore, we follow the suggestion of Li and Racine (2008) and use the LSCV method developed by Hall et al. (2004) to estimate the bandwidths both for continuous and discrete exogeneous variables. Recently, Badin et al. (2010) showed how to adapt this bandwidth choice method to the conditional e¢ ciency framework in the case of continuous environmental variables. We follow the lines of Badin et al. (2010) in adapting the method to the conditional e¢ ciency framework with mixed environmental variables.6 5 As
our purpose is just to show consistency of the proposed estimator and in particular that the convergence
rate of the estimator is not sensitive to the number of discrete environmental variables, we concentrate on the case of one output (i.e. when q = 1). We leave the proof of general multiple output case and the derivation of the asymptotic distribution for further research. One could utilize the results presented in Cazals et al. (2002) and Jeong et al. (2010) to derive the asymptotic distribution of bm;n (x; y j z) . 6 It
is worth noting that Badin et al. (2010) shortly discuss (in conclusions) how their bandwidth choice
approach could be extended to the case of mixed environmental variables. Although our bandwidth choice
9
3.3
Examining the in‡uence of environmental variables on the production process
To evaluate systematically the in‡uence of environmental variables on the production process, we can compare the conditional e¢ ciency measure bm;n (x; y j z) with the unconditional e¢ -
ciency measure bm;n (x; y): In particular, we can follow the methodology suggested by Daraio
and Simar (2005, 2007) by nonparametrically regressing the estimated ratio of the condicz = bm;n (x;yjz) on environmental factors z. Note that tional and unconditional e¢ ciency Q b m;n (x;y)
this approach requires one to use estimated dependent variable, because Qz =
m;n (x;yjz) m;n (x;y)
is
generally unknown. Daraio and Simar (2005) use a smooth nonparametric kernel regression cz = fe(zi ) + i . In addition, they visualize the estimated relationships to estimate the model Q i
between environmental variables and the estimated ratio of e¢ ciency scores. Using simulations, Daraio and Simar showed that this approach allows one to detect positive, negative, neutral or even non-monotonic e¤ects of the environmental factors on the production process.
Although it can be useful to visualize the e¤ect of environmental variables on the production process, researchers are usually more interested in their statistical signi…cance. Thus, in contrast to earlier conditional e¢ ciency applications, we will not restrict to descriptive analysis, but test the signi…cance of mixed multivariate environmental variables in the production process. We follow the lines of earlier research by focusing on smoothed nonparametric regression. Like some other previous conditional e¢ ciency studies (e.g. Badin et al., 2010; Jeong et al., 2010), we use local linear regression for regression estimation. As in our framework Z can include both discrete and continuous variables, it is again useful to employ smoothing techniques which allow one to estimate the nonparametric regression model without sample splitting. Therefore, we use the nonparametric regression method developed by Racine and Li (2004), which smooths both continuous and discrete variables. To present the basic idea shortly, consider the nonparametric model:
cz = where as previously Q i
cz = fe(zi ) + i ; Q i
bm;n (xi ;yi jzi ) bm;n (xi ;yi ) ,
i = 1; :::; n
(17)
zi = (zic ; zio ; ziu ) includes values of continuous, or-
dered and unordered exogenous variables for observation i, i is the usual error term with E ( i jzi ) = 0, and fe is the conditional mean function of the estimated ratio of e¢ ciency scores. The local linear method is based on the following minimization problem: min
f ; g
n X i=1
cz Q i
e
(zic
z c )e
2
Kh (z; zi );
(18)
method is the same than their approach, we would like to emphasize that in this paper we investigate the case of including mixed environmental variables in the conditional e¢ ciency framework in much more detail.
10
where Kh is the generalized product kernel function de…ned earlier and h is the bandwidth vector (we use again the least-squares cross-validation to choose h). Let b = b (z) and b = b (z c ) denote the solutions that minimize equation (18). We know cz jz that the local linear estimators b (z) and b (z c ) are consistent estimators for fe(z) = E Q and e (z c ). However, as we are ultimately interested in estimating the impact of environmental variables on production process, we want b (z) and b (z c ) to be consistent also for the true conditional mean function f (z) = E (Qz jz ) and the gradient
(z c ) =
@E(Qz jz ) . @z c
This is
indeed the case, because the bias resulting from the estimation of the dependent variable disappears asymptotically (compare e.g. Simar and Wilson, 2007). It is important to give more justi…cation for our approach based on the estimated dependent variable. Related to this we want to emphasize that the framework does not su¤er from similar inference problems as the two-stage models based on the traditional and deterministic
FDH and DEA. There are basically three reasons why the approach avoids the problems cz is based on the listed by Simar and Wilson (2007). Firstly, since the dependent variable Q
(estimated) ratio of conditional and unconditional order-m e¢ ciency score, it is not restricted
to interval [0; 1] or [1; 1) (which is the case in traditional deterministic FDH and DEA). Sec-
ondly, as the ratio of e¢ ciency scores can be very di¤erent for di¤erent observations, at least for relatively large sample there is no reason to suspect that there would be a systematic
(serial) correlation between observations.7 Thirdly, since the framework does not assume separability (in contrast to two-stage models), there is no reason for
and Z to be systemat-
ically correlated due to the model structure or because of the true data generating process. Therefore, we can conclude that the proposed robust conditional e¢ ciency framework does not su¤er from the problems that are typical in the traditional two-stage model. After estimating the conditional mean function and the gradients for each observation, we can utilize these estimates in evaluating statistical signi…cance of individual environmental variables. To this end, we test the signi…cance of each of the continuous and each of the discrete variables using bootstrap tests, respectively, proposed by Racine (1997) and Racine et al. (2006).8 These tests can be seen as the nonparametric equivalent of standard t-tests in ordinary least squares regression. However, nonparametric test are more general than standard t-tests, as the former tests both linear and (unspeci…ed) non-linear relationships. To save space, we do not here discuss these tests, but refer to Racine (1997) and Racine et al. (2006) for technical details. 7 Note
that this can be still the case for the ratio of e¢ ciency scores based on the full frontier, or for small
samples as the dependency problem disappears asymptotically. 8 In the application we use the naive boostrap procedure, but following Racine (1997) one can adopt the wild boostrap method as well. We leave examination and comparison of alternative boostrap procedures for further research.
11
4
What explains performance of students?
4.1
Data and conceptual model
Students’test results have been shown to be heavily in‡uenced by student and school background (see e.g. Heyneman, 2005, and references therein). To examine the in‡uence of exogenous characteristics on student-level production of cognitive skills, the majority of applications assumes parametric models. Most of the studies using frontier methods also use parametric regression approaches to explain di¤erences in educational performance (or ef…ciency) of students and schools. Moreover, nonparametric studies have typically used the two-stage approach, in which e¢ ciency scores are …rst estimated with a nonparametric estimator and then explained with the environmental factors using a parametric regression model. Both parametric and two-stage nonparametric estimators typically require an a priori speci…ed functional form for e¢ ciency scores. Even though the parametric structure allows these estimators to have a faster rate of convergence, they are also more vulnerable to biased estimations due to speci…cation error. Therefore, in our educational application we favor the outlined nonparametric conditional e¢ ciency approach, which does not require any kind of functional form or parametric assumptions. The conditional e¢ ciency framework guarantees that performance scores for individual students and the impact of environmental variables are estimated using only observations to which the values of background characteristics are very similar.9 One should note that in general it depends on the application and the data in hand whether one can control all the background variables a¤ecting the outcome in the cross-sectional setting. However, since in the present application there can be unobserved heterogeneity (e.g. ability) that a¤ects students’performance but is not necessarily captured by the variables of our cross-sectional data, we leave the estimation of causal impacts of environmental variables on performance for future research. The main purpose of our application is to show how conditional e¢ ciency scores can be estimated and used to study performance drivers when there are large number of continuous and categorical exogenous variables. To study educational performance, we use the data obtained from the international PISA data set for 2006. The latter OECD survey is currently at its fourth wave and includes survey data for more than 400,000 pupils from 57 countries. The sample at hand consists of all Dutch students in the PISA data set. This corresponds to a sample of 3,992 students 9 In
fact, the proposed approach can be seen as a matching estimator, which employs z-variables to match
the most similar observations (here students) and then uses these matched observations to estimate performance scores. Like other matching estimators, the proposed method could be in principle used to study the causal impact of educational programs or policies on the outcome variable (here performance scores instead of test results; for a discussion, see De Witte and Van Klaveren, 2012).
12
at the age of 15 years old.10 Besides a survey at pupil level, the PISA data set consists of a survey at school and parental level. The surveys attempt to capture the socioeconomic background of the pupil. In line with previous literature (e.g. Hanushek, 1996; Cherchye et al., 2010), we consider students attainments on (1) math, (2) language and (3) sciences as three separate outputs in the analysis. We consider as output variables the …rst plausible value in the PISA data set for each of the three subjects (similarly to OECD, 2007). The inputs are measured by the time (in minutes) that the student indicated he/she is devoting to the three subjects. The total sum of time devoted to the three subjects is preferred on including the three time allocations separately in the analysis, as there might arise signi…cant measurement errors from the time devoted to each of the three subjects separately. For example, students learn languages during the math courses, and time for homework is not clear-cut in the three subjects. In sum, student performance is considered as obtaining output attainments for a given amount of learning time. It is clear that in the application at hand the separability condition would complicate the analysis as test scores are in‡uenced by background characteristics (e.g. ethnicity, native language, education of the parents). Following standard literature, we account in the analysis for both (1) class and school characteristics, as well as for (2) the background of the student. In particular, we estimate two model speci…cations which use the same input and outputs and the same non-school related background variables. Summary statistics on the variables in both models are presented in Table 1. As the …rst background variable, we include student grade as the PISA data set surveys 15 year old people whatever their grade. Therefore, some students might have retentions and, thus, lower attainments. Second, we include education of the mother and the father (de…ned by the ISCED indicator, where a higher value indicates higher educational attainments). Higher educated parents are more aware of the importance of schooling and motivate their children for higher educational attainments. Third, the number of books at home serves as a proxy for the socioeconomic status of the family. Fourth, the country of birth of the mother (either born in the Netherlands or abroad) indicates the migrant status of the parents. On the contrary, native language and immigrant status (i.e. native, …rst or second generation) indicate the migrant status of the student. We further capture whether the student has his/her own room as this serves as a proxy for wealth and housing accommodation of the student. Finally, family structure (single parent family, nuclear parents, mixed parents or 1 0 The
pupil speci…c weights, which are included in the Pisa data set to make the sample representative,
are ignored in the paper at hand for two reasons. Firstly, to our best knowledge the nonparametric e¢ ciency literature cannot appropriately deal with similar sampling weights. Secondly, since our purpose is not to make conclusions on educational e¢ ciency or its drivers in the Netherlands, we do not …nd it important to include weights or accunt for sampling in some alternative way in the present application.
13
other) indicate the social stability where the student is grown up. All of these variables are in line with previous literature (see Hampden-Thompson and Johnston, 2006 and references therein).11 In addition to student-speci…c background variables our …rst model speci…cation includes school indicators, which basically replace any other school level variation. This model captures school level heterogeneity, but do not allow us to include any other school level variables that we might be interested in. Therefore, we also estimate a second model, where we exclude school indicators and try to capture school level variation using several school-level variables. First, school size and the student-teacher ratio (capturing school resources) are included as control variables. Note that these variables can only be considered as control variables in the current cross-sectional analysis, because they might be in‡uenced by unobserved heterogeneity which disables causal statements (or interpretation). Second, we include the average socioeconomic status (SES) and the percentage of girls at the school in order to capture peer e¤ects that are related to the socioeconomic environment and (possibly) more motivated girls (Carrington et al., 2008). Finally, we include average amount of mathematics teaching at school and the proxy variable on school autonomy to capture other school speci…c characteristics. In the conditional e¢ ciency and nonparametric regression estimations we use the same kernel functions as described in Section 3.2. The optimal sample size m is selected following Daraio and Simar (2005). For small values of m, there will be many super-e¢ cient observations. For m going to in…nity, super-e¢ cient observations will disappear. As m increases, this percentage of super-e¢ cient observations decreases only marginally. Daraio and Simar (2005) suggested to use the value of m for which the decrease in super-e¢ cient observations stabilizes. In the application at hand, this corresponds to m = 100. Finally, for statistical inference, we use 1000 bootstrap replications.
1 1 Ideally,
we would also like to account for student-speci…c unobserved heterogeneity that is constant over
time. This is, however, not possible in the PISA sample, which is a cross-sectional data set.
14
15
3.74 3.39 1.15 1.34 1.03 1.96 1.15
Education father (level at ISCED) Number of books at home Country of birth (1=Neth.; 2=abroad)
Language at home (1=test lang.; 2=other national; 3=other language; 4=N/A) Have your own room (1=yes; 2= no)
Family structure (1=single parent;2=nuclear parent;3=mixed parent;4=other) Immigrant status (1=native; 2=second-gen.;3=…rst gen.)
3682.00 966.60 0.48 15.50 1.36 0.11
Minutes math at school School size Percentage girls (%) Student-teacher ratio School autonomy (estimate based on principal questionnaire) Average school SES
School level variables (only in model without school indicators)
3.63
529
Test score science
Education mother (level at ISCED)
517
Test score reading
9.47
542
1434.87
Test score math
Total hours devoted to math, language and science
Mean
Grade
Background characteristics
Output
Input
Table 1: Descriptive statistics
0.44
0.53
3.48
0.10
537.34
89.83
0.45
0.50
0.18
0.83
0.35
1.50
1.17
1.16
0.60
94
81
90
295.22
St.Dev
-1.11
-1.49
7.50
0.00
53
0
1.00
1.00
1.00
1.00
1.00
1.00
1.00
1.00
7.00
250
249
254
300
Minimum
1.17
1.69
29.37
0.73
2617
1800
3.00
4.00
2.00
4.00
2.00
6.00
5.00
5.00
12.00
774
730
762
3600
Maximum
4.2
Results
We …rst consider student performance without controlling for background characteristics. To do so, we estimate the robust order-m model. Median performance score amounts to be bm (x; y) = 1:25 (see also Table 2). This indicates that if all pupils would perform as e¢ ciently as the best practice pupils, the test scores could on average increase by 25%. Note that some
pupils have a performance score below 1. These ‘super-e¢ cient’pupils are performing better than the average m (m = 100) pupils they were benchmarked with. We next control for heterogeneity among students by estimating the conditional e¢ ciency model. First consider the model with school indicators. By controlling for background characteristics of students, the median ine¢ ciency decreases to bm (x; y j z) = 1:15. This is intuitive
as the reference sample (against which the performance scores are estimated) is smaller and includes only students with a similar background. The mean performance for the estimations without school indicators is slightly higher with bm (x; y j z) = 1:18 . Also the estimates of the other moments are slightly higher in the model speci…cation without school e¤ects.
Summary statistics for the pupil-speci…c bandwidth estimates for both model speci…ca-
tions are presented in Table 2. Note that the bandwidth selection is observation and model speci…c (see Badin et al., 2010, for details). In both model speci…cations, the average bandwidth for ’number of books at home’ is very large. This might be due to outlying values. Nevertheless, the median value is reasonable. The high maximum values can be a result of e¤ectively smoothing out the insigni…cant variable for particular evaluated observations. The narrow median bandwidths of each of the exogenous variables are predicting a signi…cant in‡uence on the production process. As the bandwidth provides only suggestive evidence, a more formal bootstap test is implemented next. To examine the in‡uence of the exogenous variables, we nonparametrically regress the ratio of the conditioned e¢ ciency scores to the unconditional scores on the exogenous variables. The signi…cance tests (p-values), presented in Table 3, indicate that all student-level characteristics have a signi…cant impact on student performance. From the partial regression plots for the discrete and continuous variables (see below), we observe the direction of the average e¤ect on performance (see Table 3). Note that in the case of categorical variable one can alternatively estimate average ine¢ ciency scores for di¤erent values of the variable and compare the average scores. We next explore the results in more detail. To save space, we start from the similarities between the two model speci…cations. First, we observe that the higher the grade, the higher the performance. This is intuitive as 15 years old students in higher grades should have acquired more knowledge. Secondly, and in line with previous literature, education of the mother and father and the number of books at home, have a favorable in‡uence on performance (Heyneman, 2005). Students whose mother is born in the Netherlands obtain
16
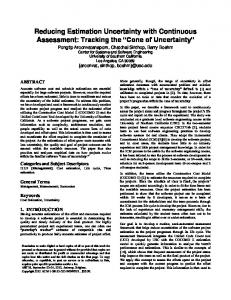
higher educational attainments for a given time investment; so do students who speak the test language at home (rather than another language), live in a nuclear parents family or possess their own room. These results are in line with previous studies (see e.g. Carrington et al., 2008). To allow for a better interpretation, we use partial regression plots to visualize and interpret the e¤ect of the exogenous environment on student performance. In a generalized multivariate framework, we set all other exogenous variables on their median value. (Discrete variables are evaluated once at each category and continuous variables at 50 evaluation points.) While keeping all other exogenous variables at their median value, we evaluate the variable (in casu family structure and immigration status) at its di¤erent data points. Interestingly, from the partial regression plot of family structure in Figure 1 we observe that a mixed parents family has a more favorable in‡uence on student performance than a single parents family. Additionally, we observe from the partial regression plot of immigrant status in Figure 2 that the …rst generation students are performing better than the second generation students.12 Next consider the school variables. The school indicators (model 1) do not have a signi…cant in‡uence on student performance. This is also observed in model 2, where the school e¤ects are replaced by variables capturing the heterogeneity across schools. None of these variables have a signi…cant impact on performance. However, note that school size and student-teacher ratio can only be considered as control variables in the current cross-sectional analysis, as they are in‡uenced by unobserved heterogeneity that we cannot control for in model 2. Note that also the other results should be interpreted with caution as there is the possibility of endogeneity in the estimations. We consider an extension of the framework to estimation of causal e¤ects on performance as further research and neglect it in the paper at hand.
5
Conclusions
By using insights from recent nonparametric econometrics literature, this paper extends the conditional e¢ ciency model (Cazals et al., 2002; Daraio and Simar, 2005) to mixed heterogeneous variables. Similar to mixed nonparametric models, the discrete component does not su¤er from the curse of dimensionality problem, which is the case for continuous environmental variables. As the second contribution, this paper utilized bootstrap procedures for testing the signi…cance of continuous and discrete environmental variables in the production process. In contrast to inference based on more traditional two-stage models, these tests can 1 2 The
other partial regression plots are available upon request.
17
Table 2: E¢ ciency estimates and bandwidths Min.
Quartile 1
Median
Average
Quartile 3
Maximum
Unconditional performance
0.9295
1.1271
1.2524
1.2967
1.4178
2.6020
Conditional performance in Model 1
1.0000
1.0671
1.1536
1.1889
1.2766
2.0262
0.9647
1.1048
1.1872
1.2169
1.2982
2.0591
(with school dummies) Conditional performance in Model 2 (without school dummies) Bandwidth - Model 1 (with school indicators) Grade
0.0009
0.0576
0.1602
0.1215
0.1717
0.1959
Education mother (level at ISCED)
0.1290
0.4489
0.5613
0.5143
0.5749
0.5753
Education father (level at ISCED)
0.0196
0.4217
0.5491
0.4954
0.5732
0.5753
Number of books at home
0.3661
0.8085
1.1096
1.519E+05
1.1367
6.623E+07
(1=Neth.;
0.0001
0.4836
0.5479
0.4836
0.5736
0.5753
Language at home (1=test language;
0.0066
0.5114
0.5285
0.5273
0.5577
0.5753
Have your own room (1=yes; 2= no)
0.0132
0.5635
0.5746
0.5365
0.5753
0.5753
Family
0.0077
0.4348
0.4846
0.4528
0.4967
0.5733
0.0677
0.4803
0.5131
0.4982
0.5587
0.5753
0.0539
0.1148
0.1338
0.3122
0.5654
0.5753
Country
of
birth
2=abroad)
2=other national; 3=other language; 4=N/A)
structure
ent;2=nuclear
(1=single
par-
parent;3=mixed
parent;4=other) Immigrant
status
(1=native;
2=second-gen.;3=…rst gen.) School dummy
18
Table 2: E¢ ciency estimates and bandwidths - continued Min.
Quartile 1
Median
Average
Quartile 3
Maximum
Bandwidth - Model 2 (without school indicators) Grade
0.0248
0.0358
0.0423
0.0527
0.0516
0.5712
Education mother (level at ISCED)
0.0051
0.5015
0.5262
0.5266
0.5676
0.5753
Education father (level at ISCED)
0.0765
0.4393
0.5447
0.4935
0.5740
0.5753
46.1617
231.2108
360.2197
1.096E+07
7.060E+06
2.000E+08
(1=Neth.;
0.0976
0.5723
0.5749
0.5543
0.5753
0.5753
Language at home (1=test language;
0.0286
0.5414
0.5744
0.5518
0.5753
0.5753
Have your own room (1=yes; 2= no)
0.0000
0.4701
0.5750
0.5029
0.5753
0.5753
Family
0.1510
0.4057
0.4541
0.4401
0.5145
0.5753
0.1489
0.3578
0.4080
0.4277
0.5121
0.5753
Minutes math at school
0.2569
0.3066
0.3435
0.3531
0.3801
0.5753
School size
0.0976
0.5723
0.5749
0.5543
0.5753
0.5753
Percentage girls (%)
0.0286
0.5414
0.5744
0.5518
0.5753
0.5753
Student-teacher ratio
0.0000
0.4701
0.5750
0.5029
0.5753
0.5753
School autonomy (estimate based on
0.1510
0.4057
0.4541
0.4401
0.5145
0.5753
0.1489
0.3578
0.4080
0.4277
0.5121
0.5753
Number of books at home Country
of
birth
2=abroad)
2=other national; 3=other language; 4=N/A)
structure
ent;2=nuclear
(1=single
par-
parent;3=mixed
parent;4=other) Immigrant
status
(1=native;
2=second-gen.;3=…rst gen.)
principal questionnaire) Average school SES
19
Table 3: Nonparametric signi…cance test p-value
Average e¤ect revealed
Performance is increased by:
from
partial plot Model 1 (with school indicators) Grade
0.01 ***
Favorable
Higher grade
Education mother
0.01 ***
Favorable
A more highly educated mother
Education father
0.01 ***
Favorable
A more highly educated father
0.92
Favorable
Number of books at home Country of birth
0.01 ***
Native > born abroad
Language at home
0.01 ***
Test language > other national > other language
Have your own room
0.01 ***
Yes > no
Family structure
0.01 ***
Nuclear parent > mixed parent = other > single parent
Immigrant status
0.01 ***
Native > …rst-generation > second-generation
School dummy
1.00
Model 2 (without school indicators) Grade
0.01 ***
Favorable
Higher grade
Education mother
0.01 ***
Favorable
A more highly educated mother
Education father
0.01 ***
Favorable
A more highly educated father
Number of books at home
0.01 ***
Favorable
More books at home
Country of birth
0.01 ***
Native > born abroad
Language at home
0.01 ***
Test language > other national > other language
Have your own room
0.01 ***
Yes > no
Family structure
0.01 ***
Nuclear parent > mixed parent = other > single parent
Immigrant status
0.01 ***
Native > …rst-generation > second-generation
Minutes math at school
1.00
Favorable
School size
0.39
Favorable
Percentage girls (%)
0.82
Favorable
Student-teacher ratio
0.82
Unfavorable
School autonomy
0.97
Favorable
Average school SES
0.82
Favorable
20
Figure 1: Partial regression plot of family structure
Figure 2: Partial regression plot of immigrant status
21
be used without assuming separability and without any parametric functional forms. The suggested approach was illustrated using the full sample of Dutch students in the OECD PISA data set. In the empirical application, we examined the performance of secondary school pupils while taking into account a broad range of continuous, ordered as well as unordered discrete exogenous factors. We estimated the performance of Dutch students while controlling for classic variables such as education of the parents and some school-level variables. While most of the empirical results are in line with the (parametric) literature, some results reveal a di¤erent outcome in contrast to previous literature. We observe, e.g., that a mixed parents family has a more favorable in‡uence on student performance than a single parent family. Moreover, the …rst generation students are performing better than the second generation students. This paper touches various issues for further research, which arise from the disadvantages of the current method. First of all, there is the computational burden of the approach. It takes a long time to estimate the kernel bandwidth and the nonparametric regression with large sample sizes. Further research should add some structure to the model to reduce the computational time. Second, the conditional e¢ ciency literature basically neglects endogeneity and causality issues. Indeed, e¢ ciency estimations are currently only concerned with the correlation between background variables and e¢ ciency outcomes. This contrasts to the modern microeconometrics literature in which causality is a serious issue in nearly all regressions. A …nal avenue for further research arises from the empirical applications in other areas. By re-estimating parametric applications in a fully nonparametric way, novel insights may be obtained. To facilitate further research, the R code is available upon request.
References [1] Aitchison, J. and C.B.B. Aitken (1976). Multivariate Binary Discrimination by Kernel Method. Biometrika 63, 413-420. [2] Badin, L., C. Daraio and L. Simar (2010). Optimal Bandwidth Selection for Conditional E¢ ciency Measures: A Data-Driven Approach. European Journal of Operational Research 201 (2), 633-640. [3] Carrington, B., P. Tymss and C. Merrell (2008). Role Models, School Improvement and the ’Gender Gap’- Do Men Bring out the Best in Boys and Women the Best in Girls? British Educational Research Journal 34 (3), 315–327. [4] Cazals, C., J.P. Florens and L. Simar (2002). Nonparametric Frontier Estimation: A Robust Approach. Journal of Econometrics 106 (1), 1-25.
22
[5] Charnes, A., W.W. Cooper and E. Rhodes (1978). Measuring E¢ ciency of DecisionMaking Units. European Journal of Operational Research 2 (6), 428-449. [6] Cherchye, L., K. De Witte, E. Ooghe and I. Nicaise (2010). Equity and E¢ ciency in Private and Public Education: A Nonparametric Comparison. European Journal of Operational Research 202, 563-573. [7] Daraio, C. and L. Simar (2005). Introducing Environmental Variables in Nonparametric Frontier Models: A Probabilistic Approach. Journal of Productivity Analysis 24 (1), 93–121. [8] Daraio, C. and L. Simar (2006). A Robust Nonparametric Approach to Evaluate and Explain the Performance of Mutual Funds. European Journal of Operations Research 175 (1), 516-542. [9] Daraio, C. and L. Simar (2007). Advanced Robust and Nonparametric Methods in Ef…ciency Analysis. Methodology and Applications. Series: Studies in Productivity and E¢ ciency, Springer. [10] Deprins, D., L. Simar and H. Tulkens (1984). Measuring Labor E¢ ciency in Post Of…ces. In Marchand M., P. Pestieau and H. Tulkens (eds.), The Performance of Public Enterprises: Concepts and Measurements. Amsterdam, North-Holland. pp. 243-267. [11] De Witte, K. and B. Geys (2011), Evaluating E¢ cient Public Good Provision: Theory and Evidence from a Generalised Conditional E¢ ciency Model for Public Libraries. Journal of Urban Economics 69 (3), 319-327. [12] De Witte, K. and R. Marques (2011), Big and Beautiful? On Non-Parametrically Measuring Scale Economies in Non-Convex Technologies. Journal of Productivity Analysi s 35 (3), 213-226. [13] De Witte, K. and N. Rogge (2011), Accounting for Exogenous In‡uences in Performance Evaluations of Teachers. Economics of Education Review 30 (4), 641 - 653. [14] De Witte, K. and D. Saal (2010), The Regulator’s Fault? On the E¤ects of Regulatory Changes on Pro…ts, Productivity and Prices in the Dutch Drinking Water Sector. Journal of Regulatory Economics 37 (3), 219-242. [15] De Witte, K. and C. Van Klaveren (2012), How Uniform Incentives Can Provide a Negative Motivation – An Application to Early School Leaving in Two Large Cities. Applied Economics. In Press. [16] Farrell, M. (1957). The Measurement of Productive E¢ ciency. Journal of the Royal Statistical Society 120 (3), 253-290. 23
[17] Fried, H., C.A.K. Lovell and S. Schmidt (2008). The Measurement of Productive E¢ ciency and Productivity Growth. Oxford University Press, pp. 638. [18] Hall, P., J.S. Racine and Q. Li (2004). Cross-Validation and The Estimation of Conditional Probability Densities. Journal of the American Statistical Association 99 (468), 1015–1026. [19] Hampden-Thompson, G. and J. Johnston (2006). Variation in the Relationship between Nonschool Factors and Student Achievement on International Assessments. National Center for Education Statistics: Statistics in Brief, NCES 2006-014. [20] Hanushek, E.A. (1996), School Resources and Student Performance. In Burtless, G. (Eds.) Does money matter? The e¤ ect of school resources on student achievement and adult success. Brookings Institution, pp. 43-73. [21] Hay…eld, T. and J.S. Racine (2008). Nonparametric Econometrics: The Np Package. Journal of Statistical Software 27 (5). [22] Heyneman, S.P. (2005). Student Background and Student Achievement: What is the Right Question?. American Journal of Education 112 (1), 1-9. [23] Jeong, S., B. Park and L. Simar (2010). Nonparametric Conditional E¢ ciency Measures: Asymptotic Properties. Annals of Operations Research 173(1), 105-122. [24] Li, Q., and J.S. Racine (2007). Nonparametric Econometrics: Theory and Practice. Princeton University Press. [25] Li, Q. and J.S. Racine (2008). Nonparametric Estimation of Conditional CDF and Quantile Functions with Mixed Categorical and Continuous Data. Journal of Business and Economic Statistics 26 (4), 423-434. [26] OECD (2007). PISA 2006 Science Competencies for Tomorrow’s World: Vol 1. Paris, Organisation for Economic Co-operation and Development. [27] Perelman, S. and D. Santin (2011) Measuring Educational E¢ ciency at Student Level with Parametric Stochastic Distance Functions: An Application to Spanish PISA results. Education Economics 19 (1), 29-49. [28] Racine, J.S. (1997). Consistent Signi…cance Testing for Nonparametric Regression. Journal of Business and Economic Statistics 15 (3), 369-379. [29] Racine, J. S., J. Hart and Q. Li (2006). Testing the Signi…cance of Categorical Predictor Variables in Nonparametric Regression Models. Econometric Reviews 25 (4), 523-544.
24
[30] Racine, J.S. and Q. Li (2004). Nonparametric Estimation of Regression Functions with both Categorical and Continuous Data. Journal of Econometrics 119 (1), 99–130. [31] Simar, L. and P. Wilson (2007). Estimation and Inference in Two-Stage, SemiParametric Models of Production Processes. Journal of Econometrics 136 (1), 31–64.
Appendix To show the consistency of proposed estimators, we make the following assumptions. Assumption (A1): The sample observations Sn = f(xi ; yi ; zi ) j i = 1; :::; ng are realiza-
tions of independent and identically distributed (iid) random variables (X; Y; Z) with the probability density function fXY Z (x; y; z). Both the marginal density function fZ (z) and
the conditional survivor function SY (y j x; z) have continuous second order partial derivatives with respect to z c . For …xed values of x; y and z, fZ (z) > 0 and 0 < SY (y j x; z) < 1:
Assumption (A2): lc ( ) is a symmetric, bounded, and compactly supported density func-
tion. Assumption (A3): As n ! 1, hcs ! 0 for s = 1; :::; r, hos ! 0 for s = 1; :::; v, hus ! 0 for
s = 1; :::; w, and nhc1 hc2 :::hcr ! 1.
Assumption (A4): Estimated bandwidths are consistent estimators for the nonstochastic cu hu = op (hu ). co ho = op (ho ); h cc hc = op (hc ); h optimal smoothing parameters: h s
s
s
s
s
s
s
s
s
The following proposition show consistency of SbY;n (y j x; z) and bm;n (x; y j z) and give
the convergence rate for the proposed estimators.
Proposition 1 Under Assumptions (A1) to (A4), (i) SbY;n (y j x; z) converges to SY (y j x; z) with Op (nhc1 hc2 :::hcr )
(ii) bm;n (y j x; z) converges to m.
m (y
1 2
j x; z) with Op (nhc1 hc2 :::hcr )
1 2
for any …xed value of
Proof. (i) First, note that we can write the conditional survivor function estimator as: P I(yi y)Kbh (z; zi ) x P SbY;n (y j x; z) = i2N ; i2Nx Kb h (z; zi )
(19)
b where Pn Nx = fxi j I (xi x) = 1, i = 1; :::; ng. Li and Racine (2008) prove that FY;n (y j z) = y)Kbh (z; zi ) i=1 I(yi Pn converges to FY (y j z) in mean square error (and hence in probabilK b i=1 h (z; zi ) ity) with Op (nhc1 hc2 :::hcr )
1 2
under regularity conditions that are similar to Assumptions 25
(A1)-(A4). Besides X
x, the only di¤erence to Li and Racine (2008) is that we are es-
timating the conditional survivor function SY (y j z) instead of the conditional distribution
function FY (y j z). In the case of univariate output (i.e. q =1), by de…nition we have that
SY (y j z) = 1
X
x:
FY (y j z). Therefore, their results extends to our case when condition on
(ii) Note that for any …xed (and …nite) value of m, the order-m conditional e¢ ciency estimator bm;n (y j x; z) is a continuous function of SbY;n (y j x; z), since integral is a continuous functional. Then, the result follows directly from the proof of (i) and from Continuous Mapping Theorem.
26