Incorporating the number of carbon atoms to one of the calculated indices gives a highly ...... (Hf), Pitzer eccentric factor (Ï) and octane numbers (MON).
Highly Correlating Distance/Connectivity-Based Topological Indices
Bull. Korean Chem. Soc. 2004, Vol. 25, No. 2
253
Highly Correlating Distance/Connectivity-Based Topological Indices. 1: QSPR Studies of Alkanes Mojtaba Shamsipur,* Bahram Hemmateenejad,† and Morteza Akhond‡
†
Department of Chemistry, Razi University, Kermanshah, Iran Medicinal & Natural Products Chemistry Research Center, Shiraz University of Medical Science, Shiraz, Iran ‡ Department of Chemistry, Shiraz University, Shiraz, Iran Received May 20, 2003 Some new topological indices based on the distance matrix and Randic connectivity (as graph invariants) are proposed. The calculation of these indices is simple and they have good discriminating ability toward alkanes. Incorporating the number of carbon atoms to one of the calculated indices gives a highly correlating topological index (Sh index) which found to correlate with selected physicochemical properties of wide range of alkanes, specially, their boiling points. Most of the investigated properties are well modeled (with r2 > 0.99) by the Sh index. Meanwhile, the resulting regressions were compared with the results based on the well-established Randic and newly reported Xu indices and, in most cases, better results were obtained by the Sh index. Moreover, multiple linear regression analysis of the alkane properties via calculated indices gives highly correlating models with low standard errors. Key Words : Topological index Sh, QSPR, Alkanes
Introduction A fundamental concept of chemistry is that the structural characteristics of a molecule are responsible for its properties.1 Topological indices are a convenient means of translating chemical constitution into numerical values which can be used for correlation with physical properties in quantitative structure-property/activity relationship (QSPR/ QSAR) studies.2,3 The use of graph invariant (topological indices) in QSPR and QSAR studies has become of major interest in recent years.4-6 The need to represent molecular structure by a single number arises from the fact that most molecular properties are recorded as a single number. Characterization of a molecule by a single number represents a considerable loss of information: A three-dimensional object (molecule) is described by a one-dimensional object (topological index). However, what is surprising is how much of the relevant structural information is still retained in a given topological index. Ideally, a good topological index should show low degeneracy (isomer discrimination) and high correlation ability. There are more than 120 topological indices available in the literature4 including the famous Randic index (χ),7 Wiener number (W),8 Hosoya index (Z)9 Balaban index (J),10 Schultz index (MTI),11 Harary index (H)12 and so on. However, among these indices the most successful was the Randic molecular connectivity χ which is used in much of QSAR/QSPR studies.13 Despite the large achievements attained in this field, existing topological index approaches to QSAR/QSPR need further improvement. Very recently Xu and their coworkers14,15 proposed a new topological index based on the combination of distance sum and vertex degree of atoms. This index has been applied to QSPR study of alkanes successfully.
In this study we proposed some new topological indices based on the combination of connectivity and distance sum using Randic7 and Balaban10 approach. Correlation of boiling point of alkanes with these indices was studied. Introduction of number of carbon atoms in one of our indices results in very highly correlating topological indices for studying some alkane properties including normal boiling point, heat capacity, critical temperature and pressure, constants of van der Waals equation (a and b) and so on. The results were compared with the other topological indices such as Randic and Xu indices. Theoretical Section Let G = {V, E} be a hydrogen depleted graph of a molecule with n atom, where V is the vertex set and E the edge set.13 The distance matrix of a graph is D = {dij}nxn whose entries dij are the distance between vertices, so that in a constitutional graph all entries on the main diagonal are 0 and the other ones are non-zero integers, the shortest distance between vertices i and j. The distance sum (s) for each vertex results by adding entries in the row or column of the distance matrix corresponding to that vertex. The adjacency matrix is A = {aij}nxn whose entries are 1 for adjacent vertices i, j and zero otherwise. The topological indices derived from only A or D result in a considerable loss of structural information in a graph G and cannot be used for heteroatom-containing molecule successfully. The connectivity term δ represented by Randic7 for each vertex (atom) is calculated by the following equation:
δ = Nv − H
(1)
where Nv is the number of valence electrons of considered atom and H is the number of hydrogen atom adjacent to that
254
Bull. Korean Chem. Soc. 2004, Vol. 25, No. 2
Mojtaba Shamsipur et al.
atom. The Randic index calculated based on the connectivity term is the most successful index applied in most of the QSAR/QSPR studies, specially for heteroatom-containing molecules.5,13,16,17 The recently proposed Xu parameter15 derived from a combination of distance and adjacency matrices has a better correlation ability in QSPR study of alkanes than those indices derived from D, A or connectivity. In this paper, we were interested to define some new topological indices by combination of connectivity and distance sum. Thus, we defined different combinations of distance sum s and connectivity d using Randic7 and Balaban10 approaches: si sj Sh 1 = log Σ --------- δi δj
(2)
δi δj Sh 2 = log Σ --------- si sj
(3)
Sh 3 = log ( Σ ( s i s j δ i δ j )
– 0.5
)
(4)
δ i δ j – 0.5 Sh 4 = log Σ --------- s i sj
(5)
Sh 5 = Σ ( s i s j + δ i δ j )
(6)
– 0.5
Sh 6 = logΣ ( ( s i s j ) + ( δ i δ j ) )
(7)
Sh 7 = Σ ( δ i δ j + log ( s i s j ) )
(8)
In above equations, the sums were given over all edges (bonds) and i and j represent the two adjacent atoms. Three other proposed indices were calculated based on individual methods: The distance sums were collected in a row vector (S) and connectivities in another row vector (δ). The logarithm of the inner product of S and transpose of δ (δT) gives the Sh8 index: Sh8 = log(Sδ T)
(9)
The inner product of transpose of S(ST) and δ gives a square matrix (Sd). The sum over all entries of Sd is Sh9 index: Sd = S δ T
(10)
Sh 9 = log ∑ ∑ Sd ij i
(11)
j
Sd = UΣV
Sh10 = log(ES)
(12)
Σ is a diagonal matrix whose elements are the eigen values of Sd, U and V are row and column designate of Sd. In our work, Sd has only one eigen value and other eigen values are zero. We represented the eigen value of Sd by ES, so that Sh10 is defied as:
(13)
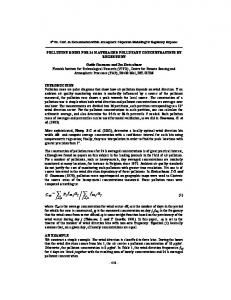
As an example, the labeled hydrogen depleted graph of 2methylpentane is shown in Figure 1. The corresponding Sh indices of this molecule are then calculated as follows: The distance matrix D and distance sum S vector are
D=
0 1 2 3 4 2
1 0 1 2 3 1
2 1 0 1 2 2
3 2 1 0 1 3
4 3 2 1 0 4
2 1 2 3 4 0
S=
12 8 8 10 14 12
and the connectivity δ vector is:
δ= 1 3 2 2 1 1
12 × 8 8 × 8 8 × 10 10 × 14 8 × 12 Sh1 = log --------------- + ------------ + --------------- + ------------------ + --------------- 1×3 3×2 2×2 2×1 1×3 = 2.22 1×3 3×2 2×2 2×1 1×3 Sh2 = log --------------- + ------------ + --------------- + ------------------ + --------------- 12 × 8 8 × 8 8 × 10 10 × 14 8 × 12 = 0.22 Sh3 = log( 12 × 8 × 1 × 2 + 8 × 8 × 3 × 2 + 8 × 10 × 2 × 2 + 10 × 14 × 2 × 1 + 8 × 12 × 1 × 3 )−0.5 = -0.55 1 × 3 –0.5 3 2 × 2- – 0.5 × 2 – 0.5 -------------Sh4 = log --------------- + ------------ + 12 × 8 8 × 8 8 × 10 2 × 1 – 0.5 -------------1 × 3- –0.5 + ------------------ + = 1.44 10 × 14 8 × 12 Sh5 = ( 12 × 8 + 1 × 2 )
The Sh10 index was calculated by the summation over eigen values of Sd matrix. The eigen values of Sd are calculated by singular-value decomposition (SVD).18 In SVD an individual matrix is decomposed to three matrices: (i.e., U, Σ and V): T
Figure 1. Labeled hydrogen depleted graph of 2-methylpentane.
– 0.5
+ (8 × 8 + 3 × 2)
+ ( 8 × 10 + 2 × 2 )
– 0.5
+ ( 8 × 12 + 1 × 3 )
– 0.5
– 0.5
+ ( 10 × 14 + 2 × 1 )
– 0.5
= 0.51
Sh6 = log[ ( 12 × 8 + 1 × 2 ) + ( 8 × 8 + 3 × 2 ) + ( 8 × 10 + 2 × 2 ) + ( 10 × 14 + 2 × 1 ) + ( 8 × 12 + 1 × 3 ) ] = 2.68 Sh7 = [log ( 12 × 8 ) + 1 × 2 ] + [log ( 8 × 8 ) + 3 × 2 ] + [log ( 8 × 10 ) + 2 × 2 ] + [log ( 10 × 14 ) + 2 × 1 ] + [log ( 8 × 12 ) + 1 × 3 ] = 40.61 Sh8 = log(S.δ T) = 1.99
Highly Correlating Distance/Connectivity-Based Topological Indices
Sd = ST.δ =
12 8 8 10 14 12
36 24 24 30 42 36
24 16 16 20 28 24
24 16 16 20 28 24
12 8 8 10 14 12
12 8 8 10 14 12
Sh9 = 6 × 12 + 6 × 24 + 2 × 20 + 2 × 36 + 6 × 8 + 4 × 16 + 2 × 28 3 × 10 + 30 + 42) = 2.81 SS = SVD(Sd) = | 119.33 0 0 0 0 0 | S = 119.33 Sh10 = log(119.33) = 2.08 Results and Discussion Usually simplest QSPR studies start with studying the alkane properties. Boiling point (BP) of organic compounds is predetermined by the intermolecular interactions in the
Bull. Korean Chem. Soc. 2004, Vol. 25, No. 2
255
liquid state and by the difference in the molecular internal partition functions in the gas and liquid phases at boiling temperature. Therefore, it should be directly related to the chemical structure of the molecule and, thus, several methods have indeed been developed for estimation the normal BP of a compound from its structure.17,19,20 Other physical properties such as critical temperature21 and flash point22 can be estimated from BP. Thus, we used normal BP of alkanes as starting point in our QSPR models. The calculated Sh indices of C2-C9 alkanes and their normal BPs are shown in Table 1. In order to find the best Sh indices for modeling the alkane properties, we constructed a QSPR model for each index separately. Some indices show linear behavior and others have second ordered correlation. The resulting regression equations and the corresponding statistical parameters are represented in Table 2. In this Table, a is the intercept of the regression equation, b and c are the coefficient of first and second power of Sh indices, respectively, and r, s and f are correlation coefficient, standard error of regression and Fischer criterion of regression respectively. As shown, all
Table 1. Normal boiling points of C2-C9 alkanes, their calculated Sh indices and boiling points predicted by Sh index (a) and MLR (b) No.
Alkanes
Sh1
Sh2
Sh3
Sh4
Sh5
Sh6
Sh7
Sh8
Sh9
Sh10
Sh
1 2 3 4 5 6 7 8 9 10 11 12 13 14 15 16 17 18 19 20 21 22 23 24 25 26 27 28 29 30
2 3 4 2M3 5 2M4 22MM3 6 2M5 23MM4 33MM4 3M5 7 2M6 3M6 24MM5 3E5 22MM5 23MM5 33MM5 223MMM4 8 2M7 3M7 4M7 22MM6 25MM6 3E6 24MM6 23MM6
0 0.78 1.45 1.18 1.96 1.77 1.45 2.37 2.22 2.03 2 2.21 2.71 2.59 2.58 2.43 2.56 2.41 2.43 2.4 2.23 3.01 2.9 2.89 2.88 2.75 2.77 2.86 2.77 2.77
0 -0.18 -0.38 -0.22 -0.61 -0.41 -0.24 -0.81 -0.66 -0.47 -0.41 -0.58 -0.99 -0.87 -0.79 -0.75 -0.71 -0.65 -0.64 -0.55 -0.48 -1.15 -1.06 -0.98 -0.96 -0.87 -0.97 -0.91 -0.89 -0.84
0 -0.24 -0.38 -0.35 -0.49 -0.45 -0.42 -0.57 -0.55 -0.51 -0.50 -0.52 -0.64 -0.62 -0.6 -0.6 -0.57 -0.58 -0.57 -0.55 -0.55 -0.70 -0.69 -0.67 -0.66 -0.66 -0.67 -0.64 -0.65 -0.64
0 0.54 0.95 0.83 1.26 1.17 1.02 1.51 1.44 1.35 1.32 1.43 1.72 1.66 1.65 1.59 1.63 1.56 1.58 1.55 1.49 1.90 1.85 1.84 1.83 1.77 1.80 1.82 1.78 1.78
0.71 0.71 0.62 0.71 0.53 0.61 0.71 0.46 0.51 0.58 0.61 0.54 0.40 0.44 0.47 0.48 0.49 0.52 0.51 0.55 0.57 0.36 0.39 0.41 0.41 0.44 0.41 0.43 0.44 0.45
0.30 1.20 1.86 1.73 2.37 2.25 2.11 2.80 2.69 2.58 2.54 2.66 3.15 3.07 3.03 2.98 2.98 2.93 2.93 2.88 2.82 3.46 3.39 3.35 3.34 3.28 3.32 3.3 3.27 3.26
01.00 07.58 17.13 17.12 27.97 28.77 29.33 39.80 40.61 42.27 42.72 41.15 52.41 53.30 53.65 54.08 54.00 55.33 55.36 56.58 57.88 65.68 66.65 66.94 66.69 68.75 67.56 67.12 67.78 68.49
0.3 1 1.45 1.38 1.78 1.72 1.64 2.04 1.99 1.93 1.91 1.97 2.26 2.22 2.20 2.18 2.18 2.15 2.15 2.13 2.10 2.45 2.41 2.39 2.39 2.36 2.38 2.37 2.36 2.35
0.60 1.51 2.08 2.03 2.51 2.46 2.41 2.85 2.81 2.76 2.75 2.79 3.13 3.10 3.08 3.06 3.06 3.04 3.04 3.02 3.00 3.37 3.34 3.33 3.32 3.30 3.32 3.30 3.30 3.29
0.30 1.06 1.51 1.5 1.83 1.82 1.81 2.09 2.08 2.05 2.06 2.06 2.31 2.29 2.28 2.28 2.26 2.27 2.26 2.26 2.25 2.49 2.48 2.46 2.46 2.46 2.47 2.44 2.45 2.44
02.00 04.35 06.89 06.35 09.38 08.95 08.24 11.81 11.43 10.98 10.89 11.42 14.18 13.84 13.82 13.44 13.76 13.37 13.44 13.34 12.89 16.51 16.20 16.18 16.16 15.78 15.84 16.09 15.83 15.83
Bp (oC) Exp.
Pred.a
Pred.b
-88.63 -42.07 -0.50 -11.73 36.07 27.85 9.50 68.74 60.27 57.99 49.74 63.28 98.43 90.05 91.85 80.50 93.48 79.20 89.78 86.06 80.88 125.66 117.65 118.93 117.71 106.84 109.10 118.53 109.43 115.61
-85.68 -44.91 -4.03 -12.43 32.94 26.77 16.39 66.03 61.05 55.06 53.84 60.92 95.46 91.41 91.17 86.57 90.45 85.71 86.57 85.35 79.79 121.65 118.32 118.11 117.89 113.74 114.40 117.13 114.29 114.29
-89.70 -40.35 2.15 -12.34 36.710 28.32 10.12 69.63 58.01 55.52 52.13 63.25 98.74 89.34 90.24 79.55 94.06 78.66 87.09 86.10 80.50 125.31 115.41 119.12 117.10 107.24 108.14 118.27 111.68 113.29
256
Bull. Korean Chem. Soc. 2004, Vol. 25, No. 2
Mojtaba Shamsipur et al.
Table 1. Continued No.
Alkanes
Sh1
Sh2
Sh3
Sh4
Sh5
Sh6
Sh7
Sh8
Sh9
Sh10
Sh
31 32 33 34 35 36 37 38 39 40 41 42 43 44 45 46 47 48 49 50 51 52 53 54 55 56 57 58 59 60 61 62 63 64 65 66 67 68 69 70 71 72 73
34MM6 33MM6 2M3E5 224MMM5 234MMM5 3E3M5 223MMM5 233MMM5 2233MMMM4 9 4E7 3E7 4M8 3M8 2M8 26MM7 25MM7 35MM7 4E2M6 24MM7 3E4M6 34MM7 3E2M6 23MM7 235MMM6 234MMM6 3E3M6 33MM7 22MM7 225MMM6 244MMM6 224MM6 2244MMMM5 3E23MM5 2334MMMM5 233MMM6 334MMM6 3E22MM5 223MMM6 2234MMMM5 2233MMMM5 3E24MM5 44MM7
2.76 2.73 2.75 2.6 2.63 2.71 2.6 2.59 2.39 3.27 3.12 3.13 3.15 3.17 3.17 3.06 3.06 3.05 3.03 3.05 3.02 3.04 3.02 3.06 2.93 2.93 2.99 3.03 3.05 2.92 2.92 2.91 2.75 2.88 2.95 2.9 2.9 2.88 2.91 2.73 2.74 2.83 3.02
-0.78 -0.75 -0.79 -0.77 -0.72 -0.66 -0.65 -0.62 -0.51 -1.30 -1.03 -1.06 -1.12 -1.16 -1.22 -1.15 -1.08 -1.01 -0.98 -1.04 -0.89 -0.96 -0.93 -1.03 -0.95 -0.86 -0.83 -0.95 -1.06 -0.99 -0.87 -0.92 -0.83 -0.72 -0.70 -0.80 -0.76 -0.78 -0.85 -0.73 -0.64 -0.85 -0.92
-0.62 -0.62 -0.62 -0.63 -0.61 -0.59 -0.6 -0.59 -0.58 -0.76 -0.68 -0.69 -0.72 -0.72 -0.74 -0.73 -0.71 -0.69 -0.68 -0.70 -0.65 -0.68 -0.67 -0.7 -0.68 -0.66 -0.65 -0.68 -0.72 -0.70 -0.65 -0.68 -0.67 -0.62 -0.60 -0.65 -0.64 -0.64 -0.66 -0.62 -0.62 -0.71 -0.68
1.77 1.75 1.77 1.71 1.72 1.74 1.69 1.69 1.61 2.06 1.98 1.98 2.00 2.01 2.02 1.97 1.96 1.95 1.94 1.95 1.92 1.94 1.93 1.95 1.90 1.89 1.90 1.93 1.95 1.90 1.88 1.88 1.82 1.85 1.87 1.87 1.86 1.86 1.88 1.80 1.79 1.81 1.92
0.46 0.48 0.46 0.48 0.49 0.50 0.51 0.52 0.56 0.32 0.39 0.38 0.37 0.36 0.34 0.36 0.38 0.40 0.41 0.39 0.43 0.41 0.42 0.39 0.42 0.44 0.45 0.41 0.38 0.41 0.45 0.43 0.46 0.48 0.49 0.46 0.47 0.47 0.44 0.50 0.51 0.40 0.42
3.23 3.22 3.22 3.19 3.17 3.16 3.14 3.12 3.04 3.73 3.56 3.58 3.62 3.64 3.67 3.61 3.57 3.53 3.51 3.56 3.47 3.51 3.49 3.56 3.49 3.44 3.45 3.52 3.58 3.51 3.43 3.46 3.40 3.37 3.36 3.42 3.39 3.39 3.44 3.33 3.31 3.35 3.50
68.96 69.65 68.96 69.49 70.19 70.80 71.58 72.26 75.06 79.52 80.32 80.72 80.46 80.85 80.5 81.57 81.81 82.00 81.59 81.38 82.71 82.54 82.14 82.36 83.22 84.32 84.22 83.53 82.77 83.66 83.13 83.79 85.62 86.88 86.68 85.81 86.36 85.38 85.28 86.40 89.92 74.96 83.17
2.33 2.33 2.33 2.32 2.31 2.3 2.29 2.28 2.25 2.61 2.53 2.54 2.56 2.57 2.58 2.56 2.54 2.52 2.51 2.53 2.48 2.51 2.49 2.53 2.49 2.47 2.47 2.51 2.54 2.51 2.47 2.48 2.45 2.43 2.42 2.46 2.45 2.45 2.47 2.42 2.41 2.46 2.50
3.28 3.27 3.28 3.27 3.26 3.25 3.25 3.24 3.21 3.58 3.51 3.52 3.54 3.55 3.56 3.54 3.52 3.51 3.50 3.51 3.48 3.50 3.49 3.53 3.49 3.47 3.47 3.5 3.52 3.50 3.47 3.48 3.46 3.44 3.43 3.46 3.45 3.45 3.47 3.41 3.42 3.46 3.49
2.43 2.44 2.43 2.44 2.42 2.42 2.42 2.42 2.41 2.65 2.60 2.60 2.62 2.63 2.64 2.63 2.62 2.60 2.59 2.61 2.57 2.59 2.58 2.61 2.59 2.57 2.58 2.60 2.63 2.61 2.59 2.60 2.60 2.56 2.56 2.58 2.57 2.57 2.59 2.54 2.56 2.56 2.60
15.81 15.73 15.77 15.34 15.43 15.66 15.35 15.33 14.76 18.80 18.35 18.40 18.46 18.50 18.51 18.19 18.18 18.15 18.08 18.15 18.05 18.13 18.05 18.17 17.80 17.79 17.97 18.08 18.14 17.75 17.77 17.74 17.24 17.63 17.85 17.7 17.69 17.65 17.73 17.19 17.22 17.49 18.05
Bp (oC) Exp.
Pred.a
Pred.b
117.73 111.97 115.65 099.24 113.47 116.00 109.84 114.76 106 150.77 141.20 143 142.40 143.30 142.80 135.20 136 136 133.8 133.5 140.4 140.1 138 140.5 131.3 139 140.6 137.3 132.7 124 126.5 126.5 122.7 141.6 141.5 137.7 140.5 133.8 131.7 133 140.27 136.73 135.20
114.07 113.18 113.63 108.84 109.85 112.41 108.95 108.72 102.23 144.75 140.42 140.90 141.49 141.87 141.97 138.85 138.75 138.46 137.77 138.46 137.47 138.26 137.47 138.66 134.99 134.89 136.68 137.77 138.36 134.48 134.68 134.38 129.30 133.28 135.49 133.98 133.88 133.48 134.28 128.78 129.09 133.85 137.48
114.78 112.13 114.51 98.955 107.73 117.98 109.04 113.17 106.11 151.24 141.18 141.57 141.29 144.40 142.93 138.58 135.25 136.10 135.32 135.81 138.84 139.21 139.04 138.88 132.89 136.35 138.29 138.73 135.37 129.08 129.10 129.29 118.70 141.23 141.43 135.67 138.53 135.26 135.75 131.12 137.97 137.10 134.95
M: methyl, E: ethyl. Example: 3E22MM5 = 3-ethyl-2,2-dimethylpentane.
indices, except Sh2, Sh3 and Sh5, have r2 > 0.95. As the BP of alkanes controlled by molecular weight other than the topology of molecule, we incorporated the number of carbon atoms (n) in some of the Sh indices and found that the following index is highly correlated with the BP of alkanes: Sh = n + n1/2Sh1
(14)
The relationship between the BP of C2-C9 alkanes (73
compounds) and proposed Sh index, along with several selected topological indices including Wiener (W),8 Hosoya (Z).9 Harary (H),12 Schultz (MT1),11 Balaban (I),10 Randic (χ)7 and Xu15 indices are as follows: BP = -125.8 + 130.6Log(W) r2 = 0.9635 s = 8.896 BP = -97.0 + 147.0Log(Z)
f = 1899
(15)
Highly Correlating Distance/Connectivity-Based Topological Indices Table 2. Regression results of alkanes boiling points using Sh indices Sh index
a
Sh1 Sh2 Sh3 Sh4 Sh5 Sh6 Sh7 Sh8 Sh9 Sh10
-105.28 157.28 -123.53 -114.67 26.83 -139.53 -77.17 -164.57 -183.64 -169.85
b
c
79.768 − -272.288 − -373.468 − 129.278 − 717.348 -1136.188 78.028 − 4.043 -.018 118.908 − 90.628 − 116.358 −
r2 = 0.9658 s = 8.605 BP = -133.3 + 245.7Log(H) s = 11.937 r2 = 0.9342 BP = -207.4 + 134.0Log(MTI) s = 9.163 r2 = 0.9613 BP = -297.0 + 215.1J − 26.965J2 s = 28.236 r2 = 0.6372 BP = -194.5 + 119.51c − 9.51c2 s = 4.891 r2 = 0.9891 BP = -80.79 + 56.6Xu s =5.791 r2 = 0.9857 BP = -122.53 + 18.92Sh − 0.25Sh2 s = 4.410 r2 = 0.9913
r2
se
F
0.966 0.819 0.889 0.970 0.804 0.966 0.966 0.960 0.962 0.950
88.717 20.13 15.73 88.21 21.05 88.66 88.76 89.5 89.16 10.61
1930.33 8306.78 8545.45 2184.8 8137.86 1957.14 8956.58 1615.65 1741.51 1278.87
f = 2034
(16)
f = 1022
(17)
f = 1786
(18)
f = 62
(19)
f = 3220
(20)
f = 2615
(21)
f = 3872
(22)
In general, the quality of QSPR models can be conveniently measured by the correlation coefficient r and standard error of regression s. For the proposed Sh index, r2 and s are 0.9913 and 4.41, respectively. The root mean square error (RMS), absolute average error between the experimental
Bull. Korean Chem. Soc. 2004, Vol. 25, No. 2
257
Table 3. Regression results of some selected alkane properties using Sh index Property TI Cp Tc Pc a0 b0
Sh Xu Sh Xu Sh Xu Sh Xu Sh Xu
a
b
c
r2
15.818 2.518 0.013 0.9914 − 40.998 41.768 0.9926 -3.778 24.658 -0.398 0.9914 − 57.828 65.528 0.9710 56.268 -3.378 0.098 0.953 − 46.618 -6.368 0.9024 2.368 1.378 0.048 0.9986 − 2.038 9.288 0.9866 0.041 0.0187.0 × 10−50.9983 − 0.054 0.048 0.9954
s 80.6491 87.18 86.093 13.29 81.56 82.18 80.434 81.56 80.0027 80.0048
F
N
862.9 18 2150 18 8922.9 22 8672 22 8183.99 18 8165.2 18 2927.3 12 8739 12 2116 12 2138 12
values of BP and predicted values and coefficient of variation (CV) are 4.35, 3.49 and 4.16%, respectively, whereas other indices have r2 < 0.99 and s > 4.5. Therefore, it is apparent that eq (22) (Sh index) represents a better model than eqs. (15-21) for modeling BP of alkanes. The plot of BP of alkanes versus the index Sh for C2-C9 alkanes is shown in Figure 2. In order to obtain extensive structure-property relationships, Sh index was further tested by modeling some other properties of alkanes including heat capacity Cp (J·mol−1·K−1) of gases at 25 oC, critical temperature Tc and pressure Pc and van der Waals constants, a0 (L·atm·mol−2) and b0 (L·mol−1). The regression results are shown in Table 3. From this table, it is seen that all properties are fairly correlated with Sh index with (r2 > 0.99), except with Pc that has a r2 > 0.95. Meanwhile Sh index produces better regression results compared with the newly reported Xu index for all properties listed in Table 3, except for Cp. Since alkanes are nonpolar compounds, their physicochemical properties are inherently determined by their structures (especially molecular size), and other factors due to polarity, polarizability and hydrogen bonding have no significant effect on alkane properties. The good correlation between Sh index and alkane properties indicates that it is a suitable topological index for QSPR studies of bond additive properties. In order to do the modeling of BPs of alkanes more accurately, we used all proposed Sh indices. Multiple linear regression (MLR) was used for selecting the best equation of fit. The result of MLR is shown in Table 4. Further improveTable 4. Result of MLR analysis of alkanes boiling points with Sh indices Variable
Figure 2. Plot of boiling points of C2-C9 alkanes versus Sh index.
Constant Sh1 Sh2 Sh3 Sh7 Sh8 Sh10 n
Coefficient Se of coefficient -133.95 31.16 75.28 175.44 2.98 422.09 -234.35 -45.27
15.60 10.02 13.44 26.79 0.32 62.00 37.85 5.97
T of H0
P
-8.59 3.11 5.60 6.55 9.30 6.81 -6.19 -7.58
0.000 0.003 0.000 0.000 0.000 0.000 0.000 0.000
258
Bull. Korean Chem. Soc. 2004, Vol. 25, No. 2
Mojtaba Shamsipur et al.
one of the fundamental properties that a topological index is expected to have. Ren15 has done a study on selected properties of octane isomers by Randic (χ) and Xu indices. The studied properties are entropy (S), quadratic mean radius (R2), density (D), heat of vaporization (Hv), heat of formation (Hf), Pitzer eccentric factor (ω) and octane numbers (MON). He has considered a simple linear model between octane properties and above mentioned indices, although, in some cases the quadratic relationship was found to be a better model. Thus, in this work, we repeated the modeling of octane properties by Randic and Xu indices using both the first and second ordered linear models. Moreover, the first and second ordered relationships between octane properties and Sh index were obtained. The results are shown in Table 5. From this Table it is obvious that, in some cases, the relationship between octane properties and topological indices (χ, Xu and Sh) is better modeled by a quadratic fitting. Second order relationships are necessary for modeling S, R2, D, ω, Vc and MON by Xu index and S, D and Hv by Randic index. Meanwhile, Sh index modeled all considered octane properties by second order relationships except for Hf and ω that show a first order relationship. Sh index results in a better correlation for S (r2 = 0.901), R2 (r2 = 0.880) and D (r2 = 0.750) than Xu index (with respective r2s of 0.871, 0.853 and 0.558) and Randic index (with respective r2s of 0.825, 0.699 and 0.627). Also, Sh index has a better correlation with Hv (r2 = 0.779) and Hf (r2 = 0.493) than Xu index (r2 = 0.558 and 0.271, respectively), and with ω (r2 = 0.956), Vc (r2 = 0.380) and MON (r2 = 0.940) than Randic index (r2 = 0.819, 0.171 and 0.630, respectively). The correlation coefficient of Sh index with S, R2, ω and MON is > 0.9, with D and Hv is > 0.8 and there is an unsatisfactory regression between Sh and Hf and Vc. After a series of comprehensive studies on a numerous properties of octane isomers by using of one and/or two
Figure 3. Plot of predicted boiling point of alkanes C2-C9 (using MLR) versus experimental boiling points.
ment of BP modeling of alkanes is obtained by using more than one Sh index. The standard error of this model is 2.27 o C. Absolute average error, root mean square error and relative standard deviation of prediction are 1.58, 2.16 and 2.05%, respectively. A plot of the predicted values of BP of alkanes by MLR versus the experimental values is shown in Figure 3. The high correlation coefficient of this plot (r = 0.999) confirm the excellent predictive ability of our proposed model. Modeling through isomer series (i.e. octane isomers) is another approach to QSPR studies. Isomer discrimination is
Table 5. First and second order correlation between octane properties and χ, Xu and Sh indices property
Order
S
first 2nd first 2nd first 2nd first 2nd first 2nd first 2nd first 2nd first 2nd
R2 D Hv Hf W Vc MON
X r
2
0.820 0.825 0.593 0.699 0.312 0.627 0.876 0.918 0.723 0.740 0.818 0.819 0.113 0.171 0.604 0.630
Xu 2
Sh 2
se
f
r
se
f
r
1.970 2.000 0.119 .106 0.025 0.019 0.735 0.618 0.679 0.680 0.016 0.017 0.015 0.015 16.140 16.190
72.94 35.41 23.30 17.38 7.26 12.60 113.30 83.88 41.80 21.30 72.05 33.95 2.04 1.54 21.34 11.07
0.800 0.871 0.804 0.853 0.419 0.749 0.557 0.558 0.270 0.271 0.948 0.965 0.472 0.546 0.925 0.940
2.080 1.720 0.082 .074 0.023 0.016 1.390 1.430 1.100 1.130 0.009 0.007 0.012 0.011 7.010 6.520
64.10 50.50 65.70 43.40 11.54 22.30 20.10 9.46 5.91 2.78 290.10 204.90 14.30 9.02 173.20 101.70
0.890 0.901 0.746 0.880 0.441 0.750 0.745 0.882 0.489 0.493 0.955 0.956 0.261 0.380 0.865 0.940
se 1.540 1.510 0.094 0.067 0.023 0.016 1.054 1.104 0.922 0.948 0.008 0.008 0.014 0.013 9.420 6.670
f 129.30 68.30 47.00 55.20 12.61 22.55 46.83 26.46 15.33 7.30 340.30 163.90 5.67 4.61 89.00 82.45
Highly Correlating Distance/Connectivity-Based Topological Indices
Bull. Korean Chem. Soc. 2004, Vol. 25, No. 2
259
Table 6. Result of MLR of octane properties and Sh indices Predictor indices
r2
S
F
Sh1, Sh , Sh32, Sh4, Sh52, Sh6, Sh7 Sh12, Sh2, Sh22, Sh32, Sh52, Sh6, Sh7 Sh1, Sh2, Sh22, Sh52, Sh6, Sh7, Sh92, Sh10 Sh1, Sh12, Sh2, Sh32, Sh4, Sh6, Sh7, Sh82 Sh1, Sh12, Sh2, Sh22, Sh32, Sh4, Sh7, Sh82, Sh92 Sh1, Sh12, Sh22, Sh32, Sh82, Sh92, Sh10 Sh2, Sh32, Sh52, Sh6, Sh82, Sh10 Sh2, Sh22, Sh52, Sh6, Sh7, Sh10
0.973 0.982 0.963 0.994 0.943 0.998 0.783 0.994
0.9800 0.0360 0.0074 0.2560 0.4660 0.0020 0.0090 2370
50.04 52.62 29.51 105.50 11.50 562.80 6.59 272.30
Property S R2 D Hv Hf w Vc MON
2
topological indices, Randic et al.23,24 suggested that there are no simple and accurate QSPR models for the octane isomers by the use of their topological indices. Later on, Ren15 proposed that the small difference between octane properties is responsible for the diminished regression of octane properties with a single topological index. In order to obtain more accurate regression, we used our proposed Sh indices to modeling the octane properties by MLR (using more than two indices). In our modeling, we consider all Sh indices defined (i.e. Sh1-Sh10) as well as their second power. The most significant descriptors for each property were then obtained by MLR. The resulting regression models between octane properties as dependent variable, and Sh indices, as independent variable, are shown in Table 6. R2, Hv, ω and MON are modeled with high correlation coefficients (r > 0.99). All other considered properties revealed correlation coefficient greater than 0.9, except Vc, which has a r2 value r = 0.885. This might be due to the uncertainty in measuring the critical volume. The high correlation coefficient of modeling of octane properties by Sh indices emphasizes that a combination of these indices can extract high structural information from a molecule. In the other words, since the octane isomers have the same number of carbon atoms, their properties is determined by compactness of molecules. This means that the Sh indices are actually representative of the molecular compactness other than the molecular size. Conclusions A combination of distance sum and connectivity has been used to generate some new topological indices. The incorporation of number of carbon atoms in the proposed indices generates a Sh index that has high correlation with some physicochemical properties of alkanes. Meanwhile, these properties can be better modeled using a combination of the Sh indices. A multiple linear model was used for such modeling. The Sh index has a better discriminatory power of alkane isomers than the Balaban's J index. Its calculation is very simple and its correlation with BP of alkanes is better than other indices such as Randic and Xu indices. In addition, The Sh index can be extended for heteroatom-containing compounds and/or multiple bonds. The discriminating ability of Sh index among heteroatom-containing molecules (such as alcohol, amines, ethers, thiols and so on) is much
better than the J index. Meanwhile, Sh index shows a good correlation with properties of these compounds. Thus, we proposed that it could be a useful parameter for QSAR/ QSPR studies. Investigations on the relationships between the properties of molecules other than alkanes and the Sh indices are continued in this group and we will report on this topic in the later papers in detail. References 1. Turro, N. J. Angew. Chem. Int. Edit. Engl. 1986, 25, 882-901. 2. Gilabert, L. E.; Sagrado, S.; Villanueva-Camanas, R. M.; MedinaHernandes, M. J. Anal. Chem. 1998, 70, 28-34. 3. Li, H.; Xu, L.; Guo, M.; Su, Q. Talanta 1997, 44, 203-211. 4. Viswanadhan, V. N.; Mueller, G. A.; Basak, S. C.; Weinstein, J. N. J. Chem. Inf. Comp. Sci. 2001, 41, 505-511. 5. Agatonovic-Kustrin, S.; Tacker, L. G.; Zecevic, M.; Zivanovic, L. J. Anal. Chim. Acta 2000, 418, 181-195. 6. Shamsipur, M.; Hemmateenejad, B.; Akhond, M.; Sharghi, H. Talanta 2001, 54, 1113-1120. 7. Mihalic, Z.; Trinajistic, N. J. Chem. Educ. 1992, 69, 701-712. 8. Balaban, A. T. J. Chem. Inf. Comput. Sci. 1985, 25, 334-343. 9. Balaban, A. T. J. Chem. Inf. Comput. Sci. 1995, 35, 339-350. 10. Randic, M. J. Am. Chem. Soc. 1975, 97, 6609-6615. 11. Wiener, H. J. Am. Chem. Soc. 1947, 69, 17-20. 12. Hosoya, H. Bull. Chem. Soc. Jpn. 1971, 44, 2332-2339. 13. Balaban, A. T. Chem. Phys. Lett. 1982, 89, 399-404. 14. Schultz, H. P. J. Chem. Inf. Comput. Sci. 1989, 29, 227-228. 15. Plavsic, D.; Nikolic, S.; Trinajistic, N. J. Math. Chem. 1993, 12, 235-250. 16. Kier, L. B.; Hall, L. H. Molecular Connectivity in Chemistry and Drug Research; Academic Press: New York, 1976. 17. Yao, Y. Y.; Xu, L.; Yuan, X. S. Acta Chim. Sinica (in Chinese) 1996, 54, 533-538. 18. Ren, B. J. Chem. Inf. Comput. Sci. 1999, 39, 139-143. 19. Zhao, Y. H.; Yang, L. H.; Wang, L. S. Bull. Environ. Contam. Toxicol. 1996, 57, 242-249. 20. Smeeks, F. C.; Jurs, P. C. Anal. Chim. Acta 1990, 233, 111-119. 21. Malinowsky, E. R. Factor Analysis in Chemistry; John Wiley: New York, 1991. 22. Rechsteiner, C. E. Handbook of Chemical Property Estimation Methods; Lyman, W. L.; Reehl, W. E.; Rosenblatt, D. H., Eds; McGraw Hill: New York, 1982. 23. Kartitzky, A. R.; Mu, L.; Lobanov, V. S.; Karelson, M. A. J. Phys. Chem. 1996, 100, 10400-10407. 24. Fisher, C. H. Chem. Eng. 1989, 96, 157-158. 25. Satyanarayana, K.; Kakati, M. C. Fire Mater. 1991, 15, 97-100. 26. Randic, M.; Guo, X. F.; Oxley, T.; Krishnapriyan, H. J. Chem. Inf. Comput. Sci. 1993, 33, 709-716. 27. Randic, M.; Guo, X. F.; Oxley, T. J. Chem. Inf. Comput. Sci. 1994, 34, 361-367.