Dec 10, 2010 - 2 Astrophysics Group, Keele University, Newcastle-under-Lyme, ST5 5BG, UK. Preprint online version: December 13, 2010. ABSTRACT.
c ESO 2010
Astronomy & Astrophysics manuscript no. genfitt December 13, 2010
Constrained fitting of disentangled binary star spectra: application to V615 Per in the open cluster h Persei (Research Note) E. Tamajo1 , K. Pavlovski1,2 , and J. Southworth2 1
arXiv:1012.2244v1 [astro-ph.SR] 10 Dec 2010
2
Department of Physics, University of Zagreb, Bijeniˇcka 32, 10 000 Zagreb, Croatia Astrophysics Group, Keele University, Newcastle-under-Lyme, ST5 5BG, UK
Preprint online version: December 13, 2010 ABSTRACT
Context. Using the technique of spectral disentangling, it is possible to determine the individual spectra of the components of a multiple star system from composite spectra observed at a range of orbital phases. This method has several advantages: it is unaffected by line blending, does not use template spectra, and returns individual component spectra with very high signal-to-noise ratios. Aims. The disentangled spectra of a binary star system are very well suited to spectroscopic analysis but for one problem: the absolute spectral line depths are unknown because this information is not contained in the original spectra (unless there is one taken in eclipse) without making assumptions about the spectral characteristics of the component stars. Here we present a method for obtaining the atmospheric parameters of the component stars by the constrained fitting of synthetic spectra to observed and disentangled spectra. Methods. Disentangled spectra are fitted using synthetic spectra and a genetic algorithm in order to determine the effective temperatures, surface gravities and relative light contributions of the two stars in a binary system. The method is demonstrated on synthetic spectra and then applied to the eclipsing binary V615 Per, a member of the young open cluster NGC 869 (h Persei). Results. The method works well for disentangled spectra with signal-to-noise ratios of 100 or more. For V615 Per we find a normal He abundance but an Mg abundance, which indicates bulk metallicity, a factor of two lower than typical for nearby OB stars. Key words. stars: binaries – stars: abundances – stars: atmospheres – open clusters and associations
1. Introduction The technique of spectral disentangling (spd) allows the isolation of the individual spectra of the component stars of a doublelined spectroscopic binary system from a set of composite spectra observed over a range of orbital phases. It was originally formulated in the wavelength domain by Simon & Sturm (1994) and in the Fourier domain by Hadrava (1995). The technique simultaneously returns the best-fitting individual spectra and the orbital velocity amplitudes of the two stars. A detailed overview of spd can be found in Pavlovski & Hensberge (2009). Compared to other methods of radial velocity measurement, spd has several advantages. Firstly, it is independent of template spectra so avoids any systematic errors due to spectral differences between the target and template stars. Secondly, it is not affected by the blending of spectral lines of the two stars (see Hensberge et al. 2000; Southworth & Clausen 2007). Thirdly, the resulting disentangled spectra contain the combined signal of the input spectra (Pavlovski & Southworth 2009) so have a much higher signal-to-noise (S/N) ratio. There are two disadvantages of the spd approach. The first of these is that the continuum normalisation of the input spectra has to be very good in order to avoid low-frequency spurious patterns in the resulting disentangled spectra (Hensberge et al. 2008). The second is that relative continuum light contributions of the two stars cannot be found using spd as this information is itself not contained in the observed spectra, unless a spectrum has been obtained during an eclipse (Iliji´c et al. 2004). spd is well suited to the spectral analysis of stars in binary systems. Each disentangled spectrum contains only features due
to one star, so can be analysed using standard methods for single stars. The high S/N ratios of disentangled spectra are very helpful to this process, but the undetermined continuum light ratio between the component stars complicates the spectral analysis. In this work we present a method to fit synthetic spectra to disentangled spectra, where the atmospheric parameters of the stars are determined simultaneously with the relative light contributions of the stars. A genetic algorithm is used for the optimization in order to ensure that the best solution is found in a parameter space which suffers from strong degeneracies, in particular between effective temperature (T eff ) and surface gravity (log g). An important application of spd is the study of detached eclipsing binary star systems (dEBs). These represent the primary source of directly-measured masses and radii of stars, and as such are cornerstones of stellar physics (Andersen 1991; Torres et al. 2010). spd can be used to measure the velocity amplitudes of the stars, which are necessary for the mass and radius measurements, simultaneously with obtaining the individual stellar spectra for spectral analysis (Pavlovski & Hensberge 2005; Pavlovski et al. 2009; Pavlovski & Southworth 2009). A major advantage of dEBs to this process is that the surface gravities of the stars can be obtained to within ±0.01 dex from the mass and radius measurements: these parameters can then be fixed in the spectral analysis and thus the degeneracy between T eff and log g avoided (Simon et al. 1994; Hensberge et al. 2000). In this work we demonstrate the genetic algorithm approach to fitting disentangled spectra on the dEB V615 Persei, a member of the young open cluster h Persei. Southworth et al. (2004a, 1
E. Tamajo, K. Pavlovski & J. Southworth: Genetic fitting of disentangled spectra (RN) 1
0.9
0.8
0.7
0.6
0.5 4335
4340
4345
4350
wavelength
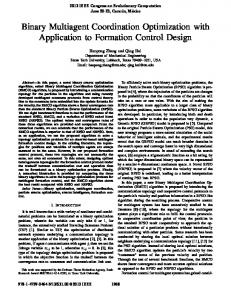
Fig. 1. Synthesized Hγ line profiles (red lines) and the bestfitting synthetic spectra (blue lines) for the case with S/N = 100 in Table 1. The primary star is below the secondary star on the plot. hereafter SMS04) obtained a series of high-resolution spectra of V615 Per and analysed them with published light curves (Krzesi´nski et al. 1999) to measure the masses (4.08 and 3.18 M⊙ ) to accuracies of 2% and the radii (2.29 and 1.90 R⊙ ) to 5%, resulting in surface gravities measured to within 0.05 dex. The T eff values were found to be 15 000 ± 500 K and 11 000 ± 500 K. SMS04 found that stellar evolutionary models required a subsolar metal abundance (Z ≈ 0.01) to reproduce the measured masses and radii of V615 Per. The Perseus Double Cluster comprises h Persei (NGC 869) and χ Persei (NGC 884). It has been extensively studied via deep CCD photometry (Keller et al. 2001; Marco & Bernabeu 2001; Slesnick et al. 2002; Capilla & Fabregat 2002; Currie et al. 2010), from which there is general agreement on its distance (2.3 to 2.4 kpc) and age (13–14 Myr). But these studies assumed a solar chemical composition, and their results may be systematically wrong if this assumption is incorrect. Conflicting results on the chemical composition of the Perseus Double Cluster are present in the literature. Detailed abundance analyses based on high-resolution spectra of hot stars (Lennon et al. 1988; Dufton et al. 1990) have challenged previous findings of low helium abundances (Nissen 1976; Klochkova & Panchuk 1987; Wolff & Heasley 1985). Dufton et al. (1990) and Smartt & Rolleston (1997) found an approximately solar metal abundance from high-resolution spectra, but this was not supported by Vrancken et al. (2000). In this work we attempt to shed additional light on this subject by measuring the helium and metal abundances of the stars in the dEB V615 Per.
2. Constrained fitting of disentangled spectra using a genetic algorithm A computer code has been constructed which fits synthetic spectra to disentangled spectra of a binary system in order to determine the atmospheric parameters T eff , log g, projected rotational velocities v sin i, Doppler shifts, and the light factors. The light factors are an important part of the analysis, and are parameterised as LF, the fraction of the total system light produced by one star for the wavelength or wavelength interval under consideration. The LFs for the binary components should sum to unity. The determination of the atmospheric parame2
ters represents a difficult optimization problem, for which we use a genetic algorithm to minimise the χ2 of the fit to the data (Holland 1975; Charbonneau 1995). Our implementation is called genfitt (genetic fitting) and in approach is similar to that of Mokiem et al. (2005). Error estimates come from the covariance matrix, which is constructed using the LevenbergMarquardt method. In order to save computing time we pre-calculate grids of synthetic spectra. genfitt linearly interpolates between these in T eff and log g, and then convolves them with a rotational profile using the rotin.f code of I. Hubeny1. The LTE grid covers T eff from 6000 to 15 000 K and the non-LTE grid covers T eff from 14 000 to 35 000 K. Both grids contain log g values of 2.5 to 5.0 (cgs), and are stepped by 250 K in T eff and 0.1 dex in log g. There can be strong degeneracies between the fitted atmospheric parameters, most notably T eff and log g for Balmer line profiles. This degeneracy between T eff and log g can be avoided by analysing dEBs, because their surface gravities can be known to within 0.01 dex from measurements of their masses and radii. In many cases the light ratio of the stars in a dEB can be obtained from the light curve analysis (e.g. Southworth et al. 2004b), so the LFs can then be fixed to known values2 . In order to test the performance of genfitt we synthesized disentangled spectra covering the Hβ, Hγ and Hδ lines, using representative atmospheric parameters and with Gaussian noise added to produce S/N ratios ranging from 25 to infinity. We then used genfitt to fit all the atmospheric parameters to the synthesized spectra, with the only constraint that the two light factors sum to unity. The results are given in Table 1 and show that for high S/N ratios (>100) the genfitt results reproduce the input T eff and log g values satisfactorily. For lower S/N ratios the inherent degeneracy of these parameters causes them both to be underestimated by our method. By contrast, the LFs are reproduced to well within the errorbars for all S/N ratios considered. An example fit is shown in Fig. 1 We obtained a second set of solutions in an ‘unconstrained mode’ where the LFs were not required to sum to unity. The results were, as expected, similar to but slightly poorer than the ‘constrained mode’. Finally, a third set of solutions were made with fixed log g values (Table 2), as would often be the case when analysing a dEB. We find that the situation is similar to that for the first set of solutions. The main limitation on the quality of these results is the degeneracy between T eff and log g: we find a correlation coefficient of 0.98 between these parameters for both components. The correlation with the LFs is much weaker, which is why the LF values are reliable even for low-S/N spectra.
3. Application to V615 Persei genfitt has already been used for studying the dEBs V380 Cyg (Pavlovski et al. 2009) and V621 Per (Southworth et al. 2011, in prep.). In both of these cases spectra of a high S/N ratio were available and genfitt returned excellent results. Here we challenge it with spectra of a much lower S/N ratio. 25 spectra of the dEB V615 Per were obtained by SMS04, with a reciprocal dispersion of 0.11 Å pixel−1 , a resolution of 0.2 Å and an average S/N of ≈50. They cover 4220–4500Å so include Hγ, a number of helium lines, and the Mg II 4481Å doublet and are well distributed through one orbital cycle. spd was 1
http://nova.astro.umd.edu/index.html The light ratio can be poorly determined in some dEBs, and in this case obtaining a spectroscopic light ratio is an important part of modelling the light curves. For an example see Southworth et al. (2007). 2
E. Tamajo, K. Pavlovski & J. Southworth: Genetic fitting of disentangled spectra (RN)
Table 1. Results of fitting synthesized disentangled spectra with genfitt for different S/N values. The output parameters and uncertainties are given, along with the difference compared to the input parameters and the reduced χ2 (χ2ν ). S/N ∞ 500 200 100 50
T eff 1 (K) 17 991 ±56 17 896 ±153 17 835 ±198 17 753 ±365 17 041 ±441
∆ T eff 1 −9 −104 −165 −247 −959
log g1 3.495 ±0.016 3.492 ±0.025 3.497 ±0.027 3.485 ±0.033 3.421 ±0.035
∆ log g1 −0.005 −0.008 −0.003 −0.015 −0.079
LF1 0.775 ±0.012 0.771 ±0.024 0.771 ±0.015 0.769 ±0.023 0.761 ±0.081
∆ LF1 −0.005 −0.009 −0.009 −0.011 −0.019
T eff 2 (K) 11 005 ±56 10 896 ±157 10837 ±211 10 748 ±358 10 030 ±430
∆ T eff 2 −5 −103 −164 −252 −970
log g2 3.995 ±0.016 3.992 ±0.023 3.987 ±0.024 3.986 ±0.036 3.929 ±0.036
∆ log g2 −0.005 −0.008 −0.013 −0.015 −0.071
LF2 0.225 ±0.012 0.229 ±0.021 0.229 ±0.019 0.231 ±0.021 0.239 ±0.086
∆ LF2 +0.005
χ2ν –
+0.009
1.054
+0.009
1.032
+0.011
0.841
+0.019
0.774
Notes. The input atmospheric parameters are: T eff 1 = 18 000 K, log g1 = 3.5, v sin i1 = 105 km s−1 , LF1 = 0.78, T eff 2 = 11 000 K, log g2 = 4.0, v sin i2 = 95 km s−1 , LF2 = 0.22
Table 2. Same as Table 1 but for fits with log g values for the two stars fixed. S/N ∞ 500 200 100 50
T eff 1 (K) 17 921 ±109 17 897 ±160 17 825 ±236 17 750 ±352 17 056 ±416
∆ T eff 1 −79 −103 −175 −250 −944
LF1 0.776 ±0.010 0.771 ±0.022 0.769 ± 0.018 0.767 ±0.027 0.756 ±0.082
∆ LF1 +0.001 −0.004 −0.011 −0.013 −0.024
performed in Fourier space using the fdbinary3 code (Iliji´c et al. 2004). The disentangled spectra have S/N values of about 160 for the primary star (star A) and 80 for the secondary (star B). Since the spectra of V615 Per cover only a limited wavelength range, our estimate of the T eff s of the component stars is restricted to the Hγ line. Helium lines are also good T eff indicators, but instead we will use these later to obtain the helium abundance of the binary. Because the available light curves of V615 Per are not definitive, the log g values for the two stars are known to modest accuracies of 0.059 and 0.050 dex. We therefore included them as genfitt fitted parameters (solution A), along with T eff . We also obtained a solution B for comparison, where the log g values were fixed to those found by SMS04. The LFs were constrained to sum to unity. For v sin i we adopted 28 ± 5 and 8 ± 5 km s−1 plus an instrumental broadening of 16 km s−1 (SMS04). The results are given in Table 3. For the chemical abundance analysis we adopted the atmospheric parameters from solution A. Synthetic spectra were calculated using atlas9 model atmospheres (Kurucz 1979) and nonLTE theoretical line profiles from the detail and surface codes (Giddings 1981; Butler 1984). A canonical microturbulence velocity of 2 km s−1 was adopted (Trundle et al. 2007) as we have too few spectral lines to fit for it.. The helium abundance of star A was derived via χ2 minimisation between the observed profiles of He I 4388 Å and 4471 Å, and profiles calculated for abundances in the range ǫ(He) = 0.06–0.15. The results for both lines are given in Table 4 and correspond to a mean helium abundance of ǫ(He) = 0.091 ± 007. This abundance is solar to within 3
http://sail.fer.zep/fdbinary/
T eff 2 (K) 10 921 ±115 10 909 ±166 10 808 ±236 10 738 ±343 10 030 ±422
∆ T eff 2 −79 −91 −192 −262 −970
LF2 0.224 ±0.014 0.229 ±0.021 0.231 ±0.018 0.233 ±0.025 0.244 ±0.085
∆ LF2 −0.001
χ2ν –
+0.009
1.065
+0.011
1.042
+0.013
0.848
+0.024
0.777
Table 4. Chemical abundances derived for the components of V615 Per. Component Star A Star A Star A Star A Star B
Species He I He I He I Mg II Mg II
Wavelength (Å) 4388 4471 mean 4481 4481
Abundance 0.090 ± 0.005 0.092 ± 0.005 0.091 ± 0.007 7.26 ± 0.03 7.16 ± 0.06
the uncertainty [ǫ⊙ (He) = 0.089], so no deviations in helium abundance are detected for V615 Per A. The helium lines from star B are too weak to be useful (Fig. 2). Magnesium is an excellent metallicity indicator for B-type stars as it does not participate in the CNO process so is unmodified by stellar evolution (Lyubimkov et al. 2005). These authors found a mean abundance of log ǫ(Mg) = 7.59 ± 0.15 for nearby B stars with reliable microturbulence velocities, in excellent agreement with the solar value of log ǫ⊙ (Mg) = 7.55 ± 0.02. Mg II 4481 Å is a prominent feature in the spectra of both components of V15 Per. Theoretical line profiles were calculated in non-LTE for star A and in LTE for star B and the abundances obtained by χ2 minimisation (Fig. 2). We find a mean abundance of log ǫ(Mg) = 7.21 ± 0.07. This is 0.46 dex lower than the mean value found by Lyubimkov et al. (2005) and 0.16 dex lower than that found by Daflon et al. (2003) for OB stars in the solar circle. The components of V615 Per have a subsolar Mg abundance and resemble halo B stars more than nearby examples (Daflon et al. 3
E. Tamajo, K. Pavlovski & J. Southworth: Genetic fitting of disentangled spectra (RN)
Table 3. Results from genfitt analysis of the Hγ line for V615 Per, with a comparison to the values found by SMS04. Parameter T eff (K) log g [cgs] LF
This work (solution A) Star A Star B 14 710 ± 210 11 520 ± 290 4.302 ± 0.035 4.361 ± 0.030 0.676 ± 0.006 0.324 ± 0.006
This work (solution B) Star A Star B 14 920 ± 190 11 420 ± 250 4.328 fixed 4.381 fixed 0.677 ± 0.004 0.323 ± 0.004
1 0.9 0.8 0.7 0.6 4460
4465
4470
4465
4470
4475
4480
4485
4475
4480
4485
1
0.8
0.6
0.4 4460
wavelength
Fig. 2. Comparison between disentangled and renormalised spectra of star A (upper panel) and star B (bottom panel) with synthetic spectra calculated for the He and Mg abundances given in Table 4 (blue lines). Only the Mg II lines and the He i line for star A are fitted here. Other lines are shown but not used in our results. 2004). This implies that the h Persei open cluster has a subsolar metal abundance.
4. Summary Spectral disentangling is a method for obtaining the individual spectra of the components of a binary star system from composite spectra obtained at a range of orbital phases. A disadvantage of this method is that the continuum light ratios of the stars are not found, because this information is not present in the observed spectra without making assumptions about the spectral characteristics of the stars. We present the genfitt program, which uses a genetic algorithm to fit synthetic spectra to the disentangled spectra of both components of a binary system simultaneously. It returns the best-fitting atmospheric parameters (T eff and log g) and the light contributions of the two stars. From tests with synthesized spectra we find that genfitt performs extremely well in determining the light ratio. It also returns reliable T eff and log g values in those cases where S /N of the input disentangled spectra is >100, which is the usual situation for observational studies. The light contributions of the two stars will normally sum to unity, which provides a useful constraint for genfitt. Contaminating light from a third star can in principle be found, in cases when the light contributions of the two stars in the binary sum to less than unity. Once the light contributions of the stars have been found, their disentangled spectra can be renormalised to the correct continuum levels. The resulting spectra can then be analysed using standard methods for single stars. If the two stars are eclipsing, their surface gravity values may 4
SMS04 Star A Star B 15 000 ± 500 11 000 ± 500 4.328 ± 0.059 4.381 ± 0.050 0.65 ± 0.03 0.35 ± 0.03
be found to high precision and accuracy from analysis of the orbital velocity amplitudes found by spectral disentangling and light curves covering the eclipses. As a demonstration of the method we applied genfitt to spectra of the eclipsing system V615 Per, a member of the h Persei open cluster. The metal abundance of this cluster is controversial (see Sect. 1) but important in measuring its distance by the isochrone method. The spectra were disentangled and fed into genfitt, and an abundance analysis was performed on the resulting renormalised spectra. The atmospheric parameters returned by genfitt are in good agreement with previous work (SMS04) but are more precise. We find a normal solar helium abundance for V615 Per A (star B is cooler and has only weak helium lines). The magnesium abundances for both stars are lower than those found for nearby OB stars, indicating that h Persei has a subsolar metallicity. This is in agreement with the results of SMS04, based on the complimentary method of comparing the masses and radii of the stars to the predictions of theoretical stellar evolutionary models. Acknowledgements. KP acknowledges receipt of the Leverhulme Trust Visiting Professorship which enabled him to perform this work at Keele University, UK. JS acknowledges funding from STFC in the form of an Advanced Fellowship.
References Andersen, J. 1991, A&ARv, 3, 91 Butler, K. 1984, PhD thesis, University College London Capilla, G. & Fabregat, J. 2002, A&A, 394, 479 Charbonneau, P. 1995, ApJS, 101, 309 Currie, T., Hernandez, J., Irwin, J., et al. 2010, ApJS, 186, 191 Daflon, S., Cunha, K., & Butler, K. 2004, ApJ, 606, 514 Daflon, S., Cunha, K., Smith, V. V., & Butler, K. 2003, A&A, 399, 525 Dufton, P. L., Brown, P. J. F., Fitzsimmons, A., & Lennon, D. J. 1990, A&A, 232, 431 Giddings, J. 1981, PhD thesis, University College London Hadrava, P. 1995, A&AS, 114, 393 Hensberge, H., Iliji´c, S., & Torres, K. B. V. 2008, A&A, 482, 1031 Hensberge, H., Pavlovski, K., & Verschueren, W. 2000, A&A, 358, 553 Holland, J. H. 1975, Adaptation in natural and artificial systems. an introductory analysis with applications to biology, control and artificial intelligence, ed. Holland, J. H. Iliji´c, S., Hensberge, H., Pavlovski, K., & Freyhammer, L. M. 2004, in Astronomical Society of the Pacific Conference Series, Vol. 318, Spectroscopically and Spatially Resolving the Components of the Close Binary Stars, ed. R. W. Hilditch, H. Hensberge, & K. Pavlovski, 111–113 Keller, S. C., Grebel, E. K., Miller, G. J., & Yoss, K. M. 2001, AJ, 122, 248 Klochkova, V. G. & Panchuk, V. E. 1987, Soviet Astronomy Letters, 13, 23 Krzesi´nski, J., Pigulski, A., & Kołaczkowski, Z. 1999, A&A, 345, 505 Kurucz, R. L. 1979, ApJS, 40, 1 Lennon, D. J., Brown, P. J. F., & Dufton, P. L. 1988, A&A, 195, 208 Lyubimkov, L. S., Rostopchin, S. I., Rachkovskaya, T. M., Poklad, D. B., & Lambert, D. L. 2005, MNRAS, 358, 193 Marco, A. & Bernabeu, G. 2001, A&A, 372, 477 Mokiem, M. R., de Koter, A., Puls, J., et al. 2005, A&A, 441, 711 Nissen, P. E. 1976, A&A, 50, 343 Pavlovski, K. & Hensberge, H. 2005, A&A, 439, 309 Pavlovski, K. & Hensberge, H. 2009, ASP Conf. in press, arXiv:0909.3246 Pavlovski, K. & Southworth, J. 2009, MNRAS, 394, 1519 Pavlovski, K., Tamajo, E., Koubsk´y, P., et al. 2009, MNRAS, 400, 791 Simon, K. P. & Sturm, E. 1994, A&A, 281, 286 Simon, K. P., Sturm, E., & Fiedler, A. 1994, A&A, 292, 507 Slesnick, C. L., Hillenbrand, L. A., & Massey, P. 2002, ApJ, 576, 880
E. Tamajo, K. Pavlovski & J. Southworth: Genetic fitting of disentangled spectra (RN) Smartt, S. J. & Rolleston, W. R. J. 1997, ApJ, 481, L47 Southworth, J., Bruntt, H., & Buzasi, D. L. 2007, A&A, 467, 1215 Southworth, J. & Clausen, J. V. 2007, A&A, 461, 1077 Southworth, J., Maxted, P. F. L., & Smalley, B. 2004a, MNRAS, 349, 547 Southworth, J., Maxted, P. F. L., & Smalley, B. 2004b, MNRAS, 351, 1277 Torres, G., Andersen, J., & Gim´enez, A. 2010, A&ARv, 18, 67 Trundle, C., Dufton, P. L., Hunter, I., et al. 2007, A&A, 471, 625 Vrancken, M., Lennon, D. J., Dufton, P. L., & Lambert, D. L. 2000, A&A, 358, 639 Wolff, S. C. & Heasley, J. N. 1985, ApJ, 292, 589
5