American Mineralogist, Volume 93, pages 1732–1748, 2008
Amorphous materials: Properties, structure, and durability†
Constrained interactions, rigidity, adaptative networks, and their role for the description of silicates Matthieu Micoulaut* Laboratoire de Physique Théorique de la Matière Condensée, Boite 121, Université Pierre et Marie Curie, 4, place Jussieu, 75252 Paris Cedex 05, France
Abstract Silicate glasses can be seen as connectivity networks where specific tools are used for the understanding of the behavior with composition of their chemical and physical properties. These tools make use of the effective interatomic interactions and mechanical constraints such as those used for analyzing the stability of macroscopic trusses. We first describe how complex interactions and coordination numbers can be efficiently handled within a general framework. The ingredients of the general framework, also known as mean-field bond constraint theory, are then presented. The theory predicts flexible to stressed-rigid elastic phase transitions at threshold compositions (or mean-coordination numbers). Applications to alkali- and alkaline-earth-silicates are considered and experimental signatures of the phase transition identified. Finally, we focus on the latest development in the field, namely the appearance of a new self-organized intermediate phase between flexible and stressed-rigid phases. Experimental signatures of these phases are reviewed, and the tools of adaptative silicate networks used to understand their features. Keywords: Network glasses, silicates, rigidity, constraints
Introduction Silicate glasses not only have a huge technological and commercial importance due to their applications in semiconductor devices, and window and optical glasses, but also represent the dominant part of the Earth’s crust made of a mixture of different alkali and alkaline-earth-rich alumino-silicate systems. In contrast with alkaline-earth silicates, there is a wide glass-forming range in the binary alkali-silicate systems. Modifying ions (from Li to Cs, or from Mg to Ba) usually enter the glass network as singly or doubly charged cations and occupy interstitial sites (Richet and Mysen 2005; Henderson 2005). Charge compensation is achieved through the creation of so-called “non-bridging” O atoms (NBO) that lead to an increased disruption (depolymerization) of the base silica network made of an alternation of Si and bridging O atoms (BO) (Greaves and Sen 2007). The creation of NBOs therefore reduces the connectivity of the glass network and has some obvious implications for its physical and chemical properties. In fact, the thermal expansion coefficient, fluidity (inverse of viscosity), diffusion, and ionic conduction all increase with an increase of modifier content. The change in network structure with the type and concentration of modi* E-mail:
[email protected] † The Amorphous Materials special section papers were among those presented at the Frontiers of Mineral Sciences meeting, Cambridge, 2007. These articles are published individually and will be available as a group at http://www.minsocam.org/msa/ ammin/toc. 0003-004X/08/1112–1732$05.00/DOI: 10.2138/am.2008.2903
fier ions has proven to be helpful in understanding the physical properties of glasses and melts. At a basic level, the molecular structure of a silicate glass can be visualized as a generic bars-and-nodes truss network where nodes represent atoms and bars the covalent bonds. The mechanical stability of such networks can then be analyzed at different levels, either from a global approach that relies only on the chemical composition, or on a more detailed level using statistical mechanics techniques. Early attempts at microscopic modeling of network trusses have emphasized the central role played by the connectivity of the network (Phillips 1979, 1981), with a certain number of physical and chemical properties of a large family of glasses depending simply on the network mean coordination number r (Asokan et al. 1989; Feltz et al. 1983; Kamitakahara et al. 1991; Boehmer and Angell 1992; Senapati and Varshneya 1995). Furthermore, it has been shown that a system made up of weakly cross-linked chains will become rigid when r reaches a threshold value (Thorpe 1983; He and Thorpe 1985; Schwartz et al. 1985; Cai and Thorpe 1989). At low connectivity, networks have a flexible structure that is weakly constrained by interatomic interactions, whereas high cross-linked networks (i.e., with large connectivity) are found to be stressed rigid, i.e., one finds more constraints due to covalent interactions than degrees of freedom per atom on average. In mechanical engineering, these two extremely different networks (low and large connectivity), having either an under- or overconstrained nature, are respectively termed hypo- and hyperstatic. The threshold composition, i.e., the point
1732
Micoulaut: Rigidity in silicates
where the number of constraints matches exactly the number of degrees of freedom, is isostatic or optimally constrained (Phillips 1979; Thorpe 1983). In binary silicates, the large connectivity (overconstrained) limit obviously corresponds to the silica-rich side, whereas the underconstrained (low connectivity) network is typical of a moderate or highly depolymerized glass. On this basis, Phillips (1979) predicted that glass-forming tendency is maximized at this boundary because of the optimal interplay between degrees of freedom and constraints. In other words, there are no excess constraints. Also, exhaustion of all the degrees of freedom means that the network fills space efficiently (Feltz et al. 1983). Simulations of bond-depleted amorphous Si networks with changing connectivity have furthermore shown that isostatic (i.e., optimally constrained) networks are located close to a mechanical critical point where the number of zero frequency (floppy) modes f of the dynamical matrix vanishes (Thorpe 1983; Thorpe and Duxburry 1999). This critical point defines a flexible to rigid elastic phase transition as network mean coordination number r increases to 2.4, with f being the order parameter of the transition and r the control parameter. As r can be easily defined in covalent network glasses of the form AxB1–x with well-known coordination numbers rA and rB and r = rA x + rB (1 – x), experimental studies of rigidity transitions have first focused on chalcogenides such as GexSe1–x or AsxS1–x. Raman scattering (Feng et al. 1997), stress relaxation and viscosity measurements (Tatsumisago et al. 1990), vibrational density of states (Kamitakahara et al. 1991), Brillouin scattering (Sreeram et al. 1991), Lamb-Mössbauer factors (Boolchand et al. 1995), and resistivity (Asokan et al. 1989) have underscored the central role played by network connectivity, and a systematic change in regime has been observed at the network mean coordination number of r = 2.4. In ternary systems involving three kinds of atoms, the demonstration has been even more persuasive as the threshold has been found not to depend on the particular compositional join (Tatsumisago et al. 1990; Sreeram et al. 1991). How can these ideas be extended to oxide systems with partial ionic interactions, and ultimately, to silicate glasses and melts? Preliminary work in this direction has been accomplished by Zhang and Boolchand (1994) and Boolchand and Thorpe (1994), who considered the effect of onefold-coordinated atoms in chalcohalide networks, and broken mechanical constraints arising from the size of a cation in an Na tellurate system. What can we infer about glass and liquid properties of oxides that would interest geologists? The aim of this article is to address the issue by providing concepts and tools from rigidity theory for understanding of silicate glasses at a more basic level. This article is organized as follows: we first discuss the basic principles and notions about distance constraints and rigidity in silicate glasses, together with the basic assumptions that are needed for this approach. A certain number of straightforward examples are shown for (almost) purely covalent network glasses. We then apply these notions to the case of alkali and alkaline-earth silicates, and discuss experimental results on binary silicate glasses and melts. The case of adaptative molecular networks leading to a self-organized intermediate phase (Boolchand et al. 2001b) is then considered in this perspective. This allows the
1733
understanding of new generic features of disordered solids that have been observed recently in network and in silicate glasses (Vaills et al. 2005).
Bond strength, connectivity, and distance constraints
For silicate glasses, one has first to define the relevant coordination numbers because the present approach requires only the underlying connectivity of the glass network. Then, one has to define bonding constraints imposed by the interactions between atoms, and finally check if all these interactions should be taken into account, or if some of them derive from sufficiently soft interactions to be considered as negligible. Oxygen neighbors and alkali coordination number Since the goal is to build a theoretical framework that will mostly rely on the connectivity of the network, a crucial question deals with the definition of the coordination number of the involved atoms. In covalent network glasses, the degree of cross-linking in terms of a mean coordination number r can be unambiguously defined from the coordination number of the atoms that follow the 8-N rule. Here N stands for the number of outer shell electrons. As demonstrated in a neutron diffraction study of GexSe1–x (Salmon 2007), this quantity r can be exactly determined from the number-number Bhatia and Thornton (1970) pair distribution function gNN(r) via: Rm
∫R
2
(1) where Rm is the distance at first minimum of gNN(R), n0 the number density, and gNN(R) is related to the ordinary pair distribution functions gαβ(R) by: r = 4 πn0
0
gNN ( R)dR
gNN ( R) = ∑ cα cβ gαβ ( R)
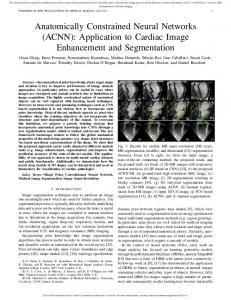
(2) with cα and cβ the concentrations of species α and β. Indeed, whereas the area under the first distance peak in a standard Faber-Ziman gαβ(r) pair distribution function usually gives the number of β-atom neighbors in the vicinity of a central α atom, gNN(R) focuses on the neighbors irrespective of their chemical origin, α or β. Therefore, it provides a measure of the network topology (Salmon et al. 2005). In GexSe1–x, the behavior with x of the area under the first distance peak in gNN(r) follows exactly the quantity r = 2 + 2x that is what one would obtain from a straightforward calculation based on the 8-N rule (Fig. 1). Can these simple considerations now be applied to silicate glasses? We show in the same figure (broken line) the BhatiaThornton pair distribution function of a simulated CaSiO3 system at 300 K (see details of the simulation below). The mean coordination number determined from the area under the principal peak leads to r = 3.93, a value that is very different from what one would obtain for this system having at our disposal the respective coordination number of 2, 4, and 2 for Ca, Si, and O: α ,β
r=
2+4+2×3 = 2.4 5
(3)
The analysis of the different Faber-Ziman partials of the
Micoulaut: Rigidity in silicates
1734
Mean coordination number r
4 2.8
2.6
3
BT
gNN (r/r1)
2.4 2.2
2
2 0
1
0.1 0.2 0.3 Ge concentration x
0.4
0 1
2
3
r/r1
4
5
Figure 1. Bhatia-Thornton number-number pair distribution function. gNN(r/r1) of a GeSe4 glass (solid line) (Salmon 2007) together with a simulated pair distribution function for a wollastonite CaSiO3 glass (broken line, see text for details). The scaling distance r1 corresponds to the distance of the first maximum of the pair distribution. The insert shows the network mean coordination number r extracted from the area of the first peak (filled circles) in the system GexSe1–x together with the estimate from an 8-N rule (r = 2 + 2x).
CaSiO3 system furthermore shows that the number of O neighbors in the vicinity of a Ca atom is not 2 but about 6. This holds not only for Ca silicates. Structural studies of various binary silicates based either on extended X-ray absorption fine structure (EXAFS) (Misawa et al. 1980), X-ray diffraction (XRD) (Wilding et al. 2004), or neutron diffraction (Eckersley et al. 1988; Gaskell et al. 1991), together with molecular simulations (Poole et al. 1995), have shown that the number of O neighbors in the vicinity of a metal cation was usually larger than the coordination number expected on a simple chemical basis. In alkali silicates, the modifier-O pair distribution function obtained from MD simulations furthermore shows a well-defined first distance shell between the O atoms and the alkali cation (see e.g., Du and Corrales 2006). Experimentally, EXAFS studies on different mixtures of alkaline earth silicates suggest that Mg, Ca, and Ba have a respective “coordination number” of 4, 6, and 6 (Taniguchi et al. 1997). Similarly, the O coordination number for K or Na has been found to be between 6 and 8 from EXAFS studies (Greaves 1985). In neutron-scattering studies on Li disilicate glasses, the Li coordination number was found to range from 2.16 to 4.0 (Hannon et al. 1992; Zhao et al. 1998; Uhlig et al. 1996). On the other hand, as the mean coordination number of Si is r = 2.67, the addition of higher-coordinated alkalis should increase the global connectivity of the network. And since the change in the glass-transition temperature, Tg, is directly correlated with the change in connectivity (Kerner and Micoulaut 1997; Naumis 2006), one should expect that the increase of alkali content would lead to an increase of Tg. This conclusion
runs against the experimentally observed Tg variation in alkali and alkaline earth silicates. In fact, in all silicates, the glasstransition temperature drops from 1450 K for vitreous silica to 800 K after several percent alkali oxide are added (Suzuki and Abe 1981), in quantitative agreement with statistical models that use an alkali coordination number of 1 (Micoulaut 1998). Obviously, connectivity-based approaches to network glasses can extract the cation-O coordination number from an 8-N rule, and do not need to take into account “extra” O neighbors visualized in spectroscopic studies. A piece of evidence for the latter assertion comes from molecular simulation studies (both classical and first principles). These show that the metal-O distances found in silicates are not all equivalent. In fact, molecular orbital calculations on Na or Ca silicates have shown that the Na-NBO distances were shorter than the Na-BO distances (Uchino and Yoko 1998; Ispas et al. 2002; Cormier et al. 2003). Experimentally, Debye-Waller factors measured in EXAFS studies on Ba or Ca binary silicates are slightly different, suggesting that the O neighbors of Ca are, again, not all equivalent (Taniguchi et al. 1997). With this in mind, one has also to remember that according to Pauling, bond strength (in our case the mechanical constraint) is a systematic function of the bond distance: the longer the metalO bond, the weaker is its strength. Moreover, one should also use the definition of Pauling to determine the fractional ionic character fi in the metal-O bond (Pauling 1962): fi = 1 − exp[ −
( XM − XNBO )2 ] 4
(4)
where XM and XNBO are the electronegativities of the metal (M) or O (NBO) atoms. Indeed, the present theory deals only with the bonds that provide a strong mechanical constraint, which means that the covalent bonds are the most qualified. For Ca-O bonds, one obtains from the electronegativities of Ca (XCa = 1.00) and O (XO = 3.44) a value fi = 0.774 and a corresponding covalency factor of 1 – fi = 0.226. With a coordination number of 6 for Ca, the corresponding covalent coordination is 6(1 – fi) = 1.36, somewhat lower than 2. In Na silicate glasses, one obtains from a “Pauling” analysis of Equation 4 a corresponding covalent coordination between 0.832 and 1.04, even though the number of nearest O neighbors of the Na atom is believed to be 5. Hierarchical constraints from simulated CaSiO3 To illustrate further our approach, and the way relevant constraints should be selected among all possible bondings (i.e., neighbors), we construct by molecular dynamics simulation a structural model consisting of 307 Ca, 307 Si, and 922 O atoms confined in a cubic box of edge length 27.8 Å that corresponds to a glass with experimental density of 2.8 g/cm3. The number of atoms chosen and the potential employed, yields the wollastonite CaSiO3 compound. The atoms interact via a two-body HugginsMayer effective potential in a (N,V,E) ensemble, which contains a Coulombic term and a short-range repulsive term: Vij (r ) = Aij e
( dij − r )/ ρ
+
Zi Z j e2 r
(5)
Parameters (Aij, dij, Zi, Zj, ρ) for this potential have been fitted (Abramo et al. 1992) to obtain a structure factor and a
Micoulaut: Rigidity in silicates 4
4 3
3
1
gCa-O(R)
2
σ1
1
2
0
3 2
2.2
2.4
1
0 0
2
4
6
2
R [Å]
4
2.6 2.8 R [Å]
8
3
5,6
3.2
10
12
Figure 2. Ca-O pair distribution function gCaO(R) for a simulated wollastonite (CaSiO3) glass at 300 K. The contributions of the different neighbors (n = 1–6) contributing in the principal peak to the first distance shell can be analyzed (insert) with the definition of the full-width at half maximum σn (in red, σ1). Note: color is online only.
0.1
Radial width σn
radial distribution function for Ca-Ca correlations that are in fair agreement with experimental results from neutron scattering (Eckersley et al. 1988; Gaskell et al. 1991) on the CaSiO3 glass. Bond distances and coordination numbers satisfy experimental measurements on glasses or wollastonite (Mastelaro et al. 2000). The system has been first maintained during 1 ns (with a time step of 1 fs) at 3000 K and then cooled down at a quench rate of 1012 K/s with positions and velocities saved at various temperatures that have served as starting configurations for production runs up to 5 ns. The computed potential energy shows a marked change in slope around the temperature of T = 1100 K, which signals the glass transition. This value is slightly larger than the experimentally measured (Malki et al. 2003) one of 1065 K, but still in reasonable agreement as compared with usual large deviations between simulated and experimental values of Tg (Guillot and Guissani 1996; Vollmayr et al. 1996). The effective potential appears to be reliable in terms of thermodynamics as the variation of the enthalpy (H = E + PV) with respect to the temperature follows the experimental data of Richet and Bottinga (1984). Note that the deviation at high temperature, already noticed for a similar computation (Micoulaut et al. 2006) in liquid GeO2, should arise from the variation of the density at high temperature. For the present purpose, we focus on the structural properties of the amorphous CaSiO3 system at 300 K. As mentioned above, the computation of the network mean coordination number from the Bhatia-Thornton number-number pair distribution function gNN(r) leads to an overestimation of r. This difference mostly arises from the fact that the number of O neighbors in the vicinity of a Ca atom is found to be about 6.16, in agreement with the estimate from EXAFS measurements (Taniguchi et al. 1997). Here, the coordination number of Ca is calculated at a cut-off distance of 3.05 Å, which corresponds to the first minimum of gCaO(r) (see Fig. 2). To estimate the number of bond-stretching constraints for e.g., the Ca-O pair, one needs to focus on the bond distance variability rather than on the bond distance itself. We compute at a given distance the probability of finding n O neighbors around a Ca atom, [n being labeled from 1 to 6, and 6 corresponding to the distance r = 3.05 Å where the first minimum of the gCaO(r) pair distribution function is found]. Results are displayed in Figure 2. From each of these distributions, a characteristic radial width σn (the full-width at half maximum of the peak labeled n, see definition of σ1 in the insert of Fig. 2) shows that the first two O neighbors have a constant value for σn (Fig. 3). The latter increases starting from the third neighbor and up to n = 6. It suggests that O neighbors from n = 3 to 6 have a larger radial variability as compared to first two neighbors. The forces needed to maintain only small harmonic displacements from the equilibrium structure can be considered as negligible when compared to the first two O neighbors. Their corresponding mechanical constraints can therefore be considered as broken. It means also that even though there are six O neighbors around a Ca atom, one should only consider two bond-stretching constraints. Radial variability and not cation coordination number appears therefore to control the number of relevant bond-stretching constraints. Moreover, from Figure 2, one sees also that the “effec-
1735
0.08
0.06
0.04
0
1
2
3 4 5 Neighbour number n
6
7
8
Figure 3. Full-width at half maximum of the first-neighbor distributions contributing to the first peak in the simulated gCaO(R) of a wollastonite CaSiO3 glass.
tive” coordination number, which is needed for the enumeration of mechanical stretching constraints, is the one defined at the pair distribution maximum (i.e., at the bond distance). The additional neighbors contribute to the high-R tail of the first peak only and have a larger radial variability. In the following, we use therefore for constraint counting an alkali atom a coordination number of 1, and for alkaline-earth atoms a coordination number of 2. Finally, since the bond-bending interactions can be taken into account only if a central atom is connected to other atoms (i.e., if stretching interactions do exist), bond-bending constraints are enumerated accordingly to the hierarchy enunciated for the bond-stretching interactions. In conclusion, based on the analysis performed in the previous two sections, one sees that the computation of mechanical constraints, which is based a chemical rule (8-N) rule in covalent
Micoulaut: Rigidity in silicates
Broken constraints If the number of constraints can be only determined from an “8-N” rule coordination, one may wonder how the observed changing behavior in different alkali silicates can be handled from a connectivity viewpoint. Obviously, size effects should be taken into account in the bond-constraint approach. We first focus on the case of vitreous silica, and more specifically on its Si-O-Si bond angle distribution. The latter has been extensively studied by various experimental techniques (Mozzi and Warren 1969; Nemilov 1982; Galeener 1985; Pettifer et al. 1988; Poulsen et al. 1995) and molecular simulations (for details, see Yuan and Cormack 2003) with a mean bond angle found between 142 and 147° and a full-width at half maximum of 17–38°. Note that in the case of molecular dynamics (MD) simulations, the value of the mean bond angle and the full-width at half maximum are very sensitive to the MD effective potential employed. Because of its broad angular distribution, O can display wide excursions around its equilibrium position, with a restoring force that is weak (Smith et al. 1995). On this basis, it has been proposed that bond-bending constraints of O should be broken in vitreous silica (Zhang and Boolchand 1994), which leads to an optimally constrained network for which the number of mechanical constraints matches exactly the number of degrees of freedom. It also explains indirectly the ease of glass formation of silica (see below). With the addition of alkali cations, the Si-O-Si bond angle distribution becomes narrower, in parallel with a lengthening of the Si-O bond distance (Gibbs et al. 1972; Boisen et al. 1990). This result has been accurately demonstrated from an EXAFS study of Na silicates (Henderson 1995), and from an NMR study on silica and K silicates (Farnan et al. 1992), also reported long time ago (Brown et al. 1969). For the former experiment, the increase of Na leads to an increase of the Si-O distance but to a decrease of the Si-Si distance (i.e., implying a reduction of the Si-O-Si bond angle distribution). Concerning the latter, the fullwidth at half maximum reduces from 26 to 21° between silica and the K2Si4O9 glass, whereas the mean bond angle remains the same. In MD studies, addition of Na to silica also narrows the bond angle distribution for certain classes of potentials (Yuan and Cormack 2003). The narrowing of the bond angle distribution indicates that the broken O bond-bending constraints of silica are restored. It is supported by the potential energy curve determined by an ab inito molecular orbital approach (Newton and Gibbs 1980), which shows that lower angles (i.e., lower than 120°) lead to an increased interaction energy. The smaller size of the alkali cations implies higher field
strengths F = Z/rM where Z is the cation valence and rM the ionic radius. The higher field strength requires also the coordination of NBO to screen their charges. In fact, in alkali silicates, the field strength goes from 1.11 Å for lithium to 0.86 and 0.6 Å for Na and Rb, respectively. In alkaline earth, the same quantity ranges from 2.32 Å for Mg to 1.34 Å for Ba (Richet and Mysen 2005). The softening of the field strength means that a certain number of mechanical constraints should be considered as broken when the size of the cation (from Li to Cs, and from Mg to Ba) is increased. The bond-angle distribution around atoms with the weakest field strength is hardly accessible from experiments. However, as for the cation bond-stretching constraints discussed above, molecular simulations are able to provide some insights into the motion (and hence to the interaction) that is allowed around an equilibrium position. Figure 4 shows the BO-M-NBO simulated bond angle distribution of simulated alkali silicates (Du and Corrales 2006). One sees from the figure that besides the sharp peak at low bond angle, the bond-angle distribution becomes broader with increasing alkali size. This broadening can be quantified from the full-width at half maximum (FWHM) that is an increasing function of the ionic radius (or decreasing bond strength) (insert of Fig. 4). For K silicates, the distribution is even weakly bimodal with two contributions on average at 95 and 125°. In terms of bond-constraint counting, the present simulation suggests that some additional constraints are broken when the size of the metal cation is increased. Figure 5 represents a schematic view of an Rb silicate for which BO bond-bending constraints are broken. The consideration of broken constraints will of course affect the elastic nature of the network, as discussed next.
0.25 80 fwhm [deg]
chalcogenides, still holds when handling the more complex (non-directional or partially covalent) interactions of alkali-Si (or alkaline earth) oxides. From the simple view of Pauling, a covalent coordination number can be extracted from the electronegativities of the atoms. From molecular dynamics simulations that are using empirical force fields, the complete atomic interactions are used in an effective way. The result is that bond distances are fixed (i.e., constraints are intact) for the number of atomic neighbors corresponding to the 8-N rule, whereas radial variability appears for the other neighbors. These have broken constraints and therefore do not contribute to the enumeration.
BO-M-NBO Bond angle distribution
1736
0.2
60 50 40
0.15
K
70 Na Li
0.8
1 1.2 1.4 Ionic radius [nm]
K
0.1
Na
0.05
0
1.6
Li 40
60
80
100
120
Angle [deg]
140
160
180
Figure 4. BO-M-NBO (M = Li, Na, and K) bond-angle distribution of simulated disilicates (Du and Corrales 2006). The main band of the distributions can be characterized by a full-angular-width at half maximum (FWHM) that is represented in the insert as a function of the ionic radius.
Micoulaut: Rigidity in silicates
1737
f of floppy modes is given by f = 3 – nc
(7)
and can be simply rewritten as a function of the network mean coordination number N = ∑ nr : r ≥2
5 f = 2 − r 6
Figure 5. A schematic view of the local structure of a Li silicate (left) and a Rb silicate (right). The size of the circles are scaled accordingly to the ionic radius of the atoms. The lower field strength (for Rb) should lead to the softening of the bending interaction of the closest BO atom.
Maxwell bond constraint theory General ingredients In random networks when only nearest-neighbor forces dominate between atoms, small displacements from the equilibrium structure can be described by a harmonic Kirkwood-Keating potential (Kirkwood 1939; Keating 1966) that contains bondstretching and bond-bending terms without any further consideration of more weaker forces such as dihedral or Van der Waals forces. Thorpe (1983) and co-workers (He and Thorpe 1985) have demonstrated that networks constrained only by these local forces can be analyzed from the eigenmodes of the dynamical matrix (of dimensionality 3N) that represent the zero-frequency modes. When these (floppy) modes are present, eigenmodes can diagonalize the matrix. The network is then flexible and can be deformed with a low cost in energy. The total number of zero-frequency modes can be also computed from Maxwell constraint counting, which requires only the coordination number of the atoms. For an r-coordinated atom, the enumeration of bond-stretching and bond-bending forces (presumed here intact for all atoms) gives, respectively, r/2 and (2r3) constraints. The latter is obtained by considering a twofold atom that has only a single angular constraint. Each additional bond onto this atom needs the definition of two additional angular constraints. An Si atom has, therefore, seven constraints (see Table 1): two bond-stretching and five bond-bending constraints. A bonding O atom (BO) or an alkaline earth atom have two constraints, whereas the onefold alkali cation has only half of a stretching constraint because the corresponding stretching interaction is shared with a non-bridging O atom (NBO). By definition, onefold atoms cannot have bond-bending constraints (Boolchand and Thorpe 1994). For a network made of atoms with concentration nr and coordination r, the total number of constraints per atom is nc =
and r=
∑ nr [ r / 2 + (2r − 3)] ∑ nr
r ≥2
(6)
r ≥2
1 ∑ rnr N r ≥2
represents the total number of atoms of the network. The fraction
(8)
One can easily see that f vanishes when r reaches a mean coordination number r = rc = 2.4. The vanishing of the number of floppy modes at r = rc = 2.4 defines a single transition between a flexible and a stressed rigid phase. This transition happens when constraint counting is performed at a global (Maxwell) level with the number of constraints computed directly from the concentration of the involved atoms. This first approach, although insightful, neglects any consideration of the presence of correlated fluctuations between either flexible or stressed subregions of the network that could delay the onset of rigidity when the connectivity is steadily increased. Similarly, the initial eigenmode analysis (Thorpe 1983) is realized on networks with bonds being removed at random. The vanishing of Equation 8 therefore defines a mean-field result where neither typical length-scales nor any spatial correlations of the emerging elastic phases (stress-free, stressed) are involved. Application to alkali and alkaline earth silicates Having set the coordination numbers of Si, O, and the alkali cation respectively to four, two, and one, one is able to estimate at which concentration the number of floppy modes defined from Equation 7 vanishes. Note that for all these systems, the number of atoms per mole is 3 and that the onefold alkali cannot have bond-bending constraints. The simplest case is the Li silicate system for which all constraints are considered intact due to the small size of the Li cation. Its ionic radius is on the same order as the O atom of the network and there is no size mismatch. Table 1 gives the different ways to compute the number of constraints of the various silicate systems. For the Li case, the number of floppy modes is equal to 1 fLi = 3 − (11 − 8 x ) 3
(9)
which vanishes at the critical concentration x = xc = 0.25. In a global Maxwell approach, Li silicate glasses can therefore be considered at low concentrations as stressed rigid (nc > 3), whereas they are flexible (nc < 3) at higher concentrations. The boundary between the two phases locates the rigidity transition at a Li2O concentration of 25%. As mentioned above, with increasing metal-O bond distance (from 1.97 Å for Li to 2.36 Å for Na), the cation field strength should be weaker. This leads to additional local degrees of freedom or broken constraints from the weaker interactions (necessarily a NBO bond-bending). For the Na case, broken NBO bond-bending constraints shift the rigidity transition to x = xc = 0.20, which is intuitive. Indeed, because a certain number of constraints are missing, flexibility can now onset at
Micoulaut: Rigidity in silicates
1738
Table 1. Bond-stretching (BS) and bond-bending (BB) constraint counting in alkali silicate (1 – x)SiO2 – xM2O , and alkaline earth silicate glasses (1 – x)SiO2 – xMO, total number of constraints Nc, and the location of the optimally constrained network composition xc Si SiBS SiBB Li 2(1 – x) 5(1 – x) Na 2(1 – x) 5(1 – x) K 2(1 – x) 5(1 – x) Rb 2(1 – x) 5(1 – x) Cs 2(1 – x) 5(1 – x) Mg,Ca 2(1 – x) 5(1 – x) Sr 2(1 – x) 5(1 – x) Ba 2(1 – x) 5(1 – x)
BO NBO BOBS BOBB NBOBS NBOBB 2 – 3x 2 – 3x 2x 2x 2 – 3x 2 – 3x 2x – 2 – 3x 2 – 5x 2x – 2 – 3x 2 – 7x 2x – 2 – 3x 2 – 9x 2x – 2 – 3x 2 – 3x 2x 2x 2 – 3x 2 – 3x 2x 2x 2 – 3x 2 – 3x 2x –
M Nc MBS MBB x – 11 – 8x x – 11 – 10x x – 11 – 12x x – 11 – 14x x – 11 – 16x x x 11 – 7x x – 11 – 8x x – 11 – 10x
xc 0.250 0.200 0.167 0.143 0.125 0.500 0.400 0.285
lower concentrations. Therefore, one expects that the increase of the cation size from Li to Cs will bring the rigidity transition to small modifier content. Consideration of the K case shows that there are still some bond-bending constraints that can be broken. In fact, if one BO bond-bending constraint is broken between two Si tetrahedra, the rigidity percolation threshold will shift to a K concentration of xc = 0.167. An additional broken constraint (two BOs) brings the threshold to the concentration xc = 0.143. We identify the latter case with a Rb system since a rigidity transition has been observed close to this composition for the similar Rb germanate system (Boolchand, unpublished material). The application of constraint counting algorithms is also possible on the alkaline earth silicate systems, as shown in Table 1. Note that in these systems, the number of atoms per mole is now 3 – x, and that the twofold alkaline earth cations can have some intact bond-bending constraints when the ionic radius is small. The simplest case that can be considered is again the one for which all constraints are intact, which corresponds to Mg or Ca silicates that have the highest field strength. In contrast, one assumes that due to the size of the cation, bond bending of the Ba cation and the two adjacent NBO are broken. In fact, the simulated O-Ba-O bond-angle distribution shows a full-width at half maximum of about 90° (Schlenz et al. 2002), close to the value obtained for K (insert of Fig. 4). It suggests that Ba displays wide angular excursions and should therefore have its bond-bending constraints broken. This leads, e.g., to several floppy modes from Maxwell counting: fMg,Ca = 3 − fBa = 3 −
11 − 7 x 4 x − 2 = 3− x 3− x
11 − 10 x 7 x − 2 = 3− x 3− x
(10)
for Mg or Ca, respectively, and Ba. The number of floppy modes then vanishes at the critical concentrations xc = 0.50 and xc = 0.285 (see Table 1).
Discussion There are several salient features for the onset of rigidity that have been observed in network glasses over the years and that can be transposed to the present silicates where similar observations have been reviewed. Compositional trends can indeed be quite useful in understanding physical and chemical properties of silicates (see also Richet et al. 2006) from the viewpoint of rigidity.
Glass-forming tendency A network that is rigid but stress-free, and that satisfies nc = 3, lies at a mechanical critical point that influences the glassforming ability. In fact, the number of internal degrees of freedom (the number of floppy modes) has vanished, and decreases the corresponding relaxation in the potential energy landscape that would bring an additional increase to the heat of vitrification. On the other hand, the absence of excess constraints (excess of stress) prevents any phase separation. The glass formation at the rigidity transition composition should therefore be optimal with an approximate location at the center of the glass-forming domain. On the low modified silicate side (nc > 3), the increase of stress will ultimately favor phase separation. To check how optimally constrained networks form glasses easily, one can follow either the crystallization rate or the vitrification enthalpy as composition changes. Another conventional way to study the ease of vitrification uses the so-called temperature-time-transformation studies (Uhlmann 1972). In a (T,t) representation, these usually represent the temperature evolution with time that maintains a fixed crystal volume fraction (typically 10–6) with cooling. In high-temperature liquids, the driving force for homogeneous crystal nucleation is weak but increases rapidly once the system becomes supercooled. At low temperatures, the crystal nucleation rate decreases because the diffusion slows down, which implies nucleation. Between these two ends, the crystallization rate exhibits a maximum that needs to be avoided, and from which a critical cooling rate can be determined that avoids the crystallization. Figure 6b shows the critical cooling rate for Na and K silicates for only a few compositions (Fang et al. 1983). Here one sees that a minimum in the critical cooling rate is obtained at a composition that is located in the interval where optimal glass formation is expected from Maxwell counting (respectively x = 20 and 16.7%). It parallels findings on the GexSe1–x system (Fig. 6a) where slow cooling allows only glass formation at network connectivities that are somewhat lower than the critical coordination number r = rc = 2.4 of the rigidity transition. An increase of the cooling rate (from air quench to water quench) increases the glass-forming region up to r = 2.67 where stress-induced phase separation occurs. The enthalpy of vitrification measured from calorimetry (Tatsumisago et al. 1990) should also display characteristic changes when the system changes from a flexible to a stressed rigid phase. A study of vitrification in MgO-SiO2 melts between the enstatite (50%) and forsterite (66% MgO) compositions has recently shown that the heat of vitrification increases (Tangeman et al. 2001), an increase that is accompanied by a large change in connectivity (Wilding et al. 2004b). The optimal glass composition in Mg silicates is x = xc = 0.50. This composition can be produced by conventional methods, whereas extensions of the glass-forming region toward glasses with high melting temperatures (e.g., forsterite) needs high-temperature containerless synthesis (Kohara et al. 2004). An indirect indication of glass-forming tendency comes also from the behavior of the viscosity with composition at a fixed temperature or at some characteristic temperature that determines the final glassy state. According to different authors (Cohen and Turnbull 1961; Richet 1984), the glass-forming tendency is increased for systems that are able to increase their melt viscosity
Glass forming difficulty (arb. units)
Micoulaut: Rigidity in silicates
a
2.5
water quenching
2
air quenching
1.5 1
slow cooling
0.5 0
2
log CCR (K/S)
1
b
2.2 2.4 2.8 2.6 Mean coordination number r
0 -1 -2 7
0
log η [Pa s]
20
30
40
c
6 5 4 3 2
10
0
K
1739
the liquidus branches, as suggested and discussed by Richet and Mysen (2005) and Richet et al. (2006). Figure 6c shows the evolution of the viscosity along the liquidus branches for Li, Na, and K silicates. One sees that the composition of the minimum of the critical cooling rate (Fig. 6b) at around 20% Na or K correlates well with the viscosity maximum (25, 25, and 20% for Li, Na, and K, respectively) observed in Figure 6c, as already noticed by Richet et al. (2006). One should, however, keep in mind that the chosen compositional intervals in the nucleation experiments (Fang et al. 1983) do not allow for a definite conclusion on the relationship between the minimum in the critical cooling rate, and the viscosity maximum along the liquidus branches. Obviously, there is a link between the composition of the first eutectic of the phase diagrams, the viscosity, and the location of the rigidity transition (i.e., the optimal glass composition). This is not only true for the present silicates but also for alkali tellurates (Narayanan 2001). The connection between the maximum in viscosity and the location of the stress-free rigid composition where nc = 3, is more clear. In fact, one sees that this maximum shifts to lower compositions with the cation size, as does the rigidity transition composition xc (Table 1). Moreover, one notices that the location of the deepest eutectic in alkali and alkaline earth silicates is related to the composition at which the network is optimally constrained (Fig. 7a). For lower modifier concentrations, extra constraints leading to stress increase the liquidus temperature (Fig 7b). When the temperature of the system is decreased from the liquidus, phase separation can occur because of the increase of bonding (i.e., constraints) that parallels the increase of viscosity. This finding indicates that stressed rigidity (nc > 3), rigidity without stress (nc = 3) and flexibility (nc > 3) are major factors in the understanding the viscosity behavior in alkali systems and thus the ease of vitrification. Structural signatures
Na Li 10 20 30 M2O concentration
40
Figure 6. (a) Glass formation tendency in GexSe1–x as a function of the mean coordination number r (Azoulay et al. 1975). Optimal glass formation is obtained close to the network mean coordination number 2.4. (b) Critical cooling rates for Na and K silicates as a function of modifier content. Data are from Fang et al. (1983). (c) Viscosity of alkali silicate melts along the liquidus branches as a function of modifier content. Data from Poole (1948) and Bockris et al. (1955). Note: color is online only.
down to lower temperatures. For this reason, glass forms more easily at eutectics because freezing-point depressions bring the system to lower temperatures and higher viscosities. In this respect, a proper way to compare the various alkali systems (that display different glass-transition temperatures and different phase diagrams) is to follow the viscosity of the different silicates along
Since the discovery of the rigidity transitions, many authors have tried to detect a structural signature in glassy networks that could underscore the change in elastic behavior at the rigidity percolation threshold. Changes with composition in the total or partial structure factors have been investigated for various network glasses (Salmon 2007; Bychkov et al. 2005). The results have been disappointing. Raman scattering has appeared to be a helpful and interesting probe of local and intermediate-range structural changes of glassy networks with changing compositions. In some cases, these experiments have helped to establish the elastic phases in glasses. Optical elastic power laws can indeed be defined from experiments when a typical vibrational mode forms part of a network with some extended character. Specifically, one follows the quantity ν2-ν2c that depends on the frequency shift ν of certain modes, with mean coordination number difference r-rc. Here rc and νc represent, respectively, the network mean coordination number and the frequency shift at the flexible to rigid threshold, and obviously ν2-ν2c represents a measure of the network stiffness. Changes in behavior of this quantity at the flexible to rigid transition have therefore been observed (Feng et al. 1997). This result furthermore allows a power-law variation to be obtained that is typical of the elasticity of stressed rigid amorphous networks (He and Thorpe 1985, see below), and the corresponding
Micoulaut: Rigidity in silicates
Ca
50 40 30
Energetical features and elastic constants
Ba K
20 10
Mg
Sr
Li
Na
1
0.5
1.5
2000
TeO2-M2O
Z/r
2
2
3
2.5
T [K]
1800 1600 1400 1200 1000
flexible
stressed
0
Chaimbault et al. unpublished material) and Ba silicate glasses (Bourgel et al. in review), which exhibit respective changes at x = 0.15 and x = 0.31 modifier concentrations.
0.2 0.4 Excess constraints nc-3
K Na Li Ba Sr Ca Mg
0.6
Figure 7. (a) Location of the rigidity transitions (black) and the deepest eutectic composition in silicate glasses (orange) as a function of the ionization potential of the metal cation. In red, the deepest eutectic composition of tellurate systems for comparison (Narayanan 2001). (b) Liquidus branches in the low modified silicate region, rescaled as a function of excess constraints nc – 3. The solid line is a guide. Data are extracted from Ryerson (1985). Note: color is online only.
fractional exponent of the power-law to be determined. In contrast with chalcogenide network glasses, silicate glasses display a much larger variety of possible Raman modes some of which still have controversial structural assignments. Most of the modes, however, can be clearly attributed (Frantz and Mysen 1995; Zotov 2001). In the context of flexible to rigid transitions, a Raman study of the xCaO – (1 – x)SiO2 system has shown (Micoulaut et al. 2005) that certain modes (e.g., the stressed Q4 rigid SiO4/2 corresponding to the A1 stretching mode) exhibit a change in regime of line frequency and linewidth Γ at a concentration somewhat lower (45%) than the predicted x = 50% (Table 1), consistently with chalcogenide analogs (Selvenathan et al. 2000). The evolution of the linewidth Γ with Ca concentration permits the local environment of the Q4-unit to be followed. For x < 0.50, Γ remains constant, related to the absence of a change in the coupling of this unit with the rest of the network. It is the coupling that makes the presence of rigid regions possible (through stress-free Q4-Q3 and stressed rigid Q4-Q4 bondings), although the number of flexible Q2- and Q1-units steadily increases with Ca content. Above the critical concentration x = 0.5, the sharp drop of the linewidth clearly shows decoupling of the Q4-unit with respect to the network, signifying decoupling of stressed rigid regions and thus percolation of flexibility. Similar results have been obtained for K (Chaimbault 2004;
In silicates, a strong piece of evidence for an elastic phase transition comes from a Brillouin scattering study of virgin and annealed Na and K silicates (Vaills et al. 2001, 2005; Chaimbault 2004). In fact, this technique shows that the elastic energy change upon annealing ∆Φ(x) between as-quenched (virgin) and annealed samples is almost zero in the stressed rigid phase and increases linearly for a modifier content that is larger than the threshold xc predicted by Maxwell constraint counting (Fig. 8). Changes in the elastic energy are indeed supposed to occur only in the flexible phase where floppy modes proliferate. The latter can be easily released under annealing. Moreover, the shift of the threshold from 20 to 15% due to cation size when changing from Na to K is also revealed, accordingly to the constraint counting. Since the elastic energy release under annealing is a measure of the number of floppy modes f(x) of the network, one can fit the measured elastic energies in Figure 8 indicated by the computed fraction of floppy modes of Table 1. 2 10 ∆Φ Na = ENa fNa = ENa ( x − xs ) − 3 3 2 ∆Φ K = EK fK = EK 4 ( x − xs ) − 3
(11) (12)
Note that, in Equations 11 and 12, the elastic energies are in meV. The fit gives the value of ENa = 0.12 meV (and xs = –1.23), EK = 0.11 meV (and xs = –4.25) for the floppy mode energies, which are one order-of-magnitude lower to the value of 4 meV
0.08 0.07 Elastic energy [meV]
Composition (mol%)
1740
0.06 0.05
Na
0.04 0.03
K
0.02 0.01 0
5
10
15
20 25 M2O (mol%)
30
35
40
Figure 8. Elastic energy released during annealing as a function of modifier content in K and Na silicates. Data from Vaills et al. (2005), Chaimbault (2004), and Chaimbault et al. (unpublished material). The straight lines are the floppy mode fit according to Equations 11 and 12 that allows the floppy mode energies ENa and EK to be extracted. Broken vertical lines indicate the location of the rigidity threshold from Maxwell constraint counting. Note: color is online only.
Micoulaut: Rigidity in silicates
−1.
-1
σ [Ω cm ]
0.0015
o
150 C o 250 C o 300 C O 350 C
0.001 0.0005 0
0
15
20
25
30
35
40
15
20
25
30
35
40
15 20 25 M2O (mol%)
30
35
40
150 C o 250 C o 300 C o 350 C
0.0005
0
10
o
0.001
−1.
-1
σ [Ω cm ]
5
SiO2-Na2O
0.0015
0
5
0.00015
o
150 C o 250 C o 300 C o 350 C
0.0001 5e-05 0
10
SiO2-K2O
0.0002
-1
Another signature of the loss of rigidity with increasing modifier content is the behavior of the dc ionic conductivity σ at a given temperature. Figures 9 and 10 illustrate the behavior of σ for melts of alkali and alkaline-earth composition. The trend with composition obviously exhibits two distinct conduction regimes on two compositional intervals: a first one at low modifier concentration where the conductivity is negligibly small and a second one where σ obviously displays an exponential growth or power-law behavior. For that reason, σ is sometimes plotted in log-scale. From Figures 9 and 10, it becomes clear that the onset of ionic conductivity in the second compositional interval is related with the breakdown of the stressed-rigid network at x > xc. In both the alkali and alkaline-earth silicate systems, the onset of conduction shifts with the size of the modifier cation, and correlates with the anticipated shift in the rigidity transition (determined from Table 1). This shift links ionic conductivity to glass elasticity and structure. The major consequence is that, the carrier concentration does not dominate the conductivity, as usually reported. In fact, the interpretation of the dc conductivity with composition is as follows. When x = xc, the number of floppy modes f vanishes and the network undergoes a rigid-toflexible transition. As mentioned above, for x < xc, the system is stressed rigid, i.e., it contains more constraints than degrees of freedom per atom. This means that the mobility of the modifier cation is very weak. The latter has to then overcome a strong mechanical-deformation energy to create doorways to move from one anionic site to another. This deformation energy will vanish in an ideal flexible network only when bond-bending and bond-stretching forces are considered (Thorpe 1983) at x > xc. The same behavior is obtained for the related elastic constants C11 and C44. Therefore, percolation of flexibility produces the percolation of the cation mobility that results in a substantial increase of the mobility and thus of the conductivity. As highlighted above in Figure 8, the effect of thermal history (annealing) is large in flexible glasses compared to stressed-rigid glasses where the elastic energy under annealing is virtually zero. In K silicates, annealing appears to change the ionic conductivity as long as x > 0.15 (Angel et al. 1995). Also, it has been noticed that non-Arrhenius conduction takes only place in flexible K
SiO2-Li2O
0.002
−1.
Onset of ionic conduction in the flexible phase
0.0025
σ [Ω cm ]
estimated in a covalent chalcogenide network glass from inelastic neutron scattering (Kamitakahara et al. 1991). The additional parameter xs provides only a measure of the discrepancy between vanishing of ∆Φ from the linear extrapolation in the flexible phase, and the estimate from Maxwell constraint counting as shown in Table 1. Finally, the stressed-rigid nature of the glasses at x < xc is confirmed in Brillouin longitudinal C11(x) and shear C44(x) elastic constants that show (Vaills et al. 2005) a power-law variation for the Na silicate, with an exponent p respectively of 1.68 and 1.69 in fair agreement with numerical simulations from Thorpe (1983). Compilation of various data shows that the agreement is not restricted to Na silicates. Potassium-based glasses display the same kind of power-law behavior with an exponent close to the Na system (Chaimbault 2004; Chaimbault et al. unpublished material).
1741
0
5
10
Figure 9. Dc conductivity in glassy alkali silicates as a function of modifier concentration [M = Li (black), Na (red), and K (blue)]. The vertical broken lines correspond to the Maxwell rigidity threshold. Li and Na: data from Otto and Milberg (1968) and Mazurin and Borisovskii (1957). K = data from Evstrop’ev and Pavlovskii (1967), Mazurin and Borisovskii (1957), Otto and Milberg (1968), and Chaimbault (2004, unpublished material). Note: color is online only.
silicates (Malki et al. 2006). One has finally to make the connection with the popular conductivity channel picture (Greaves and Ngai 1995) that has also received some support from Molecular Dynamics simulations (Sunyer et al. 2002) of Na silicates. In these glasses, the rigid to flexible transition occurs at the alkali concentration xc = 0.20, which is very close to the reported threshold concentration separating intrachannel cation hopping (involving a weak mechanical deformation of the network, since the motion occurs only in macroscopic holes of the network) from network hopping (strong mechanical deformation only possible in a flexible network). The link between ionic conduction and onset of flexibility is a very general phenomenon and certainly not restricted to
Micoulaut: Rigidity in silicates
2.5e-07
Ca
−1
-1
σ [Ω cm ]
2e-07 1.5e-07 1e-07
Ba
5e-08 0
640
oC
600
30
670
oC
575
oC
40 MO (mol%)
10
oC
-1 -1
690
Heat Flow Rate [mcal.g s ]
1742
570
oC
oC
50
networks
Experimental evidences Recent observations on network glasses have opened new questions and perspectives in this field of rigidity transitions. Indeed, the underlying nature of the onset of rigidity in glasses has been reconsidered because two transitions at the mean coordination numbers rc1 and rc2 have been found from complex calorimetric measurements at the glass transition. These measurements have used a temperature modulated DSC, which allows the resultant heat flow to be separated into a part that tracks with the same frequency the applied temperature modulation (the reversing part, Hrev in Fig. 11), and a residual, non-reversing heat flow (Hnr in Fig. 11), that contains the kinetic events and builds up with the onset of dynamical arrest. At high temperature, when the relaxation time is small compared to the modulation period, the latter contribution is negligible. With changing composition, it has been found (Feng et al. 1997; Selvenathan et al. 2000) that the non-reversing heat flow ∆Hnr (shaded area in Fig. 11, defining ∆Hnr) extracted from Hnr vanished over selected connectivity ranges rc1 < r < rc2, in which the usual mean coordination number was 2.4. The same kind of calorimetric behavior can be observed (Vaills et al. 2005) in Na silicates (Fig. 11, lower panel). These findings are correlated with the detection of vibrational thresholds in Raman scattering. As shown in Figure 12, values of rc1 and rc2 define an intervening region [or Boolchand intermedi-
4 2
44
Heat flow rate [mcal/g/sec]
Beyond the Maxwell scheme: Adaptative
6
HT
.
Hrev
40
TG
.
Hnr
0 60
Figure 10. Dc conductivity in glassy alkaline-earth silicates as a function of modifier concentration [M = Ca (red) or Ba (blue)]. The vertical broken lines correspond to the Maxwell rigidity threshold. Note that in Ca the shift of xc = 50% to lower concentrations (~45%) correlates with the vibrational signature of the rigidity transition. Data from Bourgel et al. (in review) and Malki et al. (2003). Note: color is online only.
the present silicates. Indeed, it has been shown recently that the mechanical thresholds detected from calorimetry and that define the elastic phases correspond exactly to the one observed in conduction (Novita et al. 2007).
.
8
80
100
120
140
o
Temperature T [ C] . Hr (x4)
Tg
36 32
. HT
28 24 420
. Hnr 440
x=0.290 460
480 500 520 o Temperature [ C]
540
560
Figure 11. A typical modulated differential scanning calorimetry MDSC scan of an As20Se80 (a) and x = 0.29 Na silicate (b) supercooled and glassy system. The glass-transition temperature Tg is extracted from the reversible part of the heat flow. The area under Hnr defines the nonreversible heat ∆Hnr and can be tracked with composition. Adapted from Georgiev et al. (2000) and Vaills et al. (2005).
ate phase, (IP), or reversibility window] between the previously defined flexible and the stressed rigid phase of glasses. It is found that the window sharpens and deepens upon low-temperature thermal annealing because the network stress that was frozen upon quenching is released. In the IP, glasses display some remarkable properties such as absence of aging (Chakravarthy et al. 2005) or internal stress (Wang et al. 2005), and selection of isostatically rigid local structures (Georgiev et al. 2000). Links
Micoulaut: Rigidity in silicates
a
1743
ity that either flexible, intermediate, or stressed rigid correlated domains exist over certain compositional intervals. Statistical constructions
b
c
From a statistical physics viewpoint, a natural way to generate the intermediate phase is to take into account possible fluctuations within the structure that have correlated domains with different mechanical character. Such frameworks have been proposed for network glasses. They rely on either size increasing cluster approximations (SICA) combined with constraint counting (Micoulaut and Phillips 2003), or on adaptative random bond models (ARBM) (Barré et al. 2005; Chubinsky et al. 2006) and that enable the Intermediate Phase to be described and to go beyond mean-field rigidity. In ARBM, the starting point is a one-bond-level description between local species whose random bond distribution can be easily evaluated from the probabilities of the local species. In the intermediate phase, the network self-organizes to lower the increasing stress due to constraints by entropic adaptation. We next apply this method to alkali silicates. Random bond model for silicates The local structure of an alkali or alkaline-earth silicate glass is considered from the viewpoint of its Qn species distribution (n = 1.4) with probability pn and a total species number N. Each Qn has n BOs, i.e., an effective coordination number n. All possible bondings are considered between the Qn and this leads to the random bond distribution: N ij * =
N (1 + δ ij )ijpi p j 2 ∑ ipi
(13)
i
Figure 12. Evidence for the intermediate phase in the network glass GexSe1–x. Non-reversible heat flow ∆Hnr for different aging times (a), threshold pressure Pc in Raman-pressure experiments (b), and symmetric stretch mode frequency νCS of corner-sahring tetrahadra from Raman spectroscopy (c). Adapted from Boolchand et al. (2001a) and Wang et al. (2005).
between the IP and high-temperature superconductors (Phillips 2002), protein folding (Rader et al. 2002), or computational phase transitions (Monasson et al. 1999) have been stressed that go much beyond simple analogies. The phenomenology of the intermediate phase has been described in a recent review by Micoulaut and Phillips (2007). From Equations 6–8, one realizes that the Maxwell description (dynamical matrix, constraint counting) cannot account for the observations such as those displayed in Figure 12. Since the completion of an optimally constrained rigid network now spans a range of compositions, the notion of flexible to rigid transition has to be reconsidered and the nature of the transitions observed at rc1 and rc2 has to be characterized. The structure of the initial theory also needs to be changed. Indeed, the latter relies only on a global approach and encodes the connectivity change in the single network mean coordination number, r, neglecting the possibil-
where pi and pj depend on the modifier concentration x and δij is Kronecker symbol (δij = 1 if i = j, otherwise zero). Here the asterisk denotes the fact that the distribution is random, i.e., only given by the statistical weights (the connectivity) of the involved species. For the study of rigidity transitions of alkali silicates, one can restrict the Qn distribution from n = 2 to n = 4 as Q1 and Q0 species are likely to appear only beyond the disilicate (x = 0.33) or even metasilicate (x = 0.5) composition. For Na and K silicates, the species distribution can be limited to Q4 and Q3 units in the composition range (Maekawa et al. 1991) where the onset of flexibility occurs. In this case, one has p4 =
1 − 3x 1− x
(14)
(p3 = 1 – p4) and a random bond distribution that derives from Equation 13, equal to * = N 44
N 8(1 − 3x )2 2 (2 − 3x )(1 − x )
(15)
* = N 43
N 24 x (1 − 3x ) 2 (2 − 3x )(1 − x )
(16)
* N 33 =
N 18 x 2 . 2 (2 − 3x )(1 − x )
(17)
The random distribution in Equation 13 can be also expressed
Micoulaut: Rigidity in silicates
1744
in terms of a bond probability y*ij by dividing the N*ij of Equations 15–17 by the number of bonds Nb between Qn species, equal to Nb =
N ∑ ipi . 2 i
(18)
If Maxwell constraint counting is applied at the one-bond level distribution of Equations 15–17, one obtains for the number of floppy modes: f = 3−
nc( 4 ) N4
nc( 4 ) + nc( 3) * nc( 3) * * y44 − y43 − y33 N4 + N3 N3
(19)
where nc(4) = 11 and nc(3) are the number of constraints of a Q4 and Q3 unit, respectively, and N4 = 3 and N3 = 4.5 are their corresponding number of atoms. Equation 19 yields for the Na [nc(3) = 11.5] and the K [nc(3) = 11] case: fNa = 4
(15 x 2 − 12 x + 2 ) 3(2 − 3x )2
(20)
and fK = −
40 − 252 x + 321x 2 15(2 − 3x )2
(21)
N 44 * . N 44
Probability
4
Q -Q
0.8
4 (1 − 3x ) N (1 − x )
(22)
2 N 33 + N 43 = 3 p3 N =
6x N (1 − x )
(23)
3
which, combined with the definition for N44, allows the one-bond distribution governed by the parameter α to be given as N 43 =
4 (1 − 3x ) N [ 2 − 3x − 2α(1 − 3x )] (2 − 3x )(1 − x )
N 33 =
4 α(1 − 3x )2 + (2 − 3x )(9 x − 2 ) N (2 − 3x )(1 − x ) 4 α(1 − 3x )2 (2 − 3x )(1 − x )
(24) (25)
(26)
.
In this case, the probabilities for the adapative case are y43 =
4 (1 − 3x )[ 3x(2α − 1) + 2(1 − α )] ( 2 − 3 x )2
y33 =
9 x 2 ( 4 α − 3) + 4 (α − 1)(1 − 6 x ) ( 2 − 3 x )2
(28)
y44 =
4 α(1 − 3x )2 . ( 2 − 3 x )2
(29)
(27)
A typical behavior of the one bond distribution is shown for two different values of the adaptation parameter α in Figure 13. The organization of the network at a given composition x using this one-bond level approach is thus determined from the parameter α. Letting α = 1 leads to the random bond case, whereas α ≠ 1 corresponds to the network adaptation. Note that in the latter, the description fails (y33 becomes negative) for the very silica-rich side (typically x < 10%) where, obviously, one must have random bonding (see also Fig. 14).
1 4
2 N 44 + N 43 = 4 p4 N =
N 44 = N
which vanish respectively at x = 0.237 and x = 0.221. The random model therefore provides thresholds that lie close to the estimate from Maxwell counting using the macroscopic modifier concentration x (Table 1). As the system will try to lower the stress with decreasing modifier content (i.e., increasing the network connectivity), departure from the random distribution in Equations 15–17 is achieved by defining the network adaptation parameter: α=
This parameter is chosen to apply on the Q4-Q4 connection that leads to a stressed rigid cluster (Si2O4), i.e., having nc > 3. Rewriting the number of type Q3 or Q4 bonds leads to
3
Q -Q
0.6
Free energy and configurational entropy
0.4
As stress costs energy, one can assume that with decreasing modifier content, the network will adapt itself to avoid the possibility of having too much stressed rigid Q4-Q4 connections. One can therefore define a stress energy that is proportional to the number of excess constraints (i.e., nc – 3) in the network, and that vanish in the flexible phase. One obtains for the Na case:
4
3
Q -Q
0.2
00
U Na ( x, α ) = nc − 3 = 5
10
20 15 M2O (mol%)
25
30
35
Figure 13. Probability of Q4-Q4, Q4-Q3, and Q3-Q3 connections in the random bond model for α = 1 (random bond distribution, solid lines), α = 0.95 (black broken), and α = 1.1 (red broken lines). Note: color is online only.
U Na ( x, α ) =
23 11 y44 + 3y43 + y33 − 3 3 9
2 4 (2 − 3x )(2 − 9 x ) + 2α (1 − 3x ) . 2 9 (2 − 3x )
(30) (31)
At fixed modifier concentration, the network is now able to move away from its random distribution N*ij by decreasing the adaptation parameter α. Indeed, decreasing α leads to a decrease of the stress energy U(x,α). From Equation 31, one gets also from
Micoulaut: Rigidity in silicates
-0.05
1745
2.5
stressed rigid (x=20%)
Adaptation parameter α
Free energy F(x,α)
2
-0.1 intermediate (x=23.5%)
-0.15
0
0.5
1 2 1.5 Adaptation parameter α
2.5
� SC(x,α) �α
1
=0
U(x,α)=0
0.5
flexible (x=26%)
-0.2
1.5
flexible
stressed rigid
3
0
0
5
10
20 15 M2O (mol%)
25
30
Figure 14. (x,α) diagram of a Na silicate glass showing the available phase space. The interplay between stress energy and entropy is only possible between x = 22 and 25% modifier content and defines the possible intermediate phase. The U(x,α) = 0 condition corresponds to Equation 31.
Figure 15. Free energy of the system as a function of the adaptation parameter α for three compositions corresponding to the three elastic phases (flexible, intermediate, stressed rigid). In the intermediate phase only, U(x,α) vanish close to the entropic maximum. The vertical broken lines define the intermediate phase ∆x.
the vanishing of excess constraints [i.e., UNa(x,α)], a relationship between the adaptation parameter and the concentration (solid line in Fig. 14). The present equation locates the network adaptation needed to cancel the stress energy at fixed modifier concentration x. One sees that the lower the value of α, the lower the rigidity threshold in modifier composition x, satisfying f = 0 or UNa(x,α) = 0, which is intuitive. With the increase in the number N44 of stressed rigid connections, the more modifier content will be needed to reduce the connectivity of the network, thus x increases with α. But in contrast to the RBM of network glasses (Barré et al. 2005), the adaptation parameter can here increase to values α > 1. In fact, the addition of the modifier content decreases the stress in the network because of depolymerization, and allows α to increase from its random bond value (α = 1). This can be realized only if the increase in stress needs little configurational (entropy) changes. From the distribution Equations 27–29, the configurational entropy of the network can be evaluated:
the number of constraints and allows for a certain threshold composition x1 to cancel of U(x,α) for α > 0. In the Na silicate network, this threshold composition is found at x1 = 22.22% (Fig. 14). One further observes that for x > x1, the location of U(x,α) will lie close to the maximum in configurational entropy (composition 23.5% in Fig. 14). This result means that avoiding stress will cost little entropic changes. This interplay between stress energy and entropy can only hold as long as U(x,α) can be cancelled, which is only possible up to certain compositional ranges x2 (in the sodium case, x = 25%, see Fig. 14). Note also that a large part of the (x,α) diagram is excluded to ensure that all probabilities fulfill 0 < yij < 1. Three characteristic compositions emerge from the diagram: a first one for x < x1 where there are too many cross-links to allow for any energetic adaptation; a second one for x < x2, where adaptation is not needed anymore because there is no more stress in the network; and a third one for x1 < x < x2, where the free energy decrease with decreasing modifier content (i.e., increasing stress) can be achieved by configurational rearrangements (entropy change). This is the intermediate phase, and ∆x = x2 – x1 represents the maximum width. In practice, decreasing the modifier content below x = x2 brings more and more constraints in to network because of the growing presence of Q4-Q4 connected bonding types that are stress rigid. The adaptation parameter α must therefore decrease continuously, but certainly not down to zero at x1.
Sc(x,α) = –y44lny44 – y43lny43 – y33lny33
(32)
which depends at a given modifier concentration on the adaptation parameter α. Now, one can minimize the free energy of the system with respect to α, U(x,α) – TSC(x,α) at a given temperature and modifier concentration. Figure 15 shows how the free energy behaves for three compositions: at low x (20%), the network is unable to decrease its stress energy because of the number of cross-links is too large. Mathematically, one would need to require α < 0 to vanish U(x,α), which is physically impossible because it leads to y44 < 0. The addition of the modifier reduces
Intermediate phases in silicate glasses As mentioned above, the calorimetric probe (MDSC) registers enthalpic changes across the glass-transition region (Fig. 11). These changes arise from various contributions and come from molecular rearrangements taking place at all length scales. For
Micoulaut: Rigidity in silicates
1746
400 -1
Non reversing heat flow ∆Hnr[kJ.mol ]
350
flexible
stressed rigid
K
300 250 200
Na
150 100 50 0 10
15
20
25
M2O (mol%)
30
Figure 16. Non-reversible heat flow ∆Hnr in Na (red) and K (blue) silicates, as a function of the alkali modifier content x. The broken vertical lines locate the rigidity transitions obtained from constraint counting at xc = 16.7% (for K) and xc = 20% (for Na). Note: color is online only.
that reason, one expects to observe non-mean-field effects, i.e., not averaged over macroscopic length scales, associated with the rigidity transitions using the thermal probe. The existence of a thermally reversing window (Fig. 12) is an example of such an effect (Boolchand et al. 2001b), and provides an explicit signature for the intermediate phase where a minimum in heat flow is found between the flexible (weakly connected) and stressed rigid (highly connected) phase. As seen in Figure 16, the window found in the K and Na binary silicate glasses (Vaills et al. 2005; Chaimbault 2004; Chaimbault et al. unpublished material) is reminiscent of similar results found in chalcogenide glasses (Georgiev et al. 2000; Selvenathan et al. 2000). The observation of a reversibility window in the present oxides leads naturally to the suggestion that Na glasses in the 18 < x < 23 and K glasses in the 14.5 < x < 16.5 composition range are in the intermediate phase, i.e., they have self-organized or adapted themselves to decrease the stress due to the presence of the overconstrained Q4-Q4 bondings. From Si29 NMR, Maekawa et al. (1991) have shown that the concentration of underconstrained Q3 (nc = 2.78 in Na, nc = 2.44 in K) and overconstrained Q4 (nc = 3.67) is equally balanced in Na silicates at 20% modifier content; thus, one has nc = 3 on average and the corresponding glass is stress-free. In the K silicates, the Q3 species population is larger (implying an earlier threshold in composition), but available experiments do not allow for a definite conclusion in the range of compositions where the K rigidity transition is supposed to take place.
Concluding remarks In this article, it has been shown that silicate glasses and melts could be simply described from the viewpoint of bonding constraints arising from relevant interatomic interactions. The
connectivity plays a key role in this model and defines, with addition of a modifier content, three elastic phases: a flexible phase at high modifier content, where the number of constraints per atom is lower than its number of degrees of freedom; a stressed rigid silica-rich phase, where it is exactly the opposite (nc > 3); and an intermediate phase that appears under network adaptation and which is mostly stress free (nc = 3). The location of the rigidity threshold between the flexible and the stressed rigid phase can be estimated reasonably well from Maxwell constraint counting and compared to experiments on alkali and alkaline earth silicates. Signatures for the two phases are found from vibrational and conductivity studies. The composition satisfying nc = 3 and which corresponds to an optimal glass composition, is clearly related to the viscosity maximum and the eutectic composition lying on the silica-rich part of the phase diagram of binary silicates. Finally, the self-organized intermediate phase can be determined from modulated differential scanning calorimetry. A certain number of peculiar properties of this phase are now clearly established in simple chalcogenide network glasses and should also be observed in silicate glasses. A prerequisite is the choice of very tiny compositional intervals.
Acknowledgments The author gratefully acknowledge comments, discussions, and scientific exchange over the years from P. Boolchand, F. Chaimbault, L.R. Corrales, J. Du, B. Guillot, G.S. Henderson, R. Kerner, M. Malki, D. Neuville, J.C. Phillips, P.S. Salmon, P. Simon, M.F. Thorpe, and Y. Vaills. A special thanks to P. Richet for his very insightful papers that have helped for the analysis of the experimental data.
References cited Abramo, M.C., Caccamo, C., and Pizzimenti, G. (1992) Structural properties and medium-range order in calcium-metasilicate (CaSiO3) glass: A molecular dynamics study. Journal of Chemical Physics, 96, 9083–9091. Angel, P.W., Hann, R.E., and Cooper, A.R. (1995) Thermal history effects on electrical relaxation and conductivity for potassium silicate glass with low alkali concentrations. Journal of Non-Crystalline Solids, 183, 277–289. Asokan, S., Prasad, M.V.N., Parthasarathy, G., and Gopal, E.S.R. (1989) Mechanical and chemical thresholds in IV-VI chalcogenide glasses. Physical Review Letters, 62, 808. Azoulay, R., Thibierge, H., and Brenac, A. (1975) Devitrification characteristics of GexSe1–x glasses. Journal of Non-Crystalline Solids, 18, 33–53. Barré, J., Bishop, A.R., Lookman, T., and Saxena, A. (2005) Adaptability and “intermediate phase” in randomly connected networks. Physical Review Letters, 94, 208701. Bhatia, A.B. and Thornton, D.E. (1970) Structural aspects of the electrical resistivity of binary alloys. Physical Review B, 2, 3004–3012. Bockris, J.O.M., Tomlinson, J.W., and White, J.L. (1955) Viscous flow in silica and binary liquid silicates. Transaction of the Faraday Society, 51, 1734–1751. Boehmer, R. and Angell, C.A. (1992) Correlations of the nonexponentiality and state dependence of mechanical relaxations with bond connectivity in ge-As-Se supercooled liquids. Physical Review B, 45, 10091–10094. Boisen, M.B., Gibbs, G.V., Downs, R.T., and D’Arco, P. (1990) The dependence of the Si-O bond length on structural parameters in coesite, the silica polymorphs, and the clathrasils. American Mineralogist, 75, 748–754. Boolchand, P. and Thorpe, M.F. (1994) Glass-forming tendency, percolation of rigidity, and onefold-coordinated atoms in covalent networks. Physical Review B, 50, 10366–10368. Boolchand, P., Bresser, W.J., Zhang, M., Wu, Y., Wells, J., and Enzweiler, R.N. (1995) Lamb-Mössbauer factors as a local probe of floppy modes in network glasses. Journal of Non-Crystalline Solids, 182, 143–154. Boolchand, P., Feng, X., and Bresser, W.J. (2001a) Rigidity transitions in binary Ge-Se glasses and the intermediate phase. Journal of Non-Crystalline Solids, 293, 348–356. Boolchand, P., Georgiev, D.G., and Goodman, B. (2001b) Discovery of the intermediate phase in chalcogenide glasses. Journal of Optoelectronics and Advanced Materials, 3, 703–720. Brown, G.E., Gibbs, G.V., and Ribbe, P.H. (1969) The nature and the variation in length of the Si-O an Al-O bonds in framework silicates. Amererican Mineralogist, 54, 1044–1061.
Micoulaut: Rigidity in silicates Bychkov, E., Benmore, C.J., and Price, D.L. (2005) Compositional changes in the first sharp diffraction peak in binary selenide glasses. Physical Review B, 72, 172107. Cai, Y. and Thorpe, M.F. (1989) Floppy modes in network glasses. Physical Review B, 40, 10535. Chaimbault, F. (2004) Percolation de rigidité dans les silicates d’alcalins. Ph.D. thesis, Université d’Orléans, France. Chakravarthy, S., Georgiev, D.G., Boolchand, P., and Micoulaut, M. (2005) Aging, fragility and reversibility window in bulk alloy glasses. Journal of Physics: Condensed Matter, 17, L1–L7. Chubinsky, M.V., Brière, M.-A., and Mousseau, N. (2006) Self-organization with equilibration: a model for the intermediate phase in rigidity percolation. Physical Review E, 74, 016116. Cohen, M.H. and Turnbull, D. (1961) Composition requirements for glass formation in metallic and ionic systems. Nature, 189, 131–132. Cormier, L., Ghaleb, D., Neuville, D.R., Delaye, J.M., and Calas, G. (2003) Chemical dependence of network topology of calcium aluminosilicate glasses: A computer simulation study. Journal of Non-Crystalline Solids, 332, 255–270. Du, J. and Corrales, L.R. (2006) Compositional dependence of the first sharp diffracion peak in alkali silicate glasses: A molecular dynamics study. Journal of Non-Crystalline Solids, 352, 3255–3269. Eckersley, M.C., Gaskell, P.H., Barnes, A.C., and Chieux, P. (1988) Structural ordering in a calcium silicate glass. Nature, 355, 525–527. Evstrop’ev, K.K. and Pavlovskii, V.K. (1967) Ionic diffusion and electrical conductivity of One-Alkali glasses. Inorganic Materials, 3, 673–678. Fang, C.Y., Yinnon, H., and Uhlmann, D.R. (1983) A kinetic treatment of glass formation VIII: Critical cooling rates for Na2O-SiO2 and K2O-SiO2 glasses. Journal of Non-Crystalline Solids, 57, 465–471. Farnan, I., Grandinetti, P.J., Baltisberger, J.H., Stebbins, J., Werner, U., Eastman, M.A., and Pines, A. (1992) Quantification of the disorder in network-modified silicate glasses. Nature, 358, 31–35. Feltz, A., Aust, H., and Blayer, A. (1983) Glass formation and properties of chalcogenide systems XXXVI: Permittivity and structure of glasses AsxSe1–x and GexSe1–x. Journal of Non-Crystalline Solids, 179–190. Feng, X., Bresser, W.J., and Boolchand, P. (1997) Direct evidence for stiffness threshold in chalcogenide glasses. Physical Review Letters, 78, 4422– 4425. Frantz, J.D. and Mysen, B.O. (1995) Raman spectra and structure of BaO-SiO2, SrOSiO2, and CaO-SiO2 melts to 1600 °C. Chemical Geology, 121, 155–176. Galeener, F.L. (1985) A model for the distribution of bond angles in vitreous SiO2. Philosophical Magazine B, 51, L1–L8. Gaskell, P.H., Eckersley, M.C., Barnes, A.C., and Chieux, P. (1991) Mediumrange order in the cation distribution of a calcium silicate glass. Nature, 350, 675–677. Georgiev, D.G., Boolchand, P., and Micoulaut, M. (2000) Rigidity transitions and molecular structure of AsxSe1–x glasses. Physical Review B, 62, 9228–9232. Gibbs, G.V., Hamil, M.M., Louisnathan, S.J., Bartell, L.S., and Yow, H. (1972) Correlations between Si-O bond length, Si-O-Si angle and bond overlap populations calculated using extended Huckel molecular orbital theory. American Mineralogist, 57, 1578–1613. Greaves, N.G. (1985) EXAFS and the structure of glass. Journal of Non-Crystalline Solids, 71, 203–217. Greaves, N.G. and Ngai, K.L (1995) Reconciling ionic-transport properties with atomic structure in oxide glasses. Physical Review B, 52, 6358–6380. Greaves, N.G. and Sen, S. (2007), Inorganic glasses, glass-forming liquids and amorphizing solids. Advances in Physics, 56, 1–166. Guillot, B. and Guissani, Y. (1996) A numerical investigation of the liquid-vapor coexistence curve of silica. Journal of Chemical Physics, 104, 7633–7644. Hannon, A.C., Vessal, B., and Park, J.M. (1992) The structure of alkali silicate glasses. Journal of Non-Crystalline Solids, 150, 97–102. He, H. and Thorpe, M.F. (1985) Elastic properties of glasses. Physical Review Letters, 54, 2107–2110. Henderson, G.S. (1995) A Si K-edge EXAFS/XANES study of sodium silicate glasses. Journal of Non-Crystalline Solids, 183, 43–50. ——— (2005) The structure of silicate melts: A glass perspective. Canadian Mineralogist, 43, 1921–1958. Ispas, S., Benoit, M., Jund, Ph., and Jullien, R. (2002) Structural properties of glassy and liquid sodium tetrasilicate: comparison between ab initio and classical molecular dynamics simulations. Journal of Non-Crystalline Solids, 307, 946–955. Kamitakahara, W., Cappelletti, R.L., Boolchand, P., Halfpap, B., Gompf, F., Neumann, D.A., and Mutka, H. (1991) Vibrational densities of states and network rigidity of chalcogenide glasses. Physical Review B, 44, 94–100. Keating, P.N. (1966) Effect of invariance requirements on the elastic strain energy of crystals with application to the diamond structure. Physical Review, 145, 637–645. Kerner, R. and Micoulaut, M. (1997) On the glass transition in covalent networks. Journal of Non-Crystalline Solids, 210, 298–305. Kirkwood, J.G. (1939) The skeletal modes of vibration of long chain molecules. Journal of Chemical Physics, 7, 506–509. Kohara, S., Suzuya, K., Takeuchi, K., Loong, C.K., Grimsditch, M., Weber, J.K.R.,
1747
Tangeman, J.A., and Key, T.S. (2004) Glass formation at the limit of insufficient network formers. Science, 303, 1649–1652. Maekawa, H., Maekawa, T., Kawamura, K., and Yokokawa, Y. (1991) The structural groups of alkali silicate glasses determined from 29Si MAS-NMR. Journal of Non-Crystalline Solids, 127, 53–64. Malki, M., Micoulaut, M., Chaimbault, F., Vaills, Y., and Simon, P. (2003) Percolative conductivity in alkaline earth oxide glasses. Europhysics Letters, 64, 661–667. Malki, M., Micoulaut, M., Chaimbault, F., and Vaills, Y. (2006) Correlation between floppy to rigid transitions and non-Arrhenius conductivity in glasses. Physical Review Letters, 96, 145504. Mastelaro, V.R., Zanotto, E.D., Lequeux, N., and Cortes, R. (2000) Relationship between short-range order and ease of nucleation in Na2Ca2Si3O9, CaSiO3, and PbSiO3 glasses. Journal of Non-Crystalline Solids, 262, 191–199. Mazurin, O.V. and Barisovskii, E.S. (1957) A study of the neutralization effect of a decrease in electric conductivity in sodium silicate glasses. Zhurnal Tekhnicheskoi Fiziki, 27, 275–288. Micoulaut, M. (1998) The slope equations: a universal relationship between local structure and glass transition temperature. European Physical Journal B, 1, 277–294. Micoulaut, M. and Phillips, J.C. (2003) Rings and rigidity transitions in network glasses. Physical Review B, 67, 104204. ——— (2007) Onset of rigidity in glasses: from random to self-organized networks. Journal of Non-Crystalline Solids, 353, 1731–1740. Micoulaut, M., Malki, M., Simon, P., and Canizares, A. (2005) On the rigid to floppy transitions in calcium silicate glasses from Raman scattering and cluster constraint analysis. Philosophical Magazine, 85, 3357–3378. Micoulaut, M., Guissani, Y., and Guillot, B. (2006) Simulated structural and thermal properties of glassy and liquid Germania. Physical Review E, 73, 031504. Misawa, M., Price, D.L., and Suzuki, K. (1980) The short-range structure of alkali disilicate glasses by pulsed neutron total scattering. Journal of Non-Crystalline Solids, 37, 85–97. Monasson, R., Zecchina, R., Kirkpatrick, S., Selman, B., and Troyansky, L. (1999) Determining computatinal complexity from characteristic phase transitions. Nature, 400, 133–137. Mozzi, R.L. and Warren, B.E. (1969) The structure of vitreous silica. Journal of Applied Crystallography, 2, 164–172. Narayanan, R.A. (2001) Physical origin of chemical trends in glass formation in alkali tellurites: reconciliation of constraint theory with experiments. Physical Review B, 64, 134207. Naumis, G.G. (2006) Variation of the glass transition temperature with rigidity and chemical composition. Physical Review B, 73, 172202. Nemilov, S.V. (1982) On the conformity of the results of structural and thermodynamical studies of vitreous silica. Fiziko Khimicheskaya Stekla, 8, 385–394. Newton, M.D. and Gibbs, G.V. (1980) Ab inito calculated geometries of charge distributions for H4SiO4 and H6Si2O7 compared with experimental values for silicates and siloxanes. Physics and Chemestry of Minerals, 6, 221–246. Novita, D.I, Boolchand, P., Malki, M., and Micoulaut, M. (2007) Fast ion-conduction and flexibility of glassy networks. Physical Review Letters, 98, 195501. Otto, K. and Milberg, M.E. (1968) Ionic conduction in alkali and thallium silicate glasses. Journal of the American Ceramic Society, 51, 326–329. Pauling, L. (1962) Die Natur der Chemischen Bindung. Verlag �������������������� Chemie, Weinheim. Pettifer, R.F., Dupree, R., Farnan, I., and Sternberg, U. (1988) NMR determinations of Si-O-Si bond angle distribution in silica. Journal of Non-Crystalline Solids, 106, 408–412. Phillips, J.C. (1979) Topology and covalent non-crystalline solids I: Short-range order in chalcogenide alloys. Journal of Non-Crystalline Solids, 34, 155–181. ——— (1981) Structural model of two-level glass system. Physival Review B, 24, 1744–1750. ——— (2002) Universal intermediate phases of dilute electronic and molecular glasses. Physical Review Letters, 88, 216401. Poole, J.P. (1948) Viscosité à basse temperature des verres alcalino-silicatés. Verres et Réfractaires, 2, 222–228. Poole, P.H., McMillan, P.F., and Wolf, G.H. (1995) Computer simulations of silicate melts. In J.F. Stebbins, P.F. McMillan, and D. Dingwell, Eds., Structure, Dynamics, and Properties of Silicate Melts, 32, p. 563–616. Reviews in Mineralogy, Mineralogical Society of America, Chantilly, Virginia. Poulsen, H.F., Neuefeind, J., Neumann, H.B., Schneider, J.R., and Zeidler, M.D. (1995) Amorphous silica studied by high-energy X-ray diffraction. Journal of Non-Crystalline Solids, 188, 63–74. Rader, A.J., Hespenheide, B.M., Kuhn, L.A., and Thorpe, M.F. (2002) Protein unfolding: Rigidity lost. Proceedings of the National Academy of Sciences U.S.A., 99, 3540–3545. Richet, P. (1984) Viscosity and confgurational entropy of silicate melts. Geochimica et Cosmochimica Acta, 48, 471–483. Richet, P. and Bottinga, Y. (1984) Anorthite, andesine, wollastonite, diopside, cordierite, and pyrope: Thermodynamics of melting, glass transitions, and properties of the amorphous phases. Earth Planet Science Letters, 67, 415–432.
1748
Micoulaut: Rigidity in silicates
Richet, P. and Mysen, B.O. (2005) Silicate Glasses and Melts: Properties and Structure. Elsevier, Amsterdam. Richet, P., Roskosz, M., and Roux, J. (2006) Glass formation in silicates: Insights from composition. Chemical Geology, 225, 388–401. Ryerson, F.J. (1985) Oxide solution mechanisms in silicate melts: systematic variation in the activity coefficients of SiO2. Geochimica et Cosmochimica Acta, 49, 637–651. Salmon, P.S. (2007) Structure of liquids and glasses in the Ge-Se binary system. Journal of Non-Crystalline Solids, 353, 2959–2974. Salmon, P.S., Martin, R.A., Mason, P.E., and Cuello, G.J. (2005) Topological versus chemical ordering in network glasses at intermediate and extended length scales. Nature, 435, 75–78. Schlenz, H., Kirfel, A., Schulmeister, K., Wartner, N., Mader, W., Raberg, W., Wandelt, K., Oligschleger, C., Bender, C., Franke, R., Hormes, J., Hoffbauer, W., Lansmann, V., Jansen, M., Zotov, N., Marian, C., Putz, H., and Neuefeind, J. (2002) Structure analyses of Ba-silicate glasses. Journal of Non-Crystalline Solids, 297, 37–54. Schwartz, L.M., Feng, S., Thorpe, M.F., and Sen, P.N. (1985) Behavior of depleted elastic networks: Comparison of effective-medium and numerical calculations. Physical Review B, 32, 4607–4617. Selvenathan, D., Bresser, W.J., and Boolchand, P. (2000) Stiffness transitions in SixSe1–x glasses from Raman scattering and temperature-modulated differential scanning calorimetry. Physical Review B, 61, 15061–15076. Senapati, A. and Varshneya, A.K. (1995) Configurational arrangements in chalcogenide glasses: A new perspective on Phillips’ constraint theory. Journal of Non-Crystalline Solids, 185, 289–296. Smith, W., Greaves, G.N., and Gillan, M.J. (1995) Computer simulations of sodium disilicate liquids. Journal of Chemical Physics, 103, 3091. Sreeram, A.N., Varshneya, A.K., and Swiler, D.R. (1991) Molar volume and elastic properties of multicomponent chalcogenide glasses. Journal of Non-Crystalline Solids, 128, 294–309. Sunyer, E., Jund, Ph., and Jullien, R. (2002) Characterization of the channel diffusion in a sodium tetrasilicate glass via molecular-dynamics simulations, Physical Review B, 65, 214203. Suzuki, S. and Abe, Y. (1981) The free volume of some oxide glasses at the transition temperature. Journal of Non-Crystalline Solids, 43, 141–143. Taniguchi, T., Okuno, M., and Matsumoto, T. (1997) X-ray diffraction and EXAFS studies of silicate glasses containing Mg, Ca, and Ba atoms. Journal of NonCrystalline Solids, 211, 56–63. Tangeman, J., Phillips, B.A., Navrotsky, A., Weber, J.K., Hiwson, A.D., and Key, T.S. (2001) Vitreous forsterite (Mg2SiO4): Synthesis, structure, and thermochemistry. Geophysical Research Letters, 28, 2517–2520. Tatsumisago, M., Halfpap, B.L., Green, J.L., Lindsay, S.M., and Angell, C.A. (1990) Fragility of Ge-As-Se glass-forming liquids in relation to rigidity percolation and the Kauzmann paradox. Physical Review Letters, 64, 1549–1552. Thorpe, M.F. (1983) Continuous deformations in random networks. Journal of Non-Crystalline Solids, 57, 355–370.
Thorpe, M.F. and Duxburry, P.M. (1999) Rigidity Theory and Applications. Kluwer Plenum Press, New York. Uchino, T. and Yoko, T. (1998) Structural and vibrational properties of sodium disilicate glass from ab initio molecular orbital calculations. Journal of Physical Chemistry B, 102, 8372–8378. Uhlig, H., Hoffmann, M.J., Lamparter, H.P., Aldinger, F., Bellissent, R., and Steeb, S. (1996) Short-range order and medium-range order in lithium silicate glasses, Part I: Diffraction experiments and results. Journal of the American Ceramic Society, 79, 2833–2838. Uhlmann, D.R. (1972) A kinetic treatment of glass formation. Journal of NonCrystalline Solids, 7, 337–348. Vaills, Y., Luspin, Y., and Hauret, G. (2001) Annealing effects in SiO2-Na2O glasses investigated by Brillouin scattering. Journal of Non-Crystalline Solids, 286, 224–234. Vaills, Y., Qu, T, Micoulaut, M., Chaimbault, F., and Boolchand, P. (2005) Direct evidence of rigidity loss and self-organization in silicates. Journal of Physics: Condensed Matter, 17, 4889–4896. Vollmayr, K., Kob, W., and Binder, K. (1996) Cooling-rate effects in amorphous silica: A computer-simulation study. Physical Review B, 54, 15808–15827. Wang, F., Mamedov, S., Boolchand, P., Goodman, B., and Chandrasekhar, M. (2005) Pressure Raman effects and internal stress in network glasses. Physical Review B, 71, 174201. Wilding, M.C., Benmore, C.J., Tangeman, J.A., and Sampath, S. (2004a) Evidence of different structures in magnesium silicate liquids: coordination change in forsterite- to enstatite-composition glasses. Chemical Geology, 213, 281–291. ——— (2004b) Coordination change in magnesium silicates. Europhysics Letters, 67, 212–218. Yuan, X. and Cormack, A.N. (2003) Si-O-Si bond angle and torsion angle distribution in vitreous silica and sodium silicate glasses. Journal of Non-Crystalline Solids, 319, 31–43. Zhang, M. and Boolchand, P. (1994) The central role of broken bond bending constraints in promoting glass formation in the oxides. Science, 266, 1355–1357. Zhao, J., Gaskell, P.H., Cluckie, M.M., and Soper, A.K. (1998) A neutron diffraction, isotopic substitution study of the structure of Li2O-2SiO2 glass. Journal of Non-Crystalline Solids, 232–234, 721–727. Zotov, N. (2001) Effect of composition on the vibrational properties of sodium silicate glasses. Journal of Non-Crystalline Solids, 287, 231–236.
Manuscript received December 21, 2007 Manuscript accepted May 3, 2008 Manuscript handled by Grant Henderson