AGNi by SHALON Cherenkov telescope. V.G. Sinitsyna, A.A. ... 83. 4.2 à 109. 3c4543. (0.43 ± 0.13). 4685. 5.3 à 1012. 1739+522. (0.53 ± 0.10). 7500. 1.4 à 1013 ...
´ Z´ 2009 PROCEEDINGS OF THE 31st ICRC, ŁOD
1
Constrains of Extragalactic Background Light from observation of AGNi by SHALON Cherenkov telescope V.G. Sinitsyna, A.A. Boldyrev, S.I. Nikolsky, V.Y. Sinitsyna ∗ P.N.
Lebedev Physical Institute, Moscow, Russia
Abstract. As the TeV gamma rays can be absorbed due to interaction of low-energy photons of Extragalactic Background Light (EBL), the observations of active galactic nuclei can also be used for the study background light from UV to far infrared and even cosmic microwave background. The EBL spectrum contains information about star and galaxy formation on early stages of Universe evolution. TeV gamma-rays, radiated by distant sources, interact with photons of background via γ + γ → e+ e− resonant process, then relativistic electrons can radiate gamma-ray with energies less than of primary gamma-quantum. As a result, primary spectrum of gamma-source is changed, depending on spectrum of background light. So, a hard spectra of Active Galactic Nuclei with high red shifts of 1 -1.8 allow to determine an absorption by Extragalactic Background Light and thus spectrum of EBL. The redshifts of SHALON very high energy gamma-ray sources range from z=0.0183 to z=1.375. During the period 1992 2009, SHALON has been used for observations of the metagalactic sources NGC1275 (z=0.0183), SN2006gy (z=0.019), Mkn421 (z=0.031), Mkn501 (z=0.034), Mkn180 (z=0.046), OJ 287 (z=0.306), 3c454.3 (z=0.895), 1739+522 (z=1.375). The most distant object 1739+522 (with redshift z=1.375), seen in TeV energy, is also the most powerful: its integral gamma-ray flux is found to be (0.53 ± 0.10)−12 cm−2 s−1 at energies of > 0.8 TeV. The integral gamma-ray flux of 3c454 (z=0.859) was estimated as (0.43 ± 0.13)−12 cm−2 s−1 . Spectral energy distributions and images of distant Active Galactic Nuclei are presented. Observations of distant metagalactic sources have shown that the Universe is more transparent to very high-energy gamma-rays than previously believed. Keywords: Active Galactic Nuclei, BL Lacs, Mkn 421, Mkn 501, Flat Spectrum Radio Quasars, Extragalactic Background Light
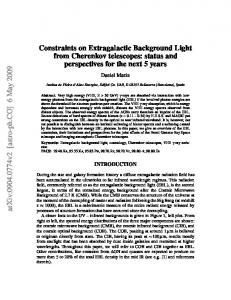
Fig. 1: The 3c454.3 and 1739+522 gamma - quantum (E > 0.8 TeV) integral spectra by SHALON in comparison with EGRET and Whipple data.
The gamma - astronomical researches are carrying out with SHALON [1] mirror telescope at the Tien-Shan high mountainous station since 1992. During the period 1992 - 2009 SHALON has been used for observations of metagalactic sources: Mkn 421, Mkn 501, Mkn 180, NGC 1275, SN2006 gy, 3c454.3, 1739+522 and galactic sources: Crab Nebula, Cyg X-3, Tycho’s SNR, Geminga, 2129+47XR [2–9] Our method of the data processing is described in [1], [2], [4], [5]. Some representative results
TABLE I: The metagalactic gamma-quantum sources catalogue, observed by SHALON; at the column Relative intensity of source the Crab Nebula intensity is taken as a unit – R
I. I NTRODUCTION The cosmological processes, connecting the physics of matter in active galactic nuclei will be observed in the energy spectrum of electromagnetic radiation. The understanding of mechanisms in active galactic nuclei requires the detection of a large sample of very high energy gamma-ray objects at varying redshifts. The redshifts of very high energy gamma-ray sources observed by SHALON range from z=0.0179 to z=1.375.
Sources Mkn 421 Mkn 501 Mkn 180 NGC 1275 SN2006 gy 3c4543 1739+522
Observable flux (×10−12 cm−2 s−1 ) (0.63 ± 0.14) (0.86 ± 0.13) (0.65 ± 0.23) (0.78 ± 0.13) (3.71 ± 0.65) (0.43 ± 0.13) (0.53 ± 0.10)
Distance (Mpc) 124 135 182 71 83 4685 7500
R 3.8 × 10⁹ 4.46 × 10⁹ 6.2 × 10⁹ 1.2 × 10⁹ 4.2 × 10⁹ 5.3 × 10¹² 1.4 × 10¹³
2
V.G. SINITSYNA et al. CONSTRAINS OF EBL FROM OBSERVATION OF AGNI BY SHALON
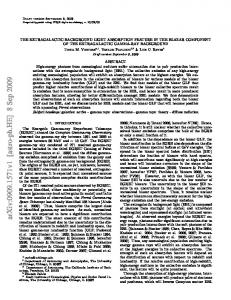
Fig. 2: From left to right: The 3c454.3 gamma-quantum integral spectrum with power index kγ = −0.99 ± 0.10; The event spectrum from 3c454.3 with background with index of kON = −1.13±0.08 and spectrum of background events observed simultaneously with 3c454.3 with index kOF F = −1.71 ± 0.08; The 3c454.3 image at energy range of more then 0.8 TeV; The energy image (in TeV units) of 3c454.3 by SHALON.
Fig. 3: From left to right: The 1739+522 gamma-quantum integral spectrum with power index of kγ = −0.93 ± 0.09; The event spectrum from 1739+522 with background with index of kON = −1.10 ± 0.08 and spectrum of background events observed simultaneously with 1739+522 with index kOF F = −1.71 ± 0.08; and The image of gamma-ray emission from 1739+522; The energy image of 1739+522 by SHALON.
are shown in [2–9] and figures in these proceedings. Our data for Crab, Mkn 421 and Mkn 501 are compared with those from other experiments in space, within a wide energy range 108 − 1014 eV. As is seen from [2–9] and figs (these proc.) the SHALON results for these known gamma-sources are consistent with the data by telescope EGRET telescope of the Compton Observatory (CGRO), obtained in the energy region 102 − 103 MeV. 3 C 454.3 In 1998 year a new metagalactic source 3c454.3 (z=0.859) has been detected by SHALON at TeV energies. The integral gamma-ray flux above 0.8 TeV was estimated as (0.43 ± 0.13) × 10−12 cm−2 s−1 (Table I, Fig. 1). It is consistent with the upper limit 0.84×10⁻¹¹ cm−2 s−1 obtained by Whipple telescope at energy more than 0.5 TeV [10], [11]. Taking into account that the spectrum from 3c454.3 measured by EGRET in the energy range ∼ 30 MeV to 50 GeV can be approximated as E −1.2 [12], the net data are well described by the uniform power law F (> E) ∝ E γ at whole energy range 108 − 1013 eV, (Fig. 1)[2–14]. Figure 4 presents Spectral energy distributions of 3c454.3. Black circles is SHALON data. The data marked with open circles; solid and dashed lines refer to the synchrotron self-Compton (SSC) and external Compton (EC) model described in [15]
II. 1739+522 One more remote metagalactic gamma - source was detected by SHALON in 1999 and is being intensively studied since then. This object was identified with the active galactic nucleus 1739+522; its image is shown in fig. 3. This the most distant object (with redshift z=1.375) is also the most powerful: its integral gammaray flux is found to be (0.53 ± 0.10) × 10−12 at energies of > 0.8 TeV. Within the range 0.8 - 7 TeV, the integral energy spectrum is well described by the single power law I(> Eγ ) ∝ Eγ−0.93±0.09 (fig. 3). The integral spectrum of the events from source has the power index kON = −1.10 ± 0.08 while the spectral index of the background events observed simultaneously with the source is kOF F = −1.71 ± 0.08. The average gamma-flux measured by EGRET telescope of Compton Observatory (CGRO)in the range ∼ 30 MeV to 50 GeV is about 2 × 10⁻⁸ cm−2 s−1 with integral spectrum index about −1.2 [12]. Spectral energy distributions of 1739+522 is presented on Figure 4. Black circles is SHALON data. The data marked with open circles; solid and dashed lines refer to the synchrotron (SSC) and (EC) model described in [15] According to our analysis, the energy spectra of distant quasars 3c454.3 and 1739+522 differ from those of the known blazars Mkn 421 (z=0.031) and Mkn 501 (z=0.034): FM kn 421 (> Eγ ) ∝ Eγ−1.87±0.11 and FM kn 501 (> Eγ ) ∝ Eγ−1.85±0.11 . The indices of in-
´ Z´ 2009 PROCEEDINGS OF THE 31st ICRC, ŁOD
3
TABLE II: The integral spectrum indices of SHALON spectra of Active Galactic Nuclei Sources
z
kγ
kON
kOF F
NGC 1275
0.0179
−2.25 ± 0.10
−2.13 ± 0.09
−1.72 ± 0.09
SN2006 gy
0.019
−3.13 ± 0.27
−2.54 ± 0.16
−1.73 ± 0.11
Mkn 421
0.031
−1.87 ± 0.11
−1.85 ± 0.10
−1.76 ± 0.09
Mkn 501
0.034
−1.85 ± 0.11
−1.83 ± 0.06
−1.72 ± 0.06
3c4543
0.859
−0.99 ± 0.10
−1.13 ± 0.08
−1.71 ± 0.08
1739+522
1.375
−0.93 ± 0.09
−1.10 ± 0.08
−1.71 ± 0.08
E XTRAGALACTIC BACKGROUND L IGHT
Fig. 4: top – Spectral energy distributions of 3c454.3. Black circles (at TeV energies) are SHALON data. The data marked with open circles; solid and dashed lines refer to the synchrotron self-Compton (SSC) and external Compton (EC) model described in [15]; bottom – Spectral energy distributions of 1739+522 with curves and data same as top
tegral spectra of events from Mkn 421 and Mkn 501 are respectively, kON = −1.85 ± 0.10 and kON = −1.83 ± 0.06 and the spectral indices of background events are kOF F = −1.76 ± 0.09 and kOF F = −1.72 ± 0.06. Hence, the average energy spectrum of these two metagalactic sources differs from spectra of remote objects 1739+522 and 3c454.3 within the energy range 1012 − 1013 eV. This observation does not contradict to unified energy spectrum F (> Eγ ) ∝ Eγ−1.2±0.1 .
As the TeV gamma rays can be absorbed due to interaction of low-energy photons of Extragalactic Background Light (EBL), the observations of active galactic nuclei can also be used for the study background light from UV to far infrared and even cosmic microwave background. The EBL spectrum contains information about star and galaxy formation on early stages of Universe evolution. TeV gamma-rays, radiated by distant sources, interact with photons of background via γ + γ → e+ e− resonant process, then relativistic electrons can radiate gamma-ray with energies less than of primary gamma-quantum. As a result, primary spectrum of gamma-source is changed, depending on spectrum of background light. So, a hard spectra of Active Galactic Nuclei with high red shifts of 1 -1.8 allow to determine an absorption by Extragalactic Background Light and thus spectrum of EBL. The redshifts of SHALON very high energy gamma-ray sources range from z=0.0179 to z=1.375. Among them bright enough AGNs of BLLac type (Mkn421, Mkn 501) and FSRQ type (3c454.3, 1739+522) those spectra are resolved in the TeV energy band from 1 to ∼20-30 TeV. The fit of a simple power law function to the observational data presented in table II and discussed above. As it is seen from the figs. 2, 3 and figs. 2, 4 from [16] the measured spectrum can be fitted by a power law with an exponential cutoff: F (> E) ∝ E −γ × exp(−E/Ecutof f ) with hard power indices of about γ ∼ 1.55 for Mkn 421 and Mkn 501 and γ ∼ 0.6 for 3c454.3 and 1739+522. The value of Ecutof f ranges from 11 ± 2 TeV for Mkn421, Mkn 501 and to 7±2 TeV for distant sources. It has mentioned that the observed spectra are modified by gamma-ray attenuation, i.e. Fobserved (E) = Fintrinsic (E) × exp(τ (E, z)) where τ (E, z) is optical depth for pair creation for a source at redshift z, and at an observed energy E. According to the definition of the optical opacity the medium influences on the primary source spectrum at τ ≥ 1, but for τ < 1 the medium is transparent, so the measuring of source spectrum in the both range of τ can give the intrinsic spectrum of the source to to constrain the EBL density. The optical depth for sources at redshifts from 0.031 to 1.375 was calculated with assumption of EBL shapes shown in fig 5. We used the averaged EBL shape from best-fit model and Low-SFR model [19] (see fig. 5 upper black curve)
4
V.G. SINITSYNA et al. CONSTRAINS OF EBL FROM OBSERVATION OF AGNI BY SHALON
Fig. 5: Spectral energy distribution of Extragalactic Background Light: models [17], [19] and measurements [18]; 1 - averaged EBL shape from best-fit model and Low-SFR model [19], 2 - EBL shape from constrained from observations of 3c454.3 (z=0.859); 3 - 2 - EBL shape from constrained from observations of 1739+522 (z=1.375) to calculate the attenuated spectrum of Mkn 421 in assumption of simple power low intrinsic spectrum of the source with spectrum index of γ = 1.5, taken from the range of τ < 1. The result is shown at fig. 6 with thin line; the black squares are observational data for Mkn 421. The shapes of EBL density constrained from the spectra of the high redshift sources 3c454.3 (z=0.859) and 1739+522 (1.375) are shown in fig 5 with curves 2 for and 3, accordingly. For these FSRQ sources the slope of intrinsic spectrum is taken γ = 0.4. The attenuated spectra for 3c454.3 and 1739+522 are also presented at fig. 6 (thin lines) together with observational data. Observations of distant metagalactic sources have shown that the Universe is more transparent to very high-energy gamma-rays than previously believed. R EFERENCES [1] S. I. Nikolsky and V. G. Sinitsyna, in Proc. Int. Workshop on VHE γ-ray Astronomy, Crimea, ed. A. A. Stepanian et al., p. 11, 1989. [2] V. G. Sinitsyna et al., Int. J. Mod. Phys. A no. 29, p. 7023, 7026, 7029, 2005. [3] S. I. Nikolsky and V. G. Sinitsyna, Nucl. Phys. B (Proc. Suppl.), vol. 122, p. 409, 2003. [4] V. G. Sinitsyna et al., Nucl. Phys. B (Proc. Suppl.), vol. 151, p, 108, 2006; ibid. vol. 122, p. 247, 2003; ibid. vol. 97, p. 215 and 219, 2001; ibid. vol. 75A, p. 352, 1999. [5] S. I. Nikolsky and V. G. Sinitsyna, Phys. Atom. Nucl. vol. 67, p. 1900, 2004. [6] V. G. Sinitsyna, AIP Conf. Proc. p. 515, 205 and 293, 1999. [7] V. G. Sinitsyna, in Proc. Toward a Major Atmospheric Cherenkov Detector-IV, ed. M. Cresti (Papergraf PD), p. 133, 1995; in Detector-V, ed. O. C. De Jager (Wesprint, Potcherfstroom), p. 136 and 190, 1997; in Detector-VII, ed. B. Degrange, G. Fontain, p. 57, 105, 11, 2005 .
Fig. 6: The measured spectra for Mkn 421, 3c454.4 and 1739+522 (black squares) together with spectra attenuated by EBL (see text) [8] V. G. Sinitsyna, S. I. Nikolsky, et al., Izv. Ross. Akad. Nauk Ser. Fiz. vol. 71, no. 7, p. 94, 2007; ibid. vol. 69, no. 3, p. 422, 2005; ibid., vol. 66, no. 11, p. 1667 and 1660, 2002; ibid.,vol. 63, no. 3, p. 608, 1999; ibid. vol. 61, no. 3, p. 603, 1997. [9] V. G. Sinitsyna, et al., in Proc. The Universe Viewed in GammaRays, ed. R. Enomoto, M. Mori, S. Yanagita (Universal Academy Press, Inc.), pp., 11, 235, 383 and 503, 2003. [10] A. D. Kerrick et al., ApJ, L59, p. 438, 1995. [11] J. H. Buckley, Astropart. Phys., vol. 11, p. 119, 1999. [12] R. Mukherjee et al., Astrophys. J., vol. 490, p. 116, 1997. [13] F. Krennrich, T. C. Weekes et al., Universal Academy Press, Inc., p. 157, 2003. [14] M. Catanese and T. C. Weekes, Preprint Series No4811, 1999. [15] G. Ghisellini et al., arXiv:astro-ph/9807317 [16] V. G. Sinitsyna et al., ”TeV Flaring activity of Mkn 421 and Mkn 501 blazars and detection of SN 2006gy” These Proceedings [17] Stecker, F. W., Malkan, M. A., and Scully, S. T. The Astrophysical Journal, 648:774783, 2006; arXiv:astro-ph/0510449. [18] T. M. Kneiske, K. Mannheim, and D. H. Hartmann, arXiv:astroph/0202104v1 [19] T. M. Kneiske, K. Mannheim, and D. H. Hartmann, Astronomy& Astrophysics vol. 1, p. 386, 2002.