May 6, 2009 - detection in the UV/optical: [3, 4] (filled red circle); Lower limits from galaxy ..... In order to derive an EBL limit, the MAGIC collaboration used a ...
arXiv:0904.0774v2 [astro-ph.CO] 6 May 2009
Constraints on Extragalactic Background Light from Cherenkov telescopes: status and perspectives for the next 5 years Daniel Mazin Institut de Física d’Altes Energies, Edifici Cn. UAB, E-08193 Bellaterra (Barcelona), Spain Abstract. Very high energy (VHE, E > 30 GeV) γ -rays are absorbed via interaction with lowenergy photons from the extragalactic background light (EBL) if the involved photon energies are above the threshold for electron-positron pair creation. The VHE γ -ray absorption, which is energy dependent and increases strongly with redshift, distorts the VHE energy spectra observed from distant objects. The observed energy spectra of the AGNs carry therefore an imprint of the EBL. Recent detections of hard spectra of distant blazars (z = 0.11 – 0.54) by H.E.S.S. and MAGIC put strong constraints on the EBL density in the optical to near infrared waveband. It is, however, not yet possible to distinguish between an intrinsic softening of blazar spectra and a softening caused by the interaction with low energy EBL photons. In this paper, we give an overview of the EBL constraints, their limitations and perspectives for the joint efforts of the Fermi Gamma-Ray Space telescope and imaging atmospheric Cherenkov telescopes. Keywords: Extragalactic background light, cosmology, Cherenkov telescopes, VHE γ -ray emission PACS: 29.40.Ka, 95.55.Ka, 95.85.Pw, 98.70.Rz, 98.70.Vc, 98.80.-k, 98.80.Es
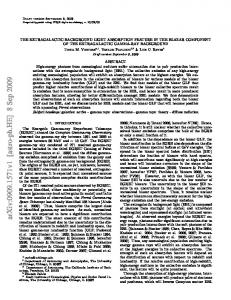
INTRODUCTION During the star and galaxy formation history a diffuse extragalactic radiation field has been accumulated in the ultraviolet to far infrared wavelength regimes. This radiation field, commonly referred to as the extragalactic background light (EBL), is the second largest, in terms of the contained energy, background after the Cosmic Microwave Background of 2.7 K (CMB). While the CMB conserves the structure of the universe at the moment of the decoupling of matter and radiation following the Big Bang (at redshift z ≈ 1000), the EBL is a calorimetric measure of the entire radiant energy released by processes of structure formation that have occurred since the decoupling. A closer look to the UV – infrared backgrounds is given in Figure 1, left plot. From right to left, the spectral energy distributions of the three major components are shown: the cosmic microwave background (CMB), the cosmic infrared background (CIB), and the cosmic optical background (COB). The COB, peaking at around 1 µ m is believed to originate directly from stars. The CIB, having its peak at ∼100 µ m, results mostly from starlight that has been absorbed by dust inside galaxies and reemitted at higher wavelengths. Throughout this paper, we will refer to COB and CIB together as EBL. Other contributions, like emission from AGN and quasars are expected to produce no more than 5 to 20% of the total EBL density in the mid IR (see e.g. [1] and references therein).
10
106
105
W m -2 sr-1
10-7
Frequency ν [GHz] 104 103
10-10 10-1
101
102
EBL CMB
10-8
10-9
102
ν Iν (nW m-2 sr -1)
-6
stars 100
10
dust 101 102 103 Wavelength λ [µm]
104
105
1 -1 10
1
10
102
λ (µ m)
FIGURE 1. Left: Schematic Spectral Energy Distributions (SED) of the most important (by intensity) backgrounds in the universe. From right to left: the cosmic microwave background (CMB), the cosmic infrared background (CIB) and the cosmic optical background (COB). The last two components together are called EBL. Plot adopted from [2]. Right: EBL measurements and limits (status end 2006). Tentative detection in the UV/optical: [3, 4] (filled red circle); Lower limits from galaxy counts: [5] (open grey triangles), [6] (open blue triangles); Detections in the near IR: [7] (open pink cross), [8] (filled brown circle), [9] (open blue squares), [10] (small open grey circles). Other symbols see in [11].
The EBL is difficult to measure directly due to strong foregrounds from our solar system and the Galaxy. The observation of distant sources of VHE γ -rays using Imaging Air Cherenkov Telescopes (IACT, such CANGAROO, H.E.S.S., MAGIC or VERITAS) provides a unique indirect measurement of the EBL (see below). The precision of the EBL constraints set by the IACT improved remarkably in the last few years. Contemporaneously with the IACT constraints, there has been rapid progress in resolving a significant fraction of this background with the deep galaxy counts at infrared wavelengths from the Infrared Space Observatory (ISO) and from the Spitzer satellite as well as at sub-millimeter wavelengths from the Submillimeter Common User Bolometer Array (SCUBA) instrument. The current status of direct and indirect EBL measurements (excluding limits from the IACTs) is shown in Fig. 1, right plot. In total, the collective limits on the EBL between the UV and far-IR confirm the expected two peak structure, although the absolute level of the EBL density remains uncertain by a factor of 2 to 10. In addition to this consistent picture, several direct measurements in the near IR have also been reported [e.g. 10], significantly exceeding the expectations from source counts (see [13] and [14] for recent reviews). If this claimed excess of the EBL is real, it might be attributed to emissions by the first stars in the history of the universe. These so-called Population III stars are believed to be heavy stars with a very low metallicity. This paper is structured as follows. In the next section we will describe the absorption effect on spectra of distant VHE γ -ray sources as blazars due to the EBL and a possibility of using measured blazar spectra to constrain the EBL. Then we present the current status of the EBL constraints using blazar spectra and discuss their validity. Finally, we sketch possible improvements of the EBL measurements in the next five years using the
exp(-τ )
1 τ=1
10-1
z = 0.03 z = 0.06 z = 0.10 z = 0.20 z = 0.50
10-2 -2 10
10-1
1
10 E [TeV]
FIGURE 2. Attenuation coefficients exp(−τ ) as a function of γ -ray energy. The “best fit” model from [12] is used for the EBL density. The curves represent the expected attenuation of the VHE γ -ray spectra for different source distances. The horizontal dotted line corresponds to the optical depth τ = 1, i.e. it crosses the attenuation curves at the energy, above which the universe becomes opaque.
new generation of the IACTs and the Fermi satellite.
VHE γ -RAYS FROM BLAZARS AS A PROBE OF THE EBL On the way from the source to the observer, VHE γ -rays can suffer absorption losses by interaction with the low energy photons of the EBL. The corresponding reaction is the pair-production of an electron-positron pair:
γVHE + γEBL −→ e+ + e− with Eγ VHE · Eγ EBL > (me c2 )2
(1)
The optical depth of the VHE γ -rays, τ (E), emitted at the redshift z, can then be calculated by solving the three-fold integral (see also [15]): Z z
Z 1
1−µ τ (Eγ , z) = dℓ(z ) dµ 2 0 −1 µ : = cos θ n (ε ) : = EBL energy density dℓ(z) : = distance element ′
Z ∞ ′ εth
d ε ′ n(ε ′ , z′ ) σγγ (ε ′ , E ′ , µ )
(2)
The expected optical depth for VHE γ -ray fluxes from sources at different redshifts is shown in Fig. 2. Hereby, the “best fit” model from [12] is used to estimate the EBL density. One can see that the optical depth is not only redshift but also energy dependent. The crossing points of the horizontal dotted line in Fig. 2 (τ = 1) with the attenuation lines define then the energy for the different redshifts, at which the universe becomes opaque. It is evident that a low threshold of a VHE γ -ray detector is essential to observe distant sources.
There are two major aspects concerning the interconnection between VHE γ -rays and the EBL: 1. The EBL leaves a unique imprint on the VHE spectra. This imprint can be used to study the EBL. 2. The impact of EBL onto VHE spectra is fundamental. We need to understand EBL in order to study intrinsic properties of the VHE γ -ray sources. Concerning point (1): From a single observed energy spectrum of a distant VHE γ -ray source, it is rather difficult if not impossible to distinguish between the imprint of the EBL and intrinsic features of the source. Observed features can be source inherent due to an internal absorption inside the source or due to a source, which does not provide necessary conditions for acceleration of charged particles to high enough energy. A way to pin-point the EBL impact is to use population studies of many extragalactic sources: whereas the intrinsic features might be different, the imprint of the EBL is the same (at a given redshift). With the current population of VHE γ -ray sources, it is only possible to set limits on the EBL, arguing that the observed spectra contain at least the imprint of the EBL. Note that only distant extragalactic VHE γ -ray emitters suffer from the absorption by the EBL. For the galactic sources, the effect is negligible up to energies of about 100 TeV. For higher energies, the absorption by the photon field of the CMB starts to be important.
STATUS OF THE EBL LIMITS SET BY CHERENKOV TELESCOPES The observed VHE γ -ray spectrum of a source (Fobs ) can be used to reconstruct the intrinsic spectrum (Fintr ), i.e. the one at the source location: Fintr = exp(τ ) × Fobs ,
(3)
whereas τ is an energy and distance dependent optical depth of VHE γ -rays. By measuring the observed spectrum of a source and inferring certain limits on the intrinsic spectrum of the source, it is thus possible to constrain τ and, therefore, to constrain the EBL density. Flat Spectrum Radio Quasars (FSRQ) and BL Lacs are subclasses of AGNs, which have their jet aligned close to the line of sight of the observer. The two subclasses are jointly called “blazars”. According to an accepted paradigm, in blazars VHE γ ray photons are produced by VHE electrons or protons, which are accelerated to VHE energies through a shock acceleration. High bulk motion Lorentz factors in the jets and the jet alignment towards the observer enhance chances to detect VHE γ -ray emission. Blazars are indeed the so far most prominent class of VHE γ -ray emitting extragalactic objects. In the shock acceleration models, the hardest index obtained for the accelerated particles is s = 1.5 (see e.g. [16]). In the case of protons interacting with ambient plasma, the resulting γ -ray spectrum has the same slope as s, i.e. Γint = 1.5. In the case of electrons, the spectrum of the γ -rays emitted through inverse Compton scattering is
FIGURE 3. HESS Left: The H.E.S.S. time-averaged spectrum of 1ES 1101-232 (red) together with a reconstructed intrinsic spectrum (blue) for three different EBL shapes. The first two EBL shapes lead to an unnaturally hard intrinsic spectrum (left and middle). Right: SED of the EBL. The thick black line between 0.8 and 4 µ m shows the H.E.S.S. limit. In the long-dashed regions, higher fluxes than the limit model would not be in conflict, as long as the flux in the 1-3 µ m range is within or around the limit. Figures from [18].
expected to be steeper than 1.5 under most circumstances. Therefore, different authors [17, 18, 19] assumed Γint = 1.5 to be the hardest possible intrinsic spectrum, and using this criterion stringent EBL limits were derived. It was, however, argued that stochastic electron acceleration [20], truncated electron spectra [21] or internal absorption (e.g. [22, 23]) can lead to even harder VHE γ -ray spectra than with an index of Γint = 1.5 although up to now no harder spectra with Γint < 1.5 have been observed at lower energies, where no EBL absorption can take place.
H.E.S.S. limits on the EBL The H.E.S.S. collaboration published a detection of two intermediate redshift blazars 1ES 1101-232 (z = 0.186) and H 2356-309 (z = 0.165) [18]. Both observed spectra (measured in the range 150 GeV – 3 TeV) show a relatively hard spectral index of 2.9 and 3.1, respectively. Using the criterion that the intrinsic blazar spectrum cannot be harder than Γint = 1.5, the authors derived a stringent upper limit on the EBL density in the region between 0.8 and 4 µ m (see Fig. 3). The derived upper limits imply a low level EBL density in agreement with the expectations from standard galaxy evolution models. The limits, in turn, rule out a cosmological origin of the near infrared excess [e.g. 10]. Using these EBL limits, physical parameters of Population III stars were explored by [24]. Sensitive limits on their star formation rate, metallicity and initial mass function were derived, which are comparable with or better than limits derived by other means (e.g. methods to derive the epoch of cosmic reionization).
ν Iν (nW m-2 sr -1)
ν Iν (nW m-2 sr -1)
102
102
10
10
1 -1 10
1
10
1 -1 10
2
10
1
10
102
λ (µm)
λ (µm)
FIGURE 4. Combined results. Left: Grid points (red filled circles) and minimum and maximum shape of the scan. In total, 8 064 000 hypothetical EBL shapes were tested. Right: Combined results from the extreme scan (dashed black line) in comparison to the result from the realistic scan (solid black line). Grey lines are the minimum and the maximum shapes tested in the scan. Grey markers are direct measurements and limits. Figures from [11].
Combined EBL limits using all blazars until 2006 A common criticism of the EBL limits derived as shown above is that they use only few blazars (therefore not providing consistency with other sources) and that the limits are obtained by assuming a certain EBL model and e.g. scaling it, or by exploring just a few details, i.e. the derived limits become very model-dependent. In order to avoid this dependency [11] performed a scan over many hypothetical EBL realizations (over 8 million different ones). The authors also tested all available blazar spectra (until 2006) to generalize the EBL limits. The scanned EBL region is shown in Fig. 4, left plot. The derived upper limits on the EBL density are shown in the right plot of Fig. 4. Two limits are shown: the solid line represents the upper limit assuming that the intrinsic blazar spectrum cannot be harder than Γint = 1.5, whereas the dashed line shows the limit for Γint = 2/3. The latter one can be understood as the most conservative one as it is derived for monoenergetic electrons, which are responsible for the inverse Compton scattering of ambient photons. One can see that the derived limits favor a low EBL level and are in good agreement with galaxy counts from the optical to the mid infrared regimes. Again, the cosmological origin of the near infrared excess [e.g. 10] can be ruled out even for the extreme case of Γint = 2/3.
MAGIC limits on the EBL in 2007, the MAGIC collaboration reported a detection of a very distant (z = 0.536) radio quasar 3C 279 at energies above 80 GeV [27, 19]. The measured energy spectrum of 3C 279 extends up to ≈500 GeV (see Fig. 5, left plot), which implies a very low EBL level. In order to derive an EBL limit, the MAGIC collaboration used a realistic EBL model of [12]. The authors [19] fine-tuned physical parameters of the EBL model in order to comply with the requirement that the intrinsic spectrum of 3C 279 cannot be harder than Γint = 1.5. The resulting maximum allowed EBL model is shown by the green line in Fig. 5, right plot. The EBL limit derived in [19] not only confirms limits from [18] and [11] but also probes for the first time the EBL at higher redshifts 0.2
1
Mk
8 42 00 6+ +2 2 42 0229 1-23 121 1 6 H S 10 749 1E S 1 034 1+ E S 1 1E 01 1 S 1E
1
τ=5
9
3C
27
τ=2
τ=1 -1
10
10-2 0
0.1
0.2
0.3
0.4
0.5
0.6 0.7 Redshift z
FIGURE 7. Gamma-ray horizon. IACTs probed the EBL density up to z = 0.536. The derived limits leave only a narrow region (indicated by a blue band) for EBL models. Figure from [19].
violation of Lorentz invariance [32] or new particles [33]). Future observations with the Fermi Gamma-ray observatory and new generation of IACTs such as H.E.S.S. II and MAGIC II will clarify the issue of hard intrinsic spectra due to a higher sensitivity of the instruments.
FUTURE PERSPECTIVE: FERMI, MAGIC II AND H.E.S.S. II Currently, 26 extragalactic VHE γ -ray emitters have been detected with redshifts up to z = 0.536. Although some of the measured spectra have very good statistics, there is a general difficulty to distinguish between source intrinsic effects (e.g. cut-off corresponding to the highest energies of relativistic particles in the jet or internal absorption due to local low energy photon fields) and the attenuation imprint caused by the EBL. The discovery of extragalactic sources with hard energy spectra by the HEGRA, H.E.S.S. and MAGIC instruments allowed to set stringent limits on the EBL density in the near to mid infrared (NIR and MIR) regimes [18, 11]. The limits are, however, dependent on the underlying sources physics assumptions, which are still a matter of debate. We anticipate that MAGIC II and H.E.S.S. II will at least double the statistics of the sources but this will most likely not resolve the ambiguity between intrinsic effects and the EBL. Probably, only CTA2 will be able to provide a sufficiently large sample (100++) of VHE γ -ray sources as well as high quality spectra for individual objects. For many of these sources, the spectral energy distribution (SED) will be determined at GeV energies (combining Fermi and lowest energies of the CTA measurements), which are much less affected by the absorption and, therefore, allowing for a study of intrinsic properties of the objects. We, therefore, anticipate that with CTA it will be possible to make robust predictions about the intrinsic spectrum above 100 GeV, either for individual sources or particular source classes. The measured spectra will therefore be a unique probe of the EBL. In 2
planned next generation IACT array with a milli Crab sensitivity from 30 GeV through several 100 TeV
the next 5 to 10 years following two main cosmological questions can be targeted: 1) precision measurements of today’s (i.e. at z = 0) EBL, especially in the ultraviolet to optical as well as in the mid to far infrared regimes, and 2) determine galaxy and stellar evolution properties by measuring the evolution of the EBL over redshift.
ACKNOWLEDGMENTS D.M. thanks the MAGIC collaboration and in particular MAGIC IFAE group in Barcelona for the excellent support. D.M. also thanks Martin Raue for many fruitful discussions and Eckart Lorenz for a careful reading of the manuscript and useful comments. This research was supported by a Marie Curie Intra European Fellowship within the 7th European Community Framework Programme.
REFERENCES 1. 2. 3. 4. 5. 6. 7. 8. 9. 10. 11. 12. 13. 14. 15. 16. 17. 18. 19. 20. 21. 22. 23. 24. 25. 26.
I. Matute, F. La Franca, F. Pozzi, et al., Astronomy & Astrophysics 451, 443–456 (2006). H. Dole, G. Lagache, Puget, et al., Astronomy & Astrophysics 451, 417–429 (2006). R. A. Bernstein, W. L. Freedman, and B. F. Madore, The Astrophysical Journal 571, 56 (2002). R. A. Bernstein, W. L. Freedman, and B. F. Madore, The Astrophysical Journal 632, 713–717 (2005). P. Madau, and L. Pozzetti, Monthly Notices of the Royal Astronomical Society 312, L9 (2000). G. G. Fazio, M. L. N. Ashby, P. Barmby, et al., ApJS 154, 39–43 (2004), astro-ph/0405595. E. Dwek, and R. G. Arendt, The Astrophysical Journal 508, L9 (1998). V. Gorjian, E. L. Wright, and R. R. Chary, The Astrophysical Journal 536, 550 (2000). E. L. Wright, and E. D. Reese, The Astrophysical Journal 545, 43 (2000). T. Matsumoto, S. Matsuura, H. Murakami, M. Tanaka, M. Freund, M. Lim, M. Cohen, M. Kawada, and M. Noda, The Astrophysical Journal 626, 31–43 (2005), astro-ph/0411593. D. Mazin, and M. Raue, Astronomy & Astrophysics 471, 439–452 (2007), arXiv:astro-ph/0701694. T. M. Kneiske, K. Mannheim, and D. H. Hartmann, Astronomy & Astrophysics 386, 1 (2002). M. G. Hauser, and E. Dwek, Annual Review of Astronomy & Astrophysics 39, 249 (2001). A. Kashlinsky, Phys. Rep. 409, 361–438 (2005), astro-ph/0412235. E. Dwek, and F. Krennrich, The Astrophysical Journal 618, 657–674 (2005), astro-ph/0406565. M. A. Malkov, and L. O’C Drury, Reports on Progress in Physics 64, 429–481 (2001). F. A. Aharonian, A. G. Akhperjanian, M. Beilicke, et al., Astronomy & Astrophysics 403, 523 (2003), astro-ph/0301437. F. Aharonian, A. G. Akhperjanian, A. R. Bazer-Bachi, et al., Nature 440, 1018–1021 (2006). J. Albert, E. Aliu, H. Anderhub, et al., Science 320, 1752– (2008), 0807.2822. F. W. Stecker, M. G. Baring, and E. J. Summerlin, The Astrophysical Journal, Letters 667, L29–L32 (2007), 0707.4676. K. Katarzy´nski, G. Ghisellini, F. Tavecchio, J. Gracia, and L. Maraschi, MNRAS 368, L52–L56 (2006), astro-ph/0603030. J. Sitarek, and W. Bednarek, Ap&SS 309, 105–109 (2007), arXiv:astro-ph/0610313. F. A. Aharonian, D. Khangulyan, and L. Costamante, MNRAS 387, 1206–1214 (2008), 0801.3198. M. Raue, T. Kneiske, and D. Mazin, ArXiv e-prints (2008), 0806.2574. J. R. Primack, J. S. Bullock, and R. S. Somerville, “Observational Gamma-ray Cosmology,” in High Energy Gamma-Ray Astronomy, edited by F. A. Aharonian, H. J. Völk, and D. Horns, 2005, vol. 745 of American Institute of Physics Conference Series, pp. 23–33. F. W. Stecker, M. A. Malkan, and S. T. Scully, The Astrophysical Journal 648, 774–783 (2006), arXiv:astro-ph/0510449.
27. M. Teshima, E. Prandini, R. Bock, M. Errando, D. Kranich, P. Majumdar, D. Mazin, E. Lindfors, E. Lorenz, M. Mariotti, V. Scalzotto, and R. Wagner, ArXiv e-prints (2007), 0709.1475. 28. F. Stecker, and S. Scully, The Astrophysical Journal, Letters 691, p. L91 (2009). 29. F. Tavecchio, and D. Mazin, MNRAS p. L140 (2008), 0809.2467. 30. J. Sitarek, and W. Bednarek, MNRAS 391, 624–638 (2008), 0807.4228. 31. A. Franceschini, G. Rodighiero, and M. Vaccari, Astronomy & Astrophysics 487, 837–852 (2008), 0805.1841. 32. R. J. Protheroe, and H. Meyer, Physics Letters B 493, 1 (2000). 33. A. de Angelis, M. Roncadelli, and O. Mansutti, Phys. Rev. D 76, 121301 (2007), 0707.4312.