Constraints on background contributions from K + Λ electroproduction S. Janssen,∗ J. Ryckebusch, and T. Van Cauteren
arXiv:nucl-th/0301096v2 31 Mar 2003
Department of Subatomic and Radiation Physics, Ghent University, Belgium (Dated: February 8, 2008) Results for response functions for kaon electroproduction on the proton are presented. A treelevel hadrodynamical model is adopted and it is shown that some of the electroproduction response functions are particularly powerful with the eye on gaining control over the parameterization of the background diagrams. The existing data set for the p(e, e′ K + )Λ reaction appears to rule out the use of a gK + Λp coupling constant beyond the boundaries of softly broken SU(3) flavor symmetry. Also the use of soft hadronic form factors, which has been proposed as a valid alternative for a hadrodynamical description of the p(γ, K + )Λ data in the resonance region, seems to be disfavored by the magnitude of the measured p(e, e′ K + )Λ cross sections. PACS numbers: 13.60.Le, 13.30.Eg, 14.20.Gk, 14.20.Jn
In studies of the baryon resonance spectrum, the electromagnetic production of mesons is a privileged reaction. Traditionally, most of the efforts have been directed towards the pion production channels. Sparked by major experimental efforts at accelerator facilities like Jlab, ELSA, SPring-8 and GRAAL there is growing interest in other meson production reactions like ηN , ωN , KΛ and KΣ. Amongst them, the strangeness production channels constitute a special class of reactions. Indeed, the involvement of the strange ss quark anti-quark pair in the reaction dynamics opens an additional window to study nucleon resonances. The SAPHIR collaboration at ELSA [1] has measured p(γ, K + )Λ and p(γ, K + )Σ0 differential cross sections and recoil polarizations from threshold up to photon energies of 2 GeV. At present, the published p(e, e′ K + )Λ data set is rather sparse with a few results from measurements in the seventies at Orsay [2], Cornell [3, 4] and DESY [5] and recent data from Hall C at Jlab [6, 7]. In the near future, however, concerted efforts at the Jlab facility will greatly improve on this situation. In Ref.[8], we have shown that an important fraction of the p + γ → K + + Λ reaction dynamics in the resonance region stems from background contributions. In the same work, we have discussed results obtained with three different schemes to deal with the background Feynman diagrams. We concluded that with the existing amount of p(γ, K + )Λ data, one is not able to put one of these schemes forward as most adequate. The extracted resonance information, however, turns out to be rather sensitive to the model choices with respect to the parameterizations of these background diagrams. In this work, our hadrodynamical model for p(γ, K + )Λ photoproduction will be applied to the corresponding electroproduction process. The cross section for the virtual photon induced reaction can be decomposed as: p dσ dσT L dσT dσL dσT T = +ǫ +ǫ cos 2φ + ǫ (ǫ + 1) cos φ dΩ dΩ dΩ dΩ dΩ
∗
[email protected]
We wish to demonstrate that some of the four p(e, e′ K + )Λ response functions offer good prospects to constrain the ambiguities in the description of the background which emerge from analyzing the real-photon data. The different ingredients in the reaction dynamics implemented in our p(e, e′ K + )Λ calculations are essentially identical to the ones adopted for the description of the p(γ, K + )Λ process reported in Ref. [8]. This implies that we start from a given set of interaction Lagrangians with each term having its characteristic coupling constant. From there, we derive both the longitudinal and transverse electromagnetic amplitudes. We wish to stress that also the resonances are described in the Lagrangian formalism and that no multipole decomposition gets introduced as is commonly done in calculations for π and η electroproduction. The tree-level Feynman diagrams implemented in the calculations include the usual Born terms and the K ∗ (892) and K1 (1270) mesons in the tchannel. As will be pointed out below, at some point two Λ∗ resonances (S01 (1800) and P01 (1810)) will be introduced in the u-channel. All those terms constitute the so-called background. In the s-channel, the nucleon resonances S11 (1650), P11 (1710), P13 (1720) and D13 (1895) are retained. Note that the D13 (1895) resonance is not listed in the Particle Data Group booklet [9] but is a candidate for a “new” resonance. A substantial improvement in the quality of the description of the p(γ, K + )Λ data was reached after including this resonance [10, 11]. In electroproduction processes, an additional form factor gets introduced at the electromagnetic vertices. For the Pauli and Dirac form factors of the proton, the parameterization of Lomon [12] is adopted. For the (transition) form factors of the Λ, K and the N ∗ , K ∗ , and Λ∗ resonances, no well established parameterizations are currently available. Therefore, we rely on the predictions of a relativistic constituent-quark model calculation by the Bonn group [13, 14] for the Λ, K + and K ∗ form factors. For the N ∗ and Λ∗ transition form factors, we use a dipole form with one universal cutoff mass of 0.84 GeV. For the K1 , a monopole form with cutoff mass of 0.6 GeV
2 1
1
model A -1
-1
10
10 -2
-2
10
10 -3
-3
10
1
model B -1 -2
10 -3
10 1
model C
dσT/dΩ (µb/sr)
dσL/dΩ (µb/sr)
10
10
model A
1 10
model B -1 -2
10 -3
10 1
-1
model C -1
10
10 -2
-2
10
10 -3
-3
10
10 0 0.5 1 1.5 2 2.5
0 0.5 1 1.5 2 2.5
Q2 (GeV2)
Q2 (GeV2)
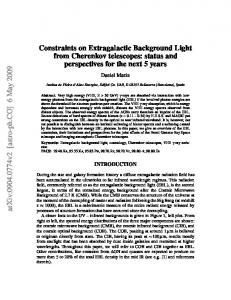
FIG. 1: Model predictions for the Q2 dependence of the longitudinal and transverse p(e, e′ K + )Λ response functions at W = 1.84 GeV and cos θ = 1. The three different panels are obtained with the background schemes of model A, B and C. The dashed curve represents the contribution from the Born terms, the dotted curve the entire background and the solid curve the sum of the complete background and resonance diagrams. The data are from Ref. [7].
was used. These electromagnetic cutoff masses are the only extra numbers entering our electroproduction calculations. All other parameters are fixed by constraining the model against the SAPHIR data at the real photon point. The sensitivity of the observables to the values of the cutoff masses in the electromagnetic form factors will be discussed below. In order to preserve gauge invariance at the level of the Born terms after introducing electromagnetic form factors, the gauge restoration procedure of Gross and Riska is adopted [15]. Results with alternative schemes will be discussed below. The magnitude of the Born contributions to the computed p(γ, K + )Λ strength is essentially determined by an effective coupling of the type [16]: GK + Λp ≡ gK + Λp · Fh (x, Λh ) ,
(1)
where gK + Λp can be related to the pion strength gπN N through SU(3) flavor symmetry. Further, Fh (x, Λh ) denotes the hadronic form factor, Λh the cutoff parameter and x ≡ (s, t, u) is the Mandelstam variable at the hadronic vertex. We use a dipole parameterization for Fh (x, Λh ) [17, 18]. Hard cutoff masses (typically, Λh ≥ 1.5 GeV) correspond with Fh (x, Λh ) ≈ 1 over the entire resonance region. The background terms on their own
overpredict the p(γ, K + )Λ data dramatically when the effective coupling GK + Λp goes out from a modest SU(3) flavor symmetry breaking, at the same time keeping the impact of the hadronic form factor temperate by fixing Λh ≥ 1.5 GeV. This situation can be rectified through decreasing the coupling constant gK + Λp by several factors, thereby putting forward strong SU(3) flavor symmetry breaking [19]. Alternatively, the hadronic form factor can be adjusted in such a manner so as to sufficiently reduce GK + Λp . In practice, this amounts to adopting smaller values of Λh , thereby amplifying the dependence of the results on the hadronic form factors [20]. In practice, acceptable levels of the computed Born strength, which we define as being of the same order of magnitude as the measured cross sections, require cutoff masses Λh which approach the kaon mass, leading to a very unsatisfactory situation from the field-theoretic point of view. Both above mentioned manipulations amount to effectively reducing GK + Λp , either through adjusting the coupling constant or the hadronic form factor or a combination of both, thereby making assumptions which are rather questionable. Therefore, instead of adjusting the effective coupling GK + Λp , we have suggested an alternative procedure consisting of introducing hyperon resonances as a more natural mechanism to counterbalance the Born strength [11]. Those u-channel diagrams are observed to interfere destructively with the other background terms. In this way, a qualitatively good description of the p(γ, K + )Λ data can be reached, without the need of introducing rather questionable values for the gK + Λp coupling and/or Λh . The three aforementioned ways of treating the background diagrams are labeled as model A, B and C. Model A adopts soft hadronic form factors with Λ √h approaching the kaon mass. Model C uses gK + Λp / 4π ≈ −0.4, which is almost ten times smaller than the prediction based on SU(3) flavor symmetry. Whereas models A and C lower GK + Λp , model B introduces hyperon resonances in the u-channel and attributes a secondary role to the hadronic form factors, at the same time respecting the constraints on gK + Λp imposed by SU(3) flavor symmetry. As pointed out in Ref. [8], all three models lead to a similar quality of agreement between the calculations and the p(γ, K + )Λ data and none of the three schemes could be put forward as favorable. In the electroproduction calculations, however, large differences emerge between the predictions of the three different background models. This is made clear in Fig. 1 showing model predictions for the Q2 dependence of the longitudinal and transverse p(e, e′ K + )Λ response functions at a particular value for the invariant mass W and the kaon cm angle θ. The background models A and C are discerned to severely underestimate the longitudinal and the transverse response. Model B, on the other hand, provides a prediction of the magnitude and Q2 dependence of both observables which is far superior to what is obtained with models A and C. The large variations between the predictions of the background models can be better understood
-2
10 0
0.5
1
1.5
2 2
2.5
3
3.5
4
2
L
0 -0.05 -0.1
TL
-0.15
Q (GeV )
0.25 0.2 0.15 0.1 0.05 0 0.05
dσT (µb/sr)
-1
10
0.25 0.2 0.15 0.1 0.05 0 0.05
dσTT (µb/sr)
dσL (µb/sr)
Ref. [ 2 ] Ref. [ 3 ] Ref. [ 4 ]
dσTL (µb/sr)
dσT/dΩ + ε dσL/dΩ (µb/sr)
3
0 -0.05 -0.1
0 0.5 1 1.5 2 2.5
2
2
Q (GeV ) FIG. 2: Calculations for the Q2 dependence of the φ-averaged p(e, e′ K + )Λ response functions at hW i = 2.15 GeV and forward θ angles. The solid, dashed and dotted line are from model A, B and C, respectively. Data is from Refs. [2, 3, 4].
2
Q (GeV )
FIG. 3: Model calculations for the Q2 dependence of the θaveraged p(e, e′ K + )Λ response functions at W = 1.84 GeV. Background model B is adopted. Line conventions as in Fig. 1. 0.3
0.4
model A
model A
0.3
0.2
0.2 0.1
0.1
0 0.3
model B 0.2 0.1 0 0.3
dσT/dΩ (µb/sr)
dσL/dΩ (µb/sr)
by decomposing the response functions in contributions from the Born terms, the total background and s-channel resonances. Then, it becomes apparent that a necessary condition for arriving at a reasonable prediction of the data is that the combined background diagrams already lead to response functions which are of the order of the measured strength. As such, the p(e, e′ K + )Λ observables appear to provide direct access to the background contributions and may eventually allow us to gain further control over the value of GK + Λp . Similar trends are observed in Fig. 2 where the model calculations are compared with the available dσT + ǫdσL data for the φ-averaged cross section at forward θ. On the basis of the comparisons displayed in Figs. 1 and 2, we are tempted to conclude that the physical assumptions underlying models A and C, which are compatible with the existing p(γ, K + )Λ data set, are not supported by the p(e, e′ K + )Λ data. This suggests that calculations based on the introduction of soft hadronic form factors and/or a gK + Λp coupling constant strongly deviating from SU(3) predictions are completely off when it comes to predicting the cross sections for the corresponding electroinduced process. It is worth stressing that the results contained in Figs. 1 and 2 refer to kinematics whereby the kaon is emitted in a small cone about the direction of the threemomentum transfer. In Fig. 3 we display the corresponding θ-averaged dσL , dσT , dσT L and dσT T response functions. In the angle-averaged responses, the strength directly related to the s-channel resonances is at best of the same order as the one stemming from the background diagrams and tends to decrease with increasing Q2 . In that respect, the ratio of the background to resonance strength in the θ-averaged responses is rather similar to what is observed at forward θ angles. All results mentioned so far were obtained with a dipole electromagnetic form factor for the N ∗ resonances with a realistic cutoff of 0.84 GeV. We now wish to investigate the sensitivity of our results to this choice.
TT
-0.15
0 0.5 1 1.5 2 2.5 2
T
0 0.4
model B
0.3 0.2 0.1 0 0.4
model C 0.2
model C
0.3 0.2
0.1 0
0.1 0 0.5 1 1.5 2 2.5 2
2
Q (GeV )
0
0 0.5 1 1.5 2 2.5 2
2
Q (GeV )
FIG. 4: Sensitivity of the model calculations of Fig. 1 to the N ∗ electromagnetic form factors. The shaded region displays the variations in the predictions when using cutoff masses ranging between 0.4 ≤ ΛN ∗ ≤ 1.0 GeV.
Therefore, we have varied the N ∗ dipole cutoff mass between values which appear as upper and lower limits for a physically realistic range. It seems that the results were rather insensitive to those variations. This is shown in Fig. 4 where the shaded region indicates the variation in the predictions when modifying the cutoffs in the range 0.4 ≤ ΛN ∗ ≤ 1.0 GeV. All other electromagnetic form factors in the dynamics of the background are kept fixed. From this figure, we can conclude that reasonable
0.4
L
0.3 0.2 0.1
dσT/dΩ (µb/sr)
dσL/dΩ (µb/sr)
4 0.4
T
0.3 0.2 0.1
0 0.5 1 1.5 2 2.5
0 0.5 1 1.5 2 2.5
Q (GeV )
Q (GeV )
2
2
2
2
FIG. 5: Model calculations for the Q2 dependence of dσL and dσT with background model B. The solid line adopts the gauge restoration procedure of Ref. [15], the dashed line uses modified form factors as explained in the text. Kinematics and data are as in Fig. 1.
changes in the functional Q2 dependence of the resonance couplings does not alter the marked dominance of the background contributions. Up to this point, all results are obtained with the gauge restoring procedure of Ref. [15]. Within this scheme, one can use different form factors for the proton and the kaon. Alternatively, gauge invariance can be restored by using the same functional Q2 dependence for the F1p proton and FK kaon form factor. We have investigated this option through averaging Fp1 (Q2 ) and FK (Q2 ) and display some results in Fig. 5. As was already mentioned in e.g. Ref. [21], the choices with respect to the gauge restoring procedure and form factor parameterization have a sizable impact on the results but are similar in size for the three adopted background models. We wish to stress again that the values of the coupling constants and the hadronic cutoff parameters which enter our p(e, e′ K + )Λ calculations are those which optimize the agreement between the predictions and the data at Q2 = 0. In order to exclude the possibility that rather modest modifications in these parameterizations of the coupling constants alter our findings, we have refitted all
[1] [2] [3] [4] [5] [6] [7] [8] [9] [10] [11] [12]
M.Q. Tran et al., Phys. Lett. B 445, 20 (1998). C.N. Brown et al., Phys. Rev. Lett. 28, 1086 (1972). C.J. Bebek et al., Phys. Rev. Lett. 32, 21 (1974). C.J. Bebek et al., Phys. Rev. D 15, 594 (1977). T. Azemoon et al., Nucl. Phys. B 95, 77 (1975). G. Niculescu et al., Phys. Rev. Lett. 81, 1805 (1998). R.M. Mohring et al., nucl-ex/0211005 (2002). S. Janssen, J. Ryckebusch, D. Debruyne, and T. Van Cauteren, Phys. Rev. C 65, 015201 (2002). Particle Data Group, D.E. Groom et al., Eur. Phys. J. C 15, 1 (2000). T. Mart and C. Bennhold, Phys. Rev. C 61, (R)012201 (2000). S. Janssen, J. Ryckebusch, W. Van Nespen, D. Debruyne, and T. Van Cauteren, Eur. Phys. J. A 11, 105 (2001). E. L. Lomon, Phys. Rev.C 64, 035204 (2001).
the coupling constants of the three presented models to a data set which includes both the photo- and electroproduction data. The results of those fits barely deviate from the predictions presented in Figs. 1 and 2. Once again we had to conclude that the background models A and C are intrinsically incapable of reproducing the p(e, e′ K + )Λ data. Summarizing, we have extended our tree-level hadrodynamical analysis of kaon photoproduction in the resonance region to p(e, e′ K + )Λ processes. Except for the Q2 dependence of the electromagnetic form factors, no new ingredients are introduced in the model. In line with our findings for the p(γ, K + )Λ reaction, also in the corresponding electroproduction process a leading role is played by the background diagrams. It was pointed out that a hadrodynamical analysis of the p(γ, K + )Λ data at tree level faces difficulties in pinning down those terms. As a matter of fact, we propose that the longitudinal and transverse p(e, e′ K + )Λ responses can serve as a reliable and powerful means of constraining the parameters which enter the background diagrams. The recent Jlab and older Cornell and Orsay p(e, e′ K + )Λ data appear incompatible with a hadrodynamical description based on a gK + Λp coupling which is beyond the boundaries imposed by SU(3) flavor symmetry. In addition, the use of soft hadronic form factors, which after all provide an alternative for accounting for the p(γ, K + )Λ data, leads to p(e, e′ K + )Λ predictions far below the level of the measurements. The introduction of hyperon resonances in the u-channel, on the other hand, emerges as a valid alternative for providing a consistent description of both p(e, e′ K + )Λ and p(γ, K + )Λ data, thereby respecting the constraints imposed by SU(3) flavor symmetry. More data on the separated response functions would help in further shedding light on the issue of the background terms, and will eventually result in reduced uncertainties in the extraction of the resonance parameters from both the real and virtual photon kaon production data.
[13] C. M¨ unz, J. Resag, B. Metsch, and H. Petry, Phys. Rev. C 52, 2110 (1995). [14] D. Merten, U. L¨ oring, K. Kretzschmar, B. Metsch, and H.-R. Petry, Eur. Phys. J. A 14, 477 (2002). [15] F. Gross and D. Riska, Phys. Rev. C 36, 1928 (1987). [16] T. Feuster and U. Mosel, Phys. Rev. C 59, 460 (1999). [17] H. Haberzettl, Phys. Rev. C 56, 2041 (1997). [18] R. Davidson and R. Workman, Phys. Rev. C 63, 025210 (2001). [19] S. Hsiao, D. Lu, and S. Yang, Phys. Rev. C 61, 068201 (2000). [20] H. Haberzettl, C. Bennhold, T. Mart, and T. Feuster, Phys. Rev. C 58, (R)40 (1998). [21] J. David, C. Fayard, G. Lamot, and B. Saghai, Phys. Rev. C 53, 2613 (1996).