University o/Massachusetts, Amherst, Massachusetts 01002. Subjects were .... in the test item, with percentages of miss and false aJarm errors. Note that the ...
Bulletin of the Psychonomic Society 1975, Vol. 6 (6), 585·588
Constructing visual images from verbal descriptions DONNA CRUSE
OregonState University, CorvaUis, Oregon 97331
and
CHARLES CLIFTON, JR.
University o/Massachusetts, Amherst, Massachusetts 01002
Subjects were given written descriptions of simple open geoin~tric forms a~d made. dec~ions ~bout the location of the point at which each constructed form terrrunated. Thell" reactIOn time mcreased approximately 1 sec for each segment in the constructed figure. Reaction time for a comparable decision did not vary as a function of the number of segments in actually presented figures. It appeared that subjects took approximately 1 sec to encode a symbol as a line segment and add it to a mental image. In another part of the experiment, intended to measure the time taken to name a line segment, subjects made decisions about the presence of a target item in a list of visual symbols or in a geometric form .• Visual search through a list of symbols seemed to be self-terminating, while search through the segments of a geometric form seemed to be largely exhaustive. However, no clear conclusions were possible about the visual-to-verbal transformations which had been expected to occur in this part of the experiment. Two questions of some interest in the topic of visual imagery are how long it takes to construct a mental image from a verbal description and how long it takes to encode a picture verbally. Previous research on the former question has focused upon how people generate an image of a well-known visual form, when they are given its name, and suggests that the time required is on the order of % to 1 sec (Moore, 1915; Paivio & Begg, 1971; Posner, 1973; Weber & Castleman, 1970). The research reported here focuses on the question of how long people take to form mental images of novel shapes, given verbal descriptions of the shapes, and also included conditions designed to measure the time required to transform a pictured line segment into its verbal description.
performed two different tasks on alternate trial blocks: an "end point" task, in which they decided whether the target designated the point at which the test figure terminated, and a "list membership" task, in which they decided whether the target item designated a line segment included in the figure.
Subjects and General Procedure Five adult subjects were tested for two to three 45-min practice sessions and four test sessions. On each trial subjects were shown a single written target item which designated a point in space or a directed line segment. The target item was followed either by an open figure which consisted of three to five line segments (visual figure condition) or a written description of such a figure (description condition). Figure 1 shows an example of each type of trial. Subjects
Materials and Equipment A 5 by 5 dot matrix, 10 cm on a side, was taped to the screen of a computer-controlled oscilloscope. The central dot was circled and served as a starting point for all figures. A fIgure composed of three to five connected line segments joining dots on the matrix could be displayed. The line segments making up a figure were one or two units long (they connected adjacent dots or dots separated by a single dot), and were directed in one of the eight compass directions (north, northeast, east, southeast, south, southwest, west, northwest) (see Figure 1). Figures were constructed randomly on each trial, with the following restrictions: (1) No line segment was allowed to cross or join another line segment at other than the connecting point; (2) no vector could occur more than once in a figure; (3) no line segment could extend beyond the boundaries of the 5 by 5 dot matrix; and (4) the imaginary vector from the starting point of the figure to the end point had to be one of the set of 16 possible vectors and could not cross or join any other segment. The oscilloscope was also used to display the written descriptions of the figures and of the targets. A written description of a figure consisted of a horizontally displayed list of three to five symbols, each representing 1 of the 16 possible vectors (lN, INE, IE, ISE, IS, ISW, lW, INW, 2N, ..• , 2NW). A target item consisted of one such symbol.
This research was supported in part by a grant from the National Institute of Mental Health to the second author (MH-23939) and a grant from the National Science Foundation to the Department of Psychology, University of Massachusetts (GU4041). Requests for reprints should be directed to Donna Cruse, Department of Psychology, Oregon State University, Corvallis, Oregon 97331.
Procedure After the practice sessions, each session consisted of 10 blocks of 36 trials. Each trial began with a 3-sec visual presentation of a single target symbol. One second after the offset of the target, a figure or the list of symbols describing a legal fIgure was presented, and remained on until the subject responded by pressing the right (positive) or left (negative) lever.
METHOD
585
586
CRUSE AND CLIFfON, JR.
• • • • o. • • • •!WHI'. ••• • • • • • • • • • •
• • • • • • • • • o· ••• HI • • • • • • • • •
0 0
0
DESCIIPTION
0
0
TlST
·
I
I
• • • • •
• • • •
· ·• •• •• ·• ·•
VISUAL
• • • • • • 2M• • •
flGU11
TlST
I
I 1 _...
I.
VI
4
0
· 0
0
•
• • •
.. ~.
o
TAIOIT
I
0
4
•
TIST I
; I
I
....... I
TlMI._.
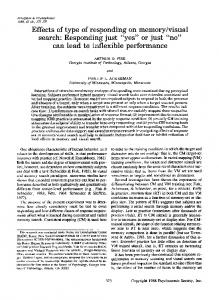
Figure 1. Two examples of the taJget and test displays seen by the subject, with a representation of the sequence of events on a trial. Upper panel: description test condition. Lower panel: visual figure test condition. The correct response is negative in the end-point condition, since the test item terminates at a point I SE from the start, while the taJget was 2 SE. The correct response is positive in the list-membenhip condition, since the test item includes the tuget item, 2 SE. On alternate blocks of trials, the subject engaged in an end-point task or in a list-membership task. In the end-point task, the subject decided whether the target item, interpreted as a point in the dot matrix, corresponded to the end point of the test item ftgure. When the test item was the written description of a ftgure, the subject had to calculate whether the described ftgure terminated at the point designated by the target item, while, when the test item was a visual figure, the subject could examine it directly. In the list·membership task, the subject determined whether the target vector was a component of the test item (line segments or description). When the test item was a list of symbols, a visual scan was sufficient to make the decision. However, when the test item was a visual ftgure, it was necessary for the subject to represent the target item and the vectors of the visual figure in a common mode (possibly by transforming the target item into a visual line segment or the segments of the test ftgure into their verbal labels) and compare them. In either task reaction time (Rn from the onset of the test item was measured to the nearest millisecond. One-third of the test items contained three line segments or symbols designating line segments, one-third contained four, and one· third contained five. One half of the test items was presented as visual figures and one half as symbol lists. Finally, half of the test items required a positive response and half a negative response. Each of the 12 combinations of these three variables occurred at three randomly chosen times in each block of 36 trials. At the start of each block, the subject was informed whether it would be an end-point or a list-membership block and, at the end of each block, he was informed of his mean RT and total number of errors.
RESULTS
Description/End-Point Task The mean RTs of correct responses and error percentages are presented in Figure 2. The data from
the description/end-point condition appear in the upper left-hand panel of Figure 2. These RTs increase linearly with the number of segments, F(2,8) = 43.17, MS e = 1,096,456, P < .01, indicating serial processes of constructing a mental image from a description, segment by segment. Presumably, the subject encodes the target as a point on the grid during the time the target is presented. When the test description is presented, he serially encodes each directional symbol, transforms it into a directed line segment, and adds the line segment to the starting point or the end of the previous line segment. The subject then determines whether the last line segment ends at the grid point represented by the target and responds accordingly. Under this process, the slope of the straight line fitted to the data, 1,087 msec/symbol, is the time taken to encode, transform, and add a single line segment and, thus, is an upper bound on the time needed to transform a verbal symbol into a mental image. One question of interest is whether it takes longer to generate an image of a long line segment than of a short line segment. To examine this question, the data were divided on a post-hoc basis into RTs to descriptions with a majority of elements deSignating line segments two units long (large figures) and descriptions with at least half of the elements designating one-unit segments (small figures). There was no evidence that it took longer to draw a long mental line segment than a short one; the slope of the function relating RT to number of symbols was 1,003 msec/symbol for
b. . . l
LIST MEMBUSHIP
END 'OINT DESCIIPTION
DESCR !PTlON
1300
1100
··O
900
0-
700
1"
.•" E
:;' 1100
..
5
POSIT'VE
•
NfGATlVI"""""-'
GI: GI:
C)
U
.00
. .. .
--~. ---:l
:r
3
•
5
GI:
."P
1100
I." I. d
0'·'
500
... ... ...cz ... ...
LlST/f~J~::ISHIP
1500
OIl
LIlLo
1300
700
15
10
"
0- --0
•1)
END POINT flGlJ1E
00
900
t
3
•
A.
~"
.0 5
5
NUMBER OF SEQMENTS
Figure 2. Reaction time as a function of number of segments in the test item, with percentages of miss and false aJarm errors. Note that the ordinate scales differ among panels.
CONSTRUCTING VISUAL IMAGES large figures and 1,172 msec/symbol for small figures, F(2,8) < 1. Visual Figure/End-Point Task Quite different results were obtained in the visual figure/end-point condition (lower left panel of Figure 2). Here, RT was not affected by the number of segments of the test figure. Presumably, subjects encoded the grid point designated by the target item during its presentation and simply determined whether the test figure terminated at this point when it was presented. Description/List-Membership Task The description/list-membership condition, whose results appear in the upper right-hand panel of Figure 2, is a visual search task. Reaction time increased as a function of the number of symbols in the test item, F(2,8) = 32.35, MS e = 22,112, P < :001, and was greater for negative than for positive responses, F(I ,4) = 25.59, MS e = 34,715, P < .01. The increase in RT with number of symbols was also greater for negative than for positive responses, 184 vs. 82 msec/ segment, F(2,8) = 19.53, MS e = 5,304, p < .001, a difference which suggests self-termination of the scan on positive response trials. Such an interpretation is supported by the serial position curves presented in the right-hand panel of Figure 3. Positive RT increases linearly with serial position, at a rate of 123 msec/ position, with only a very small effect of number of symbols in the test item. Visual Figure/List-Membership Task The final data come from the visual figure/listmembership condition and appear in the lower righthand panel of Figure 2. Here, RT increased with number of segments, F(2,8) = 31.72, MS e = 45,233, p < .01, but the increase did not differ between positive and negative trials, F(2,8) = 2.49, MS e = 67,694, p> .10, 178 and 201 msec/segrnent, respectively. The serial position curves appear in the left-hand panel of Figure 3. Reaction time did increase from tests in which the first segment was that denoted by the targets to tests in which the other segments matched the target, but these latter RTs did not differ. It appears that subjects were able to terminate. immediately when the first segment matched the target but performed an exhaustive search otherwise. DISCUSSION Image Generation Subjects seemed to construct an image of a symbolically described geometric form by serially transforming each symbol into a line segment. One could question whether the constructed image can be considered to be a "true" visual image, or whether one should emphasize its kinesthetic or motor components. Subjects did report extensive eye movements in the end-point condition, which would seem to support the importance of such components. One could study the visual
1600
,,: ........ t.
~
~~
"..'.
,i ..... .....
12
.-5
.~
3
¥
•E
..: ~
900
•
:,'
4 I
DESC.IPTION
VISUAL FIGURE
, 5
I
:j ~/
10.0
•"
700 600
1"
587
I
2
I
3
I
4
I
5
1:
I
2
I
3
I
4
I
5
SERIAL POSITION Figure 3. Reaction time for positive responses as a function of serial position, for visual ftgUre and description tests in the end-point condition. nature of the constructed images by determining whether phenomena which have been observed with presented images are also observed without them (cf. Cooper, in press; Kosslyn, in press; Shepard & Chipman, 1970; Shepard & Metzler, 1971). The time to encode and transform a symbol into an imagined line segment was 1,087 msec, a great deal longer than the 184 msec taken to encode and compare a visual symbol against a memorized symbol, as measured by the slope of the negative response function in the description/list-membership condition. The magnitude of the difference between these timps suggests that most of the 1,087-msec encoding plus transformation time is spent in constructing an image of the line segment designated by a symbol. Transformation time from verbal to visual segment was not affected by the length of the line segt¥nt to be generated. In addition, the time it took to generate a single line segment in the present experiment was similar to estimates of the time to generate a mental image of a letter (Weber & Castleman, 1969), a much more complicated image. These findings suggest that the time taken to generate a unitary mental image is not a function of its size or its complexity. One suspects, though, that the time taken to construct a mental image is not a constant for all images. In fact, in the present experiment the time to construct a nonunitary (segmented) image corresponding to a verbal description increased as a function of the number of its segments, and it may prove to be the case that such attributes of images as complexity, dimensionality, and amount of detail do in fact influence generation time. Visual Search The list-membership conditions in the present experiment were intended to study potential visual-to-verbal recoding processes. It was thought (cf. Cruse & Clifton, 1973) that subjects presented with a visual figure/list-membership test might have serially transformed each line segment of the test figure into its name and compared that name against the target symbol, while on a description/list-membership test they might simply have compared each test symbol against the target symbol. In thls case, the slope of the RT function would be
588
CRUSE AND CLIFTON, JR.
greater in the visual figure condition than in the description condition, and the difference in slope would be taken as an estimate of the time to name a single line segment. The data do not yield to such a simple interpretation. Search seemed to be self-terminating in the description condition, while self-termination in the visual figure condition was possible only when the fust segment of the test figure matched the target. Further, the search rates, estimated from the RT functions for negative responses, were quite similar in the two conditions, 184 vs. 201 msec/item. The similarity of the search rates for the two list-membership conditions (visual figure and verbal description) suggests that the target and test item information in both conditions may be transformed into more abstract codes which are more similar to each other than the original surface codes. The relatively long search rates (compared to 25 msec/letter found by Atkinson, Holmgren, & Juola, 1969), lend some support for this explanation, in that previous research (e.g., Cruse & Clifton, 1973) has shown that transformations tend to increase search rate. An alternative explanation for the slow search rates is the relatively high similarity and complexity of the elements making up the test items (Neisser, 1964). An additional explanation is needed for the self-terminating search observed in the description condition. Visual search of short lists for a single target has generally been found to be exhaustive (e.g., Atkinson et aI., 1969). However, the slow search rate found with the materials of the present experiment may make a self-terminating strategy advantageous. In this case, the problem is to explain why search was both slow and exhaustive in the visual figure condition. A possible reason is that the test item in this condition was presented as a single figure rather than as a list of unconnected elements and, thus, there were no natural "stopping points" before the end of the figure. This hypothesis could be tested by comparing visual search of unconnected line segments with visual search of the figures used here. The hypothesis would imply a self-terminating search in the former case, but not in the latter.
REFERENCES ATKINSON. R. c., HOLMGREN, 1. E., & JUOLA, 1. F. Processing time as influenced by the number of elements in a visual display. Perception & Psychophysics, 1969, 6, 321·326. BOWER, G. H. Mental imagery and associative learning. In L. W. Gregg (Ed.), Cognition in learning and memory. New York: Wiley, 1972. COOPER, L. A. Mental transformations of random two· dimensional shapes. Cognitive Psychology, 1975, in press. CRUSE, D., & CLIFTON, c., JR. Recoding strategies and the retrieval of information from memory. Cognitive Psychology, 1973,4,157·193. KOSSLYN, S. M. Information representation in visual images. Cognitive Psychology, 1975, in press. MOORE, T. V. The temporal relations of meaning and imagery. Psychological Review, 1915,22,177·215. NEISSER, U. Visual search. Scientific American, 1964, 210, 94·102. PAIVIO, A., & BEGG, I. Imagery and comprehension latencies as a function of sentence concreteness and structure. Perception & Psychophysics, 1971, 10,408-412. POSNER, M. I. Coordination of internal codes. In W. G. Chase (Ed.), Visual information processing. New York: Academic Press, 1973. SHEPARD, R. N., & CHIPMAN, S. Second·order isomorphism of internal representations: Shapes of states. Cognitive Psychology, 1970. 1, 1·17. SHEPARD, R. N.. & METZLER, 1. Mental rotation of three. dimensional objects. Science, 1971, 171. 701·703. WEBER, R. J., & CASTLEMAN, J. The time it takes to imagine. Perception & Psychophysics, 1970, 8, 165·168.
NOTE 1. The task to be used is similar to one suggested by Bower (1972), who attributes it to Lee Brooks. (Received for publication August 28. 1975.)