Memory & Cognition 2002, 30 (8), 1179-1188
Generating visual mental images: Latency and vividness are inversely related AMEDEO D’ANGIULLI and ADAM REEVES Northeastern University, Boston, Massachusetts In three experiments, participants pressed a reaction time key and rated vividness after reading descriptions of common objects and imagining them as accuratelyas possible within a visual display subtending 1.2º or 10.8º. Display size had small effects on vividness and on image latency. Latency was much faster (~2.5 sec) for vivid images than for nonvivid ones (~7.5 sec), regardless of display size and initial size at which the images were generated (natural image size). Our findings characterize images as (1) detailed, as indicated by ratings of detail and by lack of category membership effects; (2) as occurring at many natural image sizes, so that time-consuming size adjustments are typically not needed; and (3) generated not concurrently with but after lexical access, as shown by latencies for the same image evoked by synonyms like pail and bucket. We conclude that image vividness and latency reflect the activation level of the visual imagery system, implying that image generation in everyday life mostly involves retrievingalready-computed representations episodically stored in memory, which seldom require extensive re-elaboration such as size adjustment.
Size has been an important variable in imagery research in that the similarity between imagery and visual perception has been often studied measuring the time required to generate or adjust mental images at certain test sizes (for reviews, see Finke, 1989; Kosslyn, 1980, 1994). Another variable that illustrates the similarities between imagery and perception is vividness—that is, the richness of sensory information contained in the representations from which images are generated (Baddeley & Andrade, 2000). Participants easily understand vividness rating requirements, and they rate vividness of percepts similarly to vividness of mental images (Giusberti, Cornoldi, De Beni, & Massironi, 1992). Unlike size, vividness has seldom been used to directly test assumptions and predictions of current models of visual imagery (see Pearson, 1995, for discussion). This study examined the effects of vividness and the effects of image size on the latency of image generation (image latency), testing two competing hypotheses that incorporate vividness, as well as size, as essential components of imagery. The first hypothesis, the buffer hypothesis, derives from Kosslyn’s work and proposes that the size at which an
This study is an extract from a thesis presented by A. D. in partial fulfillment of the requirements for the PhD degree from Northeastern University. Portions of this paper were presented at the sixty-ninth annual meeting of the Eastern Psychological Association, Boston. We thank Derek Jensen and Sarah Jones for help with the collection of the data. A. D. is grateful to Sean Allen for programming assistance. Finally, we thank Colin MacLeod, Tim McNamara, Jack Baird, Stuart McKelvie, and Beverly Roskos-Ewoldsen; their suggestions have greatly helped in improving this manuscript. Correspondence should be addressed to A. D’Angiulli, University of British Columbia, Biobehavioural Research Unit, Children’s and Women’s Health Centre of British Columbia, 4480 Oak St., Vancouver, BC, V6H 3V4 Canada (e-mail:
[email protected]).
image is generated influences image latency as well as vividness. Kosslyn (1975) found that although size does not influence image latency in all circumstances, the latency of images of single named animals increased with image size when the area of the display where the images had to be “projected” was varied and participants were asked to keep their images equally vivid. Kosslyn also established that more time is required to visualize properties of subjectivelysmall, as opposed to large, images, because the locations of more parts of the image can be “seen” at larger sizes. Kosslyn’s findings imply that some “foundation parts” need to be represented (e.g., foot of the cat) before a detail (the claws) can be added. If the object is imagined so small that one cannot appropriately represent a part in which a given detail belongs, then one cannot add and discriminate that detail in the image, and therefore the image will be perceived as nonvivid. If vividness depends on the discriminability of the imaged parts (see especially Kosslyn, 1980, p.184), then larger images should be more vivid and relatively slower to construct than smaller images. According to Kosslyn, a global, schematic image (“skeletal image”) should be first primed in associative memory and then transferred to a “visual buffer,” the working memory structure in which parts and fine details of the image can be added and resized (see Kosslyn, 1994, chap. 9). Because processing increases with the space consumed in the buffer, larger objects should require more time to visualize, but, being filled out with more details, image quality should improve as well (Pearson, De Beni, & Cornoldi, 2001). As an illustration, consider the following “mental TV” metaphor: We have a mental screen in which images can be resized, zoomed, and edited to achieve the best image quality, but time consumption is directly related to adjusting these “settings.” Thus, as suggested by
1179
Copyright 2002 Psychonomic Society, Inc.
1180
D’ANGIULLI AND REEVES
the metaphor, vividness should increase with size and image latency. An alternative hypothesis, the activationhypothesis, derives from Finke’s work and proposes that the processing systems that are normally activated by perceptual input can also be activated by visual image generation, and that the magnitudeof activationshould be related to the subjectively reported vividness.Accordingly, “the more vivid the image, the more strongly these mechanisms would respond” (Finke, 1980, p. 130). Evidence that the richer the visual contentin the image, the greater the degree of activationhas been collected by Finke and Schmidt (1978), who found that McCulloch effects induced by imagery were more pronounced in participants who experienced very vivid imagery. These results were confirmed by Harris (1982) and partially replicatedand extendedby Kunen and May (1980). In addition,image latencies are shorter in participants classified as high imagers (review in Cocude & Denis, 1988). Thus, vividness may reflect the level of activation of the visual memory system, and image generation speed may be related to that activation, resonating the adaptive principle that some visual mechanisms react more quickly to more intense or more informative stimulation (Coren, Ward, & Enns, 1994). The activation hypothesis is best exemplified by the “mental gallery” metaphor: We have a mental gallery of past visual experiences includingseveral views of same objects at different sizes. Better visual quality affords more efficient and quicker image retrieval. The key prediction that follows is that as vividness increases, image latency should be shorter, but size should not affect image retrieval. In short, the buffer and activationhypotheses predict that image latency should increase (buffer) or decrease (activation) with vividness, that image latency should increase with size (buffer) or be unrelated to it (activation), and that vividness should increase with size (buffer) or be fairly independent of size (activation). Experiment 1 was designed to test these predictions. EXPERIMENT 1 Experiment 1 was a generalization of an experiment reported in Kosslyn (1975). The critical variables were display size and vividness. Display size was manipulated between subjects: Participants were asked to “project” their image within a small or a large square. Vividness ratings for each generated image were obtained from all participants. The dependent variable was image latency. We chose images corresponding to verbal descriptions at both basic and subordinate levels (Rosch, Mervis, Gray, Johnson, & Boyes-Braem, 1976) to test an additional idea. For the activationhypothesis, category level should have no effects, because concreteness and frequency but not category level are the most critical variables in Paivio’s (1986) dual coding theory. For the buffer hypothesis,being less detailed visually, basic level images might be quicker and less vivid. As in Kosslyn (1975), participants were asked to generate images from verbal descriptions and to respond when they had done so. However, whereas Kosslyn did not mea-
sure vividness directly, we asked our participants to rate the vividness of their images. Explicit imagery instructions were given, because these seem to efficiently and reliably ensure that participants generate images (Kosslyn, 1976; Mathews, Hunt, & MacLeod, 1980; Olseth & Barsalou, 1995). Method Participants. Participants were randomly assigned to three groups: the experimental imagery group and two control groups (noimagery group and detail judges). Seventy-four undergraduate students participated in the imagery experiment in exchange for course credit. All participants could form images, 71 without difficulty and 3 after a few attempts. Seven additional candidates were excluded from the study: 2 candidates were unable to evoke images, 2 candidates did not follow instructions during practice, and another 3 candidates completed the experiment in less than 5.5 min (pilot experiments showed that completing a buttonpress with a 5-sec intertrial interval (ITI) for 60 stimuli required at least 5.5 min, on average). A control no-imagery group (n = 12) read the description presented on each trial as quickly as possible and then responded after comprehending it. Finally, 5 judges were asked to form images of our stimuli, receiving same instructions as the imagery group, and to rate the amount of detail of their images from 1 (no detail ) to 7 (all details of the object). Kendall concordance coefficient of amount-of-detail rating was .49 [ x2(4) = 116.5, p , .0001, n = 60]. Stimuli. In pilot work, we identified 60 descriptions from Paivio, Yuille, and Madigan’s (1968) database that had approximately the same vocabulary frequency, imageability, and concreteness values (with imageability and concreteness values . 5.0). The descriptions selected included animate (e.g., cat, elephant) and inanimate (e.g., bottle, refrigerator) objects; in corresponding images from a pilot group, mean detail and vividness ratings correlated (r = .80). We used descriptions belonging to basic-level and subordinatelevel categories as defined by Rosch et al. (1976) and Jolicœur, Gluck, and Kosslyn (1984). Half of the descriptions selected as stimuli were basic-level nouns, but we could not find the exact category level of the other half, so we added qualifiers such as your to allow more objectspecific properties for the description and to obtain subordinatelevel stimuli. The number of attributes (i.e., functional or structural parts of the objects) most commonly reported by pilot participants imagining these stimuli was higher for the basic-level than for the subordinate-level category ( x2 = 34.66, p , .001), showing that our categories were consistent. Our stimuli are available upon request. Procedure. Participants were instructed to read silently the description of an object, presented 250 msec after an alerting beep in each of the 60 experimental trials, and to imagine the object with their eyes open. Half of the participants projected the image in a small frame (1.2º) and the remainder in a large frame (10.8º), the same display sizes as in Kosslyn (1975). The frames were drawn as black outline squares and were displayed on a white Macintosh screen set at medium illumination. As soon as participants had formed a complete image of each object, they were to press a mouse button (the keypress defining the image latency). Four seconds after the buttonpress, a horizontal array of seven buttons appeared at the bottom of the screen below the large (small) square. From left to right, each button was labeled with seven vividness level descriptions (i.e., no image, very vague/dim, vague/dim, not vivid, moderately vivid, very vivid, perfectly vivid); henceforth we equate these descriptions to Levels 1–7. The participants had to rate their image by clicking on one of the buttons. There was no deadline for the rating response. Valid trials were defined by ratings on vividness level . 1. Participants were instructed to rate with 1 failures to imagine as per instructions (e.g., not having images at the specified size). The descriptions were presented in random order with a minimum ITI of 5 sec to minimize imagery persistence between trials (Craver-Lemley & Reeves, 1987).
857.36 1,044.34 2,591.09 3,125.01 1,192.90 1,683.95 60 60 48 46 Small Large
7,192.46 9,434.91
5,611.66 6,244.22
54 47
5,969.13 6,020.67
3,200.13 3,923.90
55 56
5,389.20 5,779.33
By Items 3,332.94 2,876.89
5,171.89 4,990.90
1,738.36 1,914.44
60 60
3,898.80 4,447.92
59 60
2,885.41 3,021.40 3,342.48 3,248.90 3,121.48 3,339.03 3,582.61 4,467.66 4,836.42 5,165.52 37 37 25 23 Small Large
5,767.57 5,856.73
5,524.87 4,086.72
29 29
5,500.23 6,156.95
4,682.39 6,707.57
32 34
By Subjects 5,043.03 4,121.46 5,617.59 4,500.62
RT n SD RT n SD n Display Size
RT
37 36
4,125.31 4,150.31
32 32
7 RT n SD 6 RT n SD 5 RT SD
n
Vividness Level 4 3 2
Table 1 Mean Reaction Times (RTs) and Standard Deviations of Image Latency Plotted Against Vividness Ratings in Small (1.2º) and Large (10.8º) Display Conditions
SD
GENERATING IMAGES
1181
Participants were instructed to imagine the objects with the same size as the square boxes, stationary, as if seen in the frontal plane. To make sure, the instructions included clear outline drawings shown as examples. Participants were asked to consider their image as “complete” or “finished” as soon as they could not notice improvements in clarity and detail (see Cocude & Denis, 1988). Prior to the experiment, participants were familiarized with the vividness scale and then given 10 min of practice with other stimuli in both size conditions. Between trials, the participants had to report whether they could control each image; only participants who reported satisfactory control over their images in 80% of the practice trials qualified for the entire experiment. Latencies over 30 sec were discarded as outliers, which resulted in a 3% data loss. The participants were tested individually. Neither the experimental nor the control groups were told that their manual responses were being timed.
Results and Discussion Table 1 shows mean image latencies by subjects and by items as a function of vividness level, for valid trials (i.e., vividness . 1). In the analysis by subjects, a 2 3 6 (display size 3 vividness) mixed-model analysis of variance (ANOVA) revealed an effect of vividness [F(5,175) = 6.31, MSe = 4,922,107.28, p , .001] but no effect of display size [F(1,35) = 0.38, MSe = 97,876,009.11, p = .57, h 2 = .01] and no interaction [F(5,175) = 0.79, MS e = 4,922,107.28,p = .56]. For each display size condition,we ran repeated measures polynomial contrasts testing for negative linear trends (adjusted for unequal ns as in Rosenthal and Rosnow, 1988). The contrasts were significant for both display conditions [large: F(1,35) = 23.62, h 2 = .40; small: F(1,35) = 16.76, h 2 = .32; for both: MSe = 7,295,834.53,p , .001]. Thus, image latency was inversely related to vividness level. The item analysis was based on the same type of procedures used in the analysis by subjects. Again, the mixedmodel ANOVA revealed an effect of vividness [F(5, 365) = 25.50, MSe = 10,424,165.84, p , .001] but no effect of display size [F(1, 365) = 3.05, MSe = 10,541,709.93, p = .08, h 2 = .04] and no interaction [F(1,73) = 1.98, MSe = 10,541,709.93, p = .08]. Again, polynomial linear contrasts showed that image latency was inversely related to vividness[large: F(1, 73) = 61.31, h 2 = .47; small: F(1,73) = 38.69, h 2 = .35; for both MSe = 15,997,564.47,p , .001]. Because the ANOVAs had unbalanced cells and thus violated the normality assumption, they needed to be confirmed by further analyses. Therefore, we examined the reaction time (RT) distributions directly, using robust regression with weighted least-squares estimation (Hoaglin, Mosteller, & Tukey, 1983). Preliminary analyses (reported in D’Angiulli, 2001) showed that (1) repeated observations per person were weakly correlated, and (2) in each vividness level, vincentizeddistributionsdid not differ appreciably from the empirical RT distributions with aggregate related observations. Consequently, we could treat related observations as independent, because given these conditions the “robust” variance estimate can be used to draw valid inferences about regression parameters even though the underlying correlation in the data is misspecified (Diggle, Liang, & Zeger, 1996).
1182
D’ANGIULLI AND REEVES
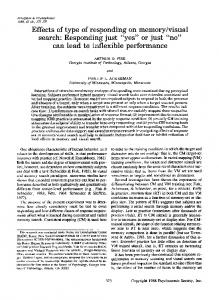
Figure 1. Distributions of image latencies for the 1.2º-display at six levels of vividness.
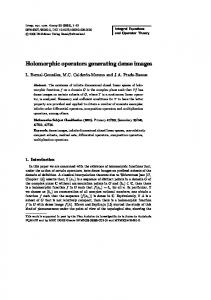
Figures 1 and 2 show the distributions of image latencies, in small and large display conditions, plotted at each level of vividness. The distributions of image generation times as plotted in histograms with bin size of 1 sec can be fitted by an ex-Gaussian—that is, the convolution of an exponentialwith a Gaussian. The assumption of the exGaussian model is that RT is the sum of two other random variables, one distributed as a Gaussian and one distributed as an exponential (Luce, 1986). Because the data are distributed as an ex-Gaussian, we conclude that the exponential reflects time to retrieve images from memory (Ratcliff, 1978). Here, we equate “retrieving images from memory” to “image generation.” Figure 3 summarizes the results of fitting by plotting the parameters against the level of vividness. The expo-
nential parameters of the ex-Gaussian fits to the RTs are presented together with the means of the Gaussian component. Each vividness level was fit separately. For comparison, Figure 4 also shows the parameters of the exGaussian fits to the RTs of the control participants who read the descriptions, broken down by vividness. These RTs were obtained by first binning (bin size: 1/10 sec) the descriptions according to the mean vividness ratings obtained from the experimental participants, and then summarizing the control participants’ reading latencies bin by bin. Standard deviations of the Gaussian components were all constant at ~ 1 sec. The fitting confirmed the inverse relation between vividness and latency. It also showed an effect of display size (250 msec, on average).
GENERATING IMAGES
1183
Figure 2. Distributions of image latencies for the 10.8º-display at six levels of vividness.
Figure 3 shows that the means of the Gaussian component for image generation are larger than the means of the Gaussian components obtained in the reading control experiment, in which imagery was not required. In the reading (no-imagery) condition,the ex-Gaussian distributions approximated skewed normal distributions (in which the Gaussian dominated the exponential component). Consequently, we conclude that the Gaussian component for the image latencies does not reflect just the reading and motor response components but, presumably, also decision and other intervening processes (i.e., selection and memory search) that precede the actual access of sensory contents in the images. Additional item analyses were conducted. In the first set of analyses, for each of the 60 descriptions, mean reading times obtained from the control participants were regressed onto the image latencies obtained from the exper-
imental group, yielding a modest correlation for the small display (r = .35, p , .01, n = 60) and for the large display (r = .50, p , .001, n = 60). Next, we examined whether there was any effect of stimulus category on image latencies and reading latencies. Two separate 2 3 2 ANOVAs (display size 3 category level) failed to indicate significant effects (F , 1). Finally, the amount of image detail, averaged across judges for each stimulus, was highly correlated with mean vividness level, whether separately for each display condition or collapsed across the two display conditions, with a correlation coefficient of .82 ( p , .01, n = 60). Similarly, the amount of detail of the stimuli was negatively correlated with mean image latency (median r = 2.31, p , .05, n = 60), but partial correlations controlling for vividness were all close to 0 (median r = .03) indicating that the effect on latency was due entirely to vividness.
1184
D’ANGIULLI AND REEVES
Figure 3. Exponential and Gaussian components of the exGauss convolution plotted as a function of different levels of vividness. Triangle symbols (bottom) permit comparison with the normal distributions of reading times. Note—Ex-Gaussian fit yielded r 2 . .80 for all vividness levels; the sequential quadratic programming algorithm was run with 1,000 iterations, infinite step size = 1E 1 20, step limit = 2, optimality tolerance = 1E 2 10, precision = 1E 2 20. Robust regression was based on Ramsay’s weighting function (see Hoaglin, Mosteller, & Tukey, 1983).
From our findings it can be concluded that (1) vividness is inversely related to image latency;(2) the effect of display size on image latency is small relative to the vividness– latency relation; (3) one of the components of image generation is lexical access via reading, but this component accounts for little of our data; and (4) stimulus category (basic/ subordinate)has no relation to image latency. The amount of detail is related to vividness but not to image latency. The finding that greater vividness is associated with greater speed of image generation supports the activation hypothesis in that it shows that higher vividness ratings reflect higher activation and faster generation times. The lack of effect of display size and category membership suggests that to generate images our participants retrieved detailed visual information about objects episodically stored in memory without performing major manipulation or elaboration in a visual buffer; this idea was the focus of the following experiment.
at a default size (natural size). Successively, the natural image size will be edited or manipulated so that the image is resized to “fill out” the display. Assuming intermediate steps between natural size and display size implies that additional time will be spent in resizing the image and that the amount of additionaltime should be directly related to the amount of size disparity (Cave & Kosslyn, 1989). In contrast, the activation hypothesis posits that, from your mental gallery, you can pick one of your past views of your mother’s face at the appropriate size and retrieve images at different sizes equally rapidly, but the disparity between natural size and display size should be inconsequential. The assumption is that activation is related to past visual experience and that typically visual images are stored episodically according to retinal image size rather than to distal stimulus size (e.g. Rock, Shallo, & Schwartz, 1978). Thus, if one has experienced an object at many different distances and so seen it—and stored it—at many different sizes, then natural sizes should be retrieved at relatively similar rates, which should be independent of activation level. Experiment 2 focused on (1) the relation between natural size and image latency, and (2) the relation between natural size and vividness. We first determined the natural sizes of the images corresponding to the descriptions used in Experiment 1 by asking new participants to indicate “the size of the first images that came to their mind.” We then related these natural sizes to the generation times found in Experiment 1. If the buffer hypothesis is correct, the natural sizes should be directly related to image latency. In contrast, if the activation hypothesis is correct, the natural sizes should have no relation with image latency and no relation with vividness level. Method Participants. Eighteen new undergraduate students participated in the experiment in exchange for course credit. Stimuli. The descriptions used as stimuli were the same as in Experiment 1. Procedure. Participants were asked to stand in front of a 124 3 124 cm white square board and imagine the verbal descriptions as they were read by the experimenter one at a time. The participants were asked to project their first image on the board at a fixed distance of 60 cm. Once the participants had a clear and complete image (see instructions for Experiment 1), they had to point to the extreme of the largest horizontal or vertical side of the image with both index fingers. Participants had no deadline. The experimenter measured the distance between the index fingers. The white board was matched as closely as possible with the color and luminance of display used in Experiment 1. The stimuli were presented aurally in random order. The experiment was repeated for two blocks and was preceded by practice with the 10 stimuli used in Experiment 1. During practice, it was stressed that the participants had to consider the very first image that came into their minds.
EXPERIMENT 2 Suppose you are asked to visualize your mother’s face, “projecting” and fitting your image onto a display of a given size. The buffer hypothesis posits that initially a working version of your mother’s face will be constructed
Results and Discussion The natural image sizes measured in Blocks 1 and 2 of Experiment 2 were averaged per stimulus and transformed to degrees of visual angle; the test–retest reliability was r = .98 ( p , .001, n = 60). The natural image sizes ranged
GENERATING IMAGES
1185
Figure 4. Mean reaction times (RTs) for generation of low vividness (top left panel) and high vividness (top right panel) images of Experiment 1 are plotted against six groups of natural image sizes obtained in Experiment 2. Bottom panels: Mean vividness ratings (from Experiment 1) plotted against six groups of natural image sizes (from Experiment 2).
from 4.5º to about 62º. Kosslyn (1978) obtained a roughly comparable range, 13º–50º, with other images. There was a weak and nonsignificant relation between generation times and natural size of the images, even when the analysis was split as a function of vividness level. Regression analysis yielded correlation coefficients close to 0.15 (n.s.). Regressions of vividness onto natural size yielded coefficients close to 0. The natural sizes were then grouped into six bins approximately containing the same n and the same interval size (the six closed intervals were: 4.5º–10.5º, 10.6º– 17.5º, 17.6º–33.5º, 33.6º–44.5º, 44.6º–55.5º, 55.6º–62º) to conduct trend analysis through polynomial contrasts. For each bin, the means and standard errors were found for the RT obtained in Experiment 1 for the same images and were plotted against the midpoints of the corresponding bin. To check whether the null outcome was due to uncontrolled variations in vividness, this analysis was split according to low vividness (ratings from 1 to 4) and high
vividness (ratings from 5 to 7) for both display conditions to roughly equate ns. Figure 4 shows the mean RT in the small and large conditions for low-vividness and highvividness images at each of the six bins (top panels). The data for the small- and the large-display conditions show no relation to the latency of generation. The bottom panels show that vividness was approximately constant for each natural size, so these results do not depend on vividness either. Experiment 2 improved on some of the image research. In earlier studies (e.g., Kosslyn, 1975), the natural sizes and vividness of the images were not actually measured; it was just assumed that the images were equally vivid and that natural image sizes were proportional to real object sizes. The outcomes of Experiment 2—no relation between natural image sizes in memory and generation times, as well as independencebetween naturalimage size and vividness— are in line with the activation hypothesis. The findings support the tenets that (1) we possess multiple images of
1186
D’ANGIULLI AND REEVES
objects at different sizes that are retrieved equally rapidly, and that (2) vividness and size are independent in relation to image generation. EXPERIMENT 3 In Experiment 1, we found a relation between image and reading latency. The purpose of Experiment 3 was to clarify the extent to which imagery and reading overlap, because considerable overlap may imply that, in Experiment 1, reading and lexical access might have played the most important role, not imagery. We examined total image latencies studying two factors. One factor—word length— was assumed to be selectively involved in reading and lexical access, and the other factor—display size—was assumed to be selectively involved in imagery. As in Experiment 1, display size was manipulated between subjects to reflect processes involved in generating small and large images. However, in Experiment 3 all participants were asked to read synonyms of different length and form identical images for long versus short synonyms (within subjects). The latter manipulation should affect reading because long synonyms should be read more slowly than short ones, but it should leave image generation unaltered because the image corresponding to each pair of synonyms would be identical. If during reading we activate the names of the objects via a common representation with image generation, word length of the synonyms and display size should influence at least one processing stage in common, so that each factor modulates the effect of the other (see, “interaction,” Sternberg, 1998). In contrast, if reading and imagery are independent, word length of the synonyms and display size should influence no stages in common, so that the effect of one factor on the total image generation latency is invariant over the levels of the other factor (see “effect invariance” in Sternberg, 1998). To find evidence of effect invariance, we analyzed image latencies in two ways. First, we ran a 2 3 2 ANOVA (synonym length 3 display size) expecting that if each factor has an invariant effect over the levels of the other, then there should be main (additive) effects and no types of interaction (Sternberg, 1998). The second analysis assessed two other aspects of effect invariance—namely, whether the difference between the two levels of synonym length was related to the difference between the two levels of display size, and whether the slope of such a relation was different from zero. Confirmation of both aspects would be evidence of serial stages (Sternberg, 1969) in which reading precedes imagery. Method Participants. Thirty-six undergraduate students were randomly assigned either to the small- or the large-square condition (see Experiment 1). A control group of 32 participants was assigned to a reading-without-imagery condition. Stimuli. The nouns used as stimuli were eight pairs of synonyms, including seven pairs of common objects and one pair (wizard– sorcerer) with comparable concreteness and imageability value (all
stimuli had high concreteness and imageability values with norms . 5 in the MRC Psycholinguistic Database; Wilson, 1987). These words were grouped into two categories of word length (long or short) depending on item-by-item comparison within each pair (short–long synonym pairs: box–carton, TV–television, car–automobile, pail–bucket, glasses–spectacles , rug–carpet, wizard–sorcerer, and mug–coffee cup). Word frequency was determined for both sets of synonyms on the basis of three published norms (KuÏcera & Francis, 1967; Thorndike & Lorge, 1944; Wilson, 1987). No reliable difference was found between paired long and short synonyms. The stimuli of Experiment 1 were used as distractors and were intermingled with the list of synonyms in a block of 76 trials. The presentation order was semirandom in that the order of occurrence of the synonyms for each pair was counterbalanced across synonym length. Procedure. The same procedure as Experiment 1 was used. However, to make sure that the paired stimuli would actually be considered synonyms, the participants were informed that among the stimuli there were equivalent labels for the same objects. Accordingly, they were invited to pay attention and visualize the same object that they had initially imagined if a synonym was successively presented. Since alerting the participants to attend to a certain stimulus may increase cognitive arousal during image generation (Cocude & Denis, 1988; Kerr & Neisser, 1983) and lower response threshold, we expected image latencies in this experiment to be faster than those in Experiment 1. Pilot data indicated that, for each pair, the images corresponding to the synonyms did not differ with respect to vividness, category, or detail levels.
Results and Discussion A 2 3 2 mixed-model ANOVA (synonym length 3 display size) was first conducted on the participants as random variable, and then on the mean RTs computed for each individual synonym under each display size condition; that is, the synonyms were the “participants.” Both analyses yielded identical results. Synonym length was the within-subjects factor (short and long) and display size was the between-subjects factor (1.2º or 10.8º). There was a main effect of display size [F(1,14) = 9.4, MSe = 101,248.82, p , .01] but no main effect of synonym length [F(1,14) = 1.09, MSe = 109,511.76, p = .31] and no interaction [F(1,14) = 3.16, MSe = 109,511.76, p = .10]. As compared with the images of short synonyms, the images associated with the long synonyms were delayed by 77 and 45 msec in 1.2º and 10.8º, respectively. Lowered response threshold and the consequent fast image latency rate may be responsible for the attenuation of length effects; indeed latencies in Experiment 3 were generally faster than those in Experiment 1 [~2.5 sec, on average]. An analysis of the reading latencies obtained from the control group also showed that mean reading latency was on average considerably faster than mean imagery latency [mean difference: 1,824 msec, t (31) = 28.3, p , .001] and that short synonyms were read significantly faster than long ones [mean difference: 123 msec, t (31) = 4.20, p , .001]. These findings suggest that reading and imagery have independent effects. For each of the eight pairs of synonyms, we calculated the difference between long and short synonyms in mean image generation time (image latency difference) and mean reading time (reading latency difference). Consequently, we regressed the image latency difference onto
GENERATING IMAGES
Figure 5. Mean image latency difference versus mean reading latency difference between long and short synonyms for the eight objects imagined in Experiment 3. Note—b0 = 281.22, b 1 = 1.52; 0.73 , b1 , 2.30, with a = .95.
the reading latency difference; this analysis is illustrated in Figure 5. Reading latency difference predicted the image latency difference (r = .89, p , .01) with a slope of 1.52. Because the slope was significantly different from zero and the 95% confidence interval for the slope included 1, it can be concluded that the process underlying the task of Experiment 3 may be organized in serial stages, whereby reading an item is completed before the image for the same item can be completed. Specifically, completing image generation of an item may take as much as twice the time that it takes to read it. In sum, we found evidence that (1) reading and imagery have independent effects and that (2) images are generated after reading is completed. GENERAL DISCUSSION The purpose of this study was to test two hypotheses of image generation, the buffer and the activation hypotheses, by examining the effects of vividness and the effects of image size on the time needed to generate an image. The buffer hypothesis emphasizes the amount of elaboration needed to generate one single apt representation, so vividness and image latency are thought to be directly related to image size, and to the disparity between the original image size—that is, the natural image size—and the test size. The activation hypothesis, on the other hand, equates image generation with the quick, eff icient retrieval of the most appropriate visual representation among multiple past visual memories. Hence, vividness is thought to be critically associated with fast retrieval time. Because we may store visual images of objects at
1187
many different sizes during everyday perceptual experience, size does not significantly affect retrieval time. The major finding of Experiment 1 was that the more vivid the image, the quicker it was generated. It was also found that images subtendinga relatively small visual angle at display were generated more quickly than images subtending a relatively large visual angle. However, display size effects on latency were rather small, accounting for 4% of the variance at most, as opposed to trend effects of vividness, accounting for over 30% of the variance. These findings support the hypothesis that vividnessreflects the level of activation of the visual memory system and that the speed in responding with the generation of a mental image is related to the level of that activation. Indeed, the small image size effects can be interpreted in terms of activation as well. It could be that because of the larger area over which the activation is spread, large images take longer to reach some criterion level of activation (see Kosslyn, Reiser, Farah, & Fliegel, 1983). This interpretation would explain the fact that we could not find any significanteffect of image size on vividness in the data of Experiment 1. Image latency and vividness are not associated with natural image size, as the outcomes of Experiment 2 clearly suggest. This pattern is contrary to the prediction of the buffer hypothesis, but it supports the activation hypothesis and imagery models that are compatible with it. Specifically, we can assume that in memory we have multiple visual representations and image generators (“imagens”), as in dual coding theory. These representations could include separate “variable-sized functional units” (Paivio, 1986, p. 60) specifying image size parameters. Thus, when size specifications have to be used to generate the appropriate image (e.g., to fit an image into a certain display), typically there will be no effect on time of image generation (see Paivio, 1986). Therefore, natural size specifications are independent of the level of activation of the visual imagery system as manifested in the level of vividness and generation speed. In Experiment 3, we found a substantial difference between time to read and time to imagine, with no interaction between word length of synonyms and display size. The results clearly showed evidence of two serial processing stages, with the imagery stage following the reading stage. Thus reading does not seem to overlap with image generation. Because reading and image generation can be reasonably regarded as two separate processing stages, reading and lexical processes do not account for the findings of Experiment 1 and 2, so we can conclude that imagery played the most important role in the image generation task that we used. In sum, this study characterizes visual mental images as being detailed representations, retrieved at many sizes subsequent to lexical access. Accordingly, imagery in everyday life may mostly involves retrieving alreadycomputed representations episodically stored in memory, which seldom require extensive re-elaboration such as size adjustment. Then, the inverse relation between vividness and image latency may be all we need for ordinary
1188
D’ANGIULLI AND REEVES
imagery tasks, and the conceptual, descriptive, and pictorial aspects of images may derive from (or add to) such principle rather than being fundamental properties. REFERENCES Baddeley,A. D., & Andrade, J. (2000). Working memory and the vividness of imagery. Journal of Experimental Psychology: General, 129, 126-145. Cave, K. R., & Kosslyn, S. M. (1989). Varieties of size-specific visual selection. Journal of Experimental Psychology: General, 118, 148-164. Cocude, M., & Denis, M. (1988). Measuring the temporal characteristics of visual images. Journal of Mental Imagery, 12, 89-102. Coren, S., Ward, L. M., & Enns, J. T. (1994). Sensation and perception (4th ed.). Fort Worth, TX: Harcourt Brace. Craver-Lemley,C., & Reeves, A. (1987).Visual imagery selectively reduces vernier acuity. Perception, 16, 599-614. D’Angiulli, A. (2001). Phenomenal and temporal aspects of visual mental image generation: Validating verbal reports on vividness through latency analysis. Dissertation Abstracts International, 61, 5015. Diggle, P. J., Liang, K.-Y., & Zeger, S. L. (1996). Analysis of longitudinal data. New York: Oxford University Press. Finke, R. A. (1980). Levels of equivalence in imagery and perception. Psychological Review, 87, 113-132. Finke, R. A. (1989). Principles of mental imagery. Cambridge, MA: MIT Press. Finke, R. A., & Schmidt, M. J. (1978). The quantitative measure of pattern representation in images using orientation-specific color aftereffects. Perception & Psychophysics, 23, 515-520. Giusberti, F., Cornoldi,C., De Beni, R., & Massironi, M. (1992). Differences in vividness ratings of perceived and imagined patterns. British Journal of Psychology, 83, 533-547. Harris, J. P. (1982). The VVIQ and imagery-induced McCollougheffects: An alternative analysis. Perception & Psychophysics, 32, 290-292. Hoaglin, D. C., Mosteller, F., & Tukey, W. J. (1983). Understanding robust and exploratory data analysis. New York: Wiley. Jolicœur, P., Gluck, M. A., & Kosslyn, S. M. (1984). Pictures and names: Making the connection. Cognitive Psychology, 16, 243-275. Kerr, N. H., & Neisser, U. (1983). Mental images of concealed objects: New evidence. Journal of Experimental Psychology: Learning, Memory, & Cognition, 2, 212-221. Kosslyn, S. M. (1975). Information representation in visual images. Cognitive Psychology, 7, 341-370. Kosslyn, S. M. (1976). Can imagery be distinguished from other forms of internal representation? Evidence from studies of information retrieval times. Memory & Cognition, 4, 291-297. Kosslyn, S. M. (1978). Measuring the visual angle of the mind’s eye. Cognitive Psychology, 10, 356-389. Kosslyn, S. M. (1980). Image and mind. Cambridge, MA: Harvard University Press. Kosslyn, S. M. (1994). Image and brain. Cambridge, MA: MIT Press. Kosslyn, S. M., Reiser, B. J., Farah, M. J., & Fliegel, S. L. (1983).
Generating visual images: Units and relations. Journal of Experimental Psychology: General, 112, 278-303. KuÏcera,N., & Francis, W. N. (1967). Computationalanalysis of presentday American English. Providence: Brown University Press. Kunen, S., & May, J. G. (1980). Spatial frequency content of visual imagery. Perception & Psychophysics, 28, 555-559. Luce, R. D. (1986). Response times: Their role in inferring elementary mental organization. New York: Oxford University Press. Mathews, N. N., Hunt, E. B., & MacLeod, C. M. (1980). Strategy choice and strategy training in sentence-picture verification. Journal of Verbal Learning & Verbal Behavior, 19, 531-548. Olseth, K. L., & Barsalou, L. W. (1995). The spontaneous use of perceptual representations during conceptual processing. Proceedings of the seventeenth annual meeting of the Cognitive Science Society (pp. 310-315). Hillsdale, NJ: Erlbaum. Paivio, A. (1986). Mental representations: A dual coding approach. New York: Oxford University Press. Paivio, A., Yuille, J. C., & Madigan, S. (1968). Concreteness, imagery, and meaningfulness values for 925 nouns. Journal of Experimental Psychology Monograph Supplement, 76 (1, Pt. 2), 1-25. Pearson, D. G. (1995). The VVIQ and cognitive models of imagery: Future directions for research. Journal of Mental-Imagery, 19, 167-170. Pearson, D. G., De Beni, R., & Cornoldi, C. (2001). The generation, maintenance, and transformation of visuo-spatial mental images. In D. Michel, and R. H. Logie (Eds.), Imagery, language and visuo-spatial thinking: Current issues in thinking and reasoning (pp. 1-27). Philadelphia: Taylor & Francis. Ratcliff, R. (1978). A theory of memory retrieval. Psychological Review, 85, 59-108. Rock, I., Shallo, J., & Schwartz, F. (1978). Pictorial depth and related constancy effects as a function of recognition. Perception, 7, 3-19. Rosch, E., Mervis, C. B., Gray, W. D., Johnson, D. M., & BoyesBraem, P. (1976). Basic objects in natural categories. Cognitive Psychology, 8, 382-439. Rosenthal, R., & Rosnow, R. L. (1988). Contrast analysis: Focused comparisons in the analysis of variance. New York: Cambridge University Press. Sternberg, S. (1969). The discovery of processing stages: Extensions of Donders’ method. Acta Psychologica, 30, 276-315. Sternberg,S. (1998).Discovering mental processing stages: The method of additive factors. In D. Scarborough & S. Sternberg (Eds.), Methods, models and conceptual issues: An invitation to cognitive science (pp. 703-863). Cambridge, MA: MIT Press. Thorndike, E. L., & Lorge, I. (1944). The teacher’s word book of 30,000words. New York: Columbia University,Teachers College Press. Wilson, M. (1987). MRC psycholinguistic database: Machine usable dictionary (Version 2.00) [Electronic database]. Chilton, U.K.: Rutheford Appleton Laboratory, Informatics Division Science and Engineering Research Council [Producer and Distributor]. (Manuscript received November 24, 2000; revision accepted for publication June 18, 2002.)