EKONOMETRIA ECONOMETRICS 3(45)•2014
Publishing House of Wrocław University of Economics Wrocław 2014
Copy-editing: Marcin Orszulak Layout: Barbara Łopusiewicz Proof-reading: Barbara Cibis Typesetting: Małgorzata Czupryńska Cover design: Beata Dębska This publication is available at www.ibuk.pl, www.ebscohost.com, Lower Silesian Digital Library www.dbc.wroc.pl, The Central European Journal of Social Sciences and Humanities http://cejsh.icm.edu.pl and in The Central and Eastern European Online Library www.ceeol.com, as well as in the annotated bibliography of economic issues of BazEkon http://kangur.uek.krakow.pl/ bazy_ae/bazekon/nowy/index.php Information on submitting and reviewing papers is available on the Publishing House’s website www.wydawnictwo.ue.wroc.pl All rights reserved. No part of this book may be reproduced in any form or in any means without the prior written permission of the Publisher © Copyright by Wrocław University of Economics Wrocław 2014 ISSN 1507-3866 The original version: printed Printing: EXPOL, P. Rybiński, J. Dąbek, sp.j. ul. Brzeska 4, 87-800 Włocławek
Contents Preface...............................................................................................................
7
Alicja Grześkowiak: Age and perception of non-financial work aspects by Poles............................................................................................................. 9 Marta Dziechciarz-Duda: Subjective poverty line as classification criteria for credits purposes of households.............................................................. 19 Klaudia Przybysz: Lifelong learning idea against the background of Poles’ needs............................................................................................................ 31 Piotr Białowolski: Consumer confidence, durable goods purchase and unemployment forecast......................................................................................... 42 Joanna Chudzian, Mariola Chrzanowska: Parametric and non-parametric regression methods in identifying an impact of components of advertising on consumers behaviour.............................................................................. 56 Janusz Korol, Przemysław Szczuciński: Competitiveness of industry in Polish regions................................................................................................... 71 Jadwiga Borucka: Extensions of Cox model for non-proportional hazards purpose......................................................................................................... 85 Yulia V. Vymyatnina, Daria Antonova: Credit booms in the countries of the Eurasian Economic Union. Are they related?.............................................. 102 Martin Pavlík, Martin Lukáčik, Grzegorz Michalski: Software for the demonstration of the fundaments of portfolio selection.................................. 122 Michał Jakubiak: The influence of order picking zone’s configuration on the time of the order picking process................................................................. 138 Agnieszka Sompolska-Rzechuła, Małgorzata Machowska-Szewczyk, Anita Chudecka-Głaz, Aneta Cymbaluk-Płoska, Janusz Menkiszak: The use of logistic regression in the ovarian cancer diagnostics................. 151
Streszczenia Alicja Grześkowiak: Wiek a postrzeganie niefinansowych warunków pracy przez Polaków.............................................................................................. Marta Dziechciarz-Duda: Klasyfikacja gospodarstw domowych na podstawie subiektywnej granicy ubóstwa i celów kredytowych........................... Klaudia Przybysz: Idea kształcenia ustawicznego na tle potrzeb Polaków.... Piotr Białowolski: Wskaźnik ufności konsumenckiej, popyt na dobra trwałe i prognozy bezrobocia..................................................................................
18 30 41 54
6
Spis treści
Joanna Chudzian, Mariola Chrzanowska: Zastosowanie parametrycznych i nieparametrycznych metod regresji w celu określenia wpływu składników reklamy na zachowania konsumentów................................................ 69 Janusz Korol, Przemysław Szczuciński: Konkurencyjność sektora przemysłu w regionalnej przestrzeni Polski............................................................ 84 Jadwiga Borucka: Rozszerzenia modelu Coxa dla nieproporcjonalnych hazardów.......................................................................................................... 98 Yulia V. Vymyatnina, Daria Antonova: Credit booms w krajach Euroazjatyckiej Unii Gospodarczej. Analiza powiązań............................................. 121 Martin Pavlík, Martin Lukáčik, Grzegorz Michalski: Dobór składowych portfela aktywów bieżących z użyciem oprogramowania........................... 137 Michał Jakubiak: Wpływ konfiguracji strefy kompletacji na czas realizacji procesu komisjonowania zamówień............................................................ 150 Agnieszka Sompolska-Rzechuła, Małgorzata Machowska-Szewczyk, Anita Chudecka-Głaz, Aneta Cymbaluk-Płoska, Janusz Menkiszak: Wykorzystanie regresji logistycznej w diagnostyce raka jajnika................ 164
EKONOMETRIA ECONOMETRICS 3(45) • 2014 ISSN 1507-3866
Piotr Białowolski
Warsaw School of Economics e-mail:
[email protected]
CONSUMER CONFIDENCE, DURABLE GOODS PURCHASE AND UNEMPLOYMENT FORECAST1 Summary: Multi-Group Confirmatory Factor Analysis (MGCFA) demonstrated the deficiency of the four original European Commission (EC) items for consumer confidence. Fit of the MGCFA model was unacceptable and without scalar invariance, index comparison between study periods was not permissible. This provided clear motivation for a plausible alternative index specification to comply with requirements for single-dimensionality and meaning invariance throughout the study period. The MGCFA model using a new set of items demonstrated partial metric and partial scalar invariance. Using the structural equation framework, consumer confidence was revealed as strongly interrelated with unemployment forecast and durable goods purchase. Keywords: consumer confidence, confirmatory factor analysis, durable goods purchase, measurement invariance, unemployment expectations. DOI: 10.15611/ekt.2014.3.04
1. Introduction Consumer confidence indices were developed in order to assess consumer attitudes. An attempt was made to assimilate concepts of consumer psychology into the theory of economic behaviour and to allow their capture in one latent variable. Although in the literature the interpretation of changes in the consumer confidence indices is still a subject for debate [Ludvigson 2004]2 and their application to forecasting of basic Financial support for the research was provided by the National Science Centre in Poland (research grant no. UMO-2011/01/D/HS4/04051). 2 Ludvigson [2004] provides two alternative theoretical interpretations of the changes in the consumer confidence. On one hand, increase in consumer confidence might lead to a decrease in the level of precautionary saving, thus causing an increase in the level of current consumption, and thus, negatively affect the growth of consumption. On the other hand, an increase in consumer confidence might indicate a positive change in the expected future level of income and wealth – not accounted for in the life cycle calculations, so an unexpected change in the level of income or wealth. Due to this positive 1
Consumer confidence, durable goods purchase and unemployment forecast 43
economic variables – mainly consumption [Angevine 1974; Batchelor, Dua 1992; Carroll, Fuhrer, Wilcox 1994; Curtin 1982] – is still their main area of application, there is still insufficient discussion of problems associated with “meaning” and “measurement” in consumer surveys.3 In the approach to consumer confidence commonly applied, indices are calculated as simple (or weighted) averages of balances4 for a given set of items. However, critical questions are left unanswered by such an approach: (1) Is the item set coherent? Do responses to these items reflect consumer confidence? (2) Do respondent interpretations of items and their response modes remain constant between study periods? Failure to confirm these assumptions might create a source for the misinterpretation of consumer confidence indicators. A lack of coherence in the case of the first question might force a multi-dimensional phenomenon to be projected to one-dimensional space. Hence, variable meaning throughout the study period would compromise valid comparison of confidence index values. If the answer to the second question were negative, comparisons could not be made between values of consumer confidence obtained for different study periods. If either of these conditions were violated, then values for consumer confidence would hardly be meaningful, neither reliable nor valid. Although there were attempts to apply methods other than the simple or weighted averages to calculate aggregate indices reflecting the consumer confidence, there was little research into verification of the foundations for a one factor solution in their measurement. The first goal of the article is to evaluate the possibility of applying a one-dimensional scale to measure consumer confidence using a set of questionnaire responses from consumer survey data.5 In the literature, arguments can be found describing failure of simple summation to account for interrelations between variables and their contribution to consumer confidence [Pickering, Harrison, Cohen 1973]. The second point of interest is the calculation of values for an indicator that would meet the conditions for consistent measurement. The third objective is to confirm the expected interrelation between individually calculated consumer confidence and both unemployment expectations and intentions to purchase durables. Firstly, the applied theory of measurement is presented in the context of the consumer survey. Secondly, the validity of the consumer confidence index (CCI) as a single number, as obtained from the State of the Household Survey conducted at the Research Institute for Economic Development, is tested. Are all responses to the change, a growth in consumption is expected. However this situation must be connected to liquidity constraints. Even an unexpected change in future income or wealth observed in the current period should prompt an increase in current consumption. 3 An exception is provided in the paper of Didow, Perreault, Williamson [1983]. 4 Differences in the proportion of “positive” to “negative” responses to an item. 5 The standardized questionnaire is presented in Table 1 of the Appendix.
44
Piotr Białowolski
questionnaire driven by a single factor? Thirdly, a check to determine measurement invariance in time for the meaning of the construct “consumer confidence” for the standard set from the European Commission guidelines [European Commission 2006] is performed. Then, since it appeared that modifications to the set of question for the CCI were required, new items were proposed for the measurement of consumer confidence. The newly created one-dimensional consumer confidence indicator was then applied to determine the relationship between consumer confidence and forecasts for durable goods purchase and unemployment.
2. Linear MGCFA measurement model applied to consumer surveys Consumer confidence is a phenomenon that should be assumed complex and not directly observable. This leads to the conclusion that it should not be possible to provide information on consumer confidence based on only one answer to a single question. Traditionally, measures of consumer confidence have been an aggregation of information from a few selected items from different areas of economic activity. Since various areas for economic activity contribute to the measurement of consumer confidence, it is vital to establish the rules that would allow not only to account for different reactions and natural levels of confidence in different areas reflecting consumer behaviour but also structural breaks in the time series which result from changes in the meaning of the latent construct – consumer confidence – should be identified. A confirmatory factor model is proposed, in which responses to all items reflecting confidence are modeled at an individual level as a linear function of consumer confidence.6 The model is estimated using simultaneous restricted maximum likelihood for all periods (multi-group confirmatory factor analysis – MGCFA). In this approach, consumer confidence is assumed to be a latent phenomenon being reflected by the corresponding questionnaire items. The formal structure of the estimated model for N items, one latent variable (consumer confidence) and T time periods can be given by:
∀t∈T q t = τ t + γ t CCI t + ε t
(1)
t
where in all time periods q is N ×1 vector of item responses, τt is N ×1 vector of intercepts, γt is N ×1 vector of factor loadings and εt is N ×1 vector of measurement errors. In this specification, to ensure identifiability of the model, one element of the vector γt (factor loading) is set equal to 17 and one element (which must correspond
It has been shown in various studies that with items measured on 5-point scales, the results are not compromised by application of linear approximation [see, e.g., Rasmussen 1989]. 7 It is usually the first element in this vector. Instead of constraining one factor loading to 1, identifiability of the measurement model can be also ensured by setting the variance of latent variable to 1. 6
Consumer confidence, durable goods purchase and unemployment forecast 45
to constrained to 1 factor loading) of τt vector (intercept) is set to zero. Additionally,
(
t
t
)
0 .8 E(εt) = 0 and ∀t∈1..T , p , q∈1.. N , p ≠ q cov ε p , ε q = The model estimated using these constraints does not permit comparison of the latent variable mean (consumer confidence averages) at different times. For this to be allowable, estimates of the measurement model have to meet the following three conditions of invariance [Davidov 2008; Steenkamp, Baumgartner 1998]: (1) configural, (2) metric and (3) scalar. If these conditions are satisfied, then full measurement invariance of the latent phenomenon can be established [Davidov 2008] and CCI values can be directly compared. To confirm measurement invariance, the conditions are verified stepwise or starting from the configural invariance and then directly going to scalar invariance [see, e.g., Millsap, Yun-Tein 2004]. The lowest level of measurement invariance is configural invariance – sometimes referred to as “weak factorial invariance” [Davidov 2008]. In the case of consumer confidence, it requires that the same group of survey items is used to measure the level of confidence and the same pattern of factor loadings is specified for each time period. In order to ensure configural invariance in the multi-group model, a model with such restriction should fit the survey data well with respect to commonly applied fit statistics [e.g. Hu, Bentler 1999]. Configural invariance does not imply a constant relationship between the CCI and responses to the survey questionnaire with time [Davidov 2008]. To confirm constant interpretation of these responses with time, metric and scalar invariance has to be established. These measures signify that attitudes – the interpretation of responses – do not change over time. Establishing metric invariance ensures that changes in attitudes, for instance, from “very positive” to “positive”, allow the same interpretation throughout all study periods.9 This is established by fixing factor loadings to be equal over time and checking model fit. Assuming the same specification (eq. 1) for the measurement model, the vector of factor loadings (γt) has to meet the condition ∀t1 ,t2 ∈1..T ;t1 ≠t2 ( γ t1 = γ t2 ) . Scalar invariance, apart from the equal factor loadings (metric invariance), requires additional constraint on the vector of intercepts (τt). Formally, the constraint can be presented as ∀t1 ,t2 ∈1..T ;t1 ≠t2 τ t1 = τ t2 . In consumer surveys, scalar invariance implies that “the natural zero level” for mood influencing response to different
(
)
8 More details concerning the multi-group confirmatory factor analysis can be found in for example Brown [2006]. 9 In terms of the meaning of the latent phenomenon, the metric invariance implies that if latent variable (CCI) changes, then, on average, the same change occurs in response to a particular question during all time periods.
46
Piotr Białowolski
survey items is checked for constancy throughout the study period. In the standard approach (average of balances), changes to the value of the consumer confidence index might result from movement in the natural level of optimism in a particular area for consumer confidence.10 If measurement invariance is satisfied at all three levels, then changes in level of consumer confidence can be fully explained by changes in amplitude of the latent variable, and thus, justify comparison of the mean of the latent variable. However, it might appear that the model (eq. 1) with constraints ensuring full measurement invariance is not satisfactory. Thus, full measurement invariance cannot be established. In such circumstances, to reliably conduct mean comparisons, it is sufficient to impose partial measurement invariance. In practice, this means that the equality of factor loadings and intercepts is only guaranteed for two items [Byrne, Shavelson, Muthen 1989; Steenkamp, Baumgartner, 1998). Formally represented as:
(
)
∃n1 ,n2 ∈1.. N ;n1 ≠ n2 ∀t1 ,t2 ∈1..T ;t1 ≠t2 τ tn11 = τ tn21 ∧ τ tn12 = τ tn22 ∧ γ tn11 = γ tn21 ∧ γ tn12 = γ tn22 .
3. Specification of a measurement model for the consumer confidence indicator and confirmation using MGCFA The standardized consumer questionnaire proposed by the European Commission includes four items as the basis for the calculation of the consumer confidence index.11 It comprises forecasts for: (1) Financial situation of a household (FS.F), (2) General economic situation (GES.F), (3) Unemployment in the economy (UNEMP.F), (4) Savings of household (SAV.F). Following the standard procedure [European Commission 2006], to calculate the values of the CCI, a simple average of balances for responses to the four questions was calculated. The index calculated with this approach will be referred to here as CCIBAL,STANDARD. However, as already mentioned, this set of questions has not been confirmed for measurement invariance. These responses, despite being treated as consumer confidence items, might react differently to changes in consumer confidence and these various reactions should be estimated rather than predetermined since responses to different questions might be consistently and regularly biased. An example of such bias is that in some countries, the financial situation of a household 10 As it is assumed that confidence is the factor driving the responses to all questions, a change in the average value of a single indicator should not be associated with a change in the confidence. In the case of a simple aggregation of balances, this information might be lost and lead to false interpretation. 11 Responses to the items in the consumer questionnaire are treated as being on a continuous scale. The precise wording of items and the scores for different responses for the items used can be found in the Appendix.
Consumer confidence, durable goods purchase and unemployment forecast 47
is usually higher than the general economic situation [Bovi 2006], whereas the opposite relationship was identified for the Polish economy [Białowolski, Dudek 2008]. In order to overcome potential flaws for the index calculated as a simple average, MGCFA was employed. To ensure the invariant measurement with time, measurement invariance (between groups – quarterly) was checked. At first, the measurement model of the consumer confidence index (CCICFA,STANDARD12) is specified in line with the formula given by eq. 1, using responses to questions FS.F, GES.F, UNEMP.F and SAV.F as items for the MGCFA model. Model fit was assessed using the dataset from the State of the Household Survey conducted at the Research Institute for Economic Development at the Warsaw School of Economics (56 quarters between 2000 Q1 and 2013 Q4 with an average of 665 responses in each quarter).13 Following the stepwise procedure defined previously, measurement invariance for the model of CCICFA,STANDARD was verified. The results proved that the configural model had a rather poor fit (CFI = 0.905, TLI = 0.716, RMSEA = 0.104).14 In particular, TLI and RMSEA were far above commonly accepted levels. In consumer surveys, the assumption of zero correlation between error terms in the item responses is commonly violated. According to Finkel [1995], error correlation might be caused by (1) memory effects, (2) similar wordings or (3) meanings of items that induce similar responses over time, independently of the latent variable. In consumer surveys, the influence of wording is frequently noted. Modification indices for the CCICFA,STANDARD model indicated that the highest expected gain was a consequence of the correlation introduced between error terms for item responses, reflecting the general economic situation and unemployment forecasts. The second highest gain was associated with introduction of the correlation 12 In this paper, three indices of consumer confidence are calculated. For simplicity, there common symbols were applied to indices calculated according to different rules. CCIBAL,STANDARD refers to the index calculated as a simple average of balances for the standard set of items (GES.F, UNEMP.F, FS.F,SAV.F), CCICFA,STANDARD refers to the index calculated with application of the MGCFA, but also with application of the standard set of items, and finally, CCICFA,MODIFIED refers to the index calculated with MGCFA but with a modified set of items (FS.F, SAV.F, FIN.S), where FIN.S refers to the current financial position of household. 13 In each quarter there were at least 300 responses, sufficient both for multi-group and single timepoint estimation. 14 There are no strict rules for the assessment of model fit in the MGCFA specification. For a discussion on the issues of model fit, see Steenkamp, Baumgartner [1998]; Hu, Bentler [1999]; Marsh, Hau, Wen [2004] and Davidov [2008]. In this article models are assessed with goodness-of-fit statistics. Among the set of accessible ones, probably more than 20, three indices were selected on their relative popularity and accessibility in Mplus 6, which was used for calculations. Comparative Fit Index (CFI) and Tucker-Lewis Index (TLI) are assumed to correspond to a good model when higher than 0.9 and RMSEA (Root Mean Square Error of Approximation) when lower or equal to 0.05 (in a less rigid approach – lower than 0.08). In this article, it is assumed that if all presented statistics lie within the range of acceptance, measurement invariance on a given level can be established.
48
Piotr Białowolski
between the financial situation of a household and the household saving forecast. This might be justified by the fact that two items from the set, GES.F, UNEMP.F, FS.F and SAV.F relate to the economic situation (GES.F, UNEMP.F) and the remaining two concern the household (FS.F, SAV.F). This may explain the stronger correlation between the items within sub-groups. The configural model estimated which included correlation between error terms of GES.F and UNEMP.F had a reasonably good fit (CFI = 0.985, TLI = 0.909, RMSE = 0.059). Configural invariance in this specification implies the possibility for measurement of a period-specific latent phenomenon using the set of four variables. In order to conduct reliable comparison of consumer confidence indicator values between time points, a model with metric and scalar invariance was estimated. The fit of such a model was very poor and did not point to full measurement invariance (CFI = 0.456, TLI = 0.527, RMSE = 0.135). In order to estimate a model with partial measurement invariance, factor loadings and intercepts that might be relaxed with the highest chi-square gain were identified. Nevertheless, even the model with two items relaxed (GES.F and UNEMP.F)15 was not characterized by adequate values for fit (CFI = 0.926, TLI = 0.851, RMSE = 0.076). This implied that the index based on the four items could not be accepted and a different specification for the confidence index needed to be found.
4. Model of consumer confidence based on household information As previously mentioned, the fit for the CCICFA,STANDARD (using four standard items – GES.F, UNEMP.F, FS.F and SAV.F) was not satisfactory. Alternative specifications for the model might provide a more coherent set of survey items for consumer confidence. The problems encountered during the estimation of the model with the standard specification suggested that a source for problems might be the mixture of items in the model connected with the household situation and the general economic situation. One solution might be to construct an index based solely on items from one realm, either the household or general economic situation. In this article a set of items is applied based on household assessment and self-forecast. To achieve this, items associated with the household financial situation and savings’ forecast were included with an additional item on the financial position of the household (FIN.S). All items relate to the household economic situation and do not directly correspond to the economic situation of the country. This set of questions served as the basis for an Index of Consumer Confidence with a modified set of variables – CCICFA,MODIFIED.
The choice of items was based on the modification of indices provided by Mplus output. In step 1, the factor loading and intercept was relaxed for the item UNEMP.F as expected gain in χ2 was 2854.279. In the following step loading and intercept for GES.F were relaxed due to expected gain in χ2 equal to 1348.099. 15
Consumer confidence, durable goods purchase and unemployment forecast 49
For the model with the alternative set of items (CCICFA,MODIFIED), the steps to establish measurement invariance were also taken. The fit statistics for configural invariance were not calculated as with three items such a model is identifiable with zero degrees of freedom and there is no discrepancy between the original and estimated covariance matrix. However, for the approach, the most crucial property is comparability of the index between study periods and to provide this a model with full measurement invariance was calculated. This model had the following fit: CFI = 0.904, TLI = 0.926, RMSE = 0.068. All values were within acceptable bounds, affording full measurement invariance for the model and allowed averages of CCICFA,MODIFIED for each study period to be compared. The final structure of the measurement model is represented by the following system:16
FS .= F t 3.692− 1 ⋅ CCI t + ε1t (0.020) t − 1.122⋅ CCI t + ε 2t . SAV .F = 3.524 (0.020) (0.029) FIN .S t = 2.742+ 1.226⋅ CCI t + ε 3t (0.023) (0.032)
(2)
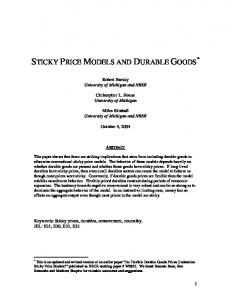
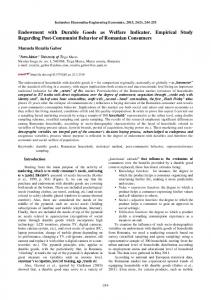
From the estimated model (2) the following conclusions can be drawn: 1. The higher the value of CCICFA,MODIFIED, the better the perception of the household situation reported. 2. Unit increase in the value of CCICFA,MODIFIED corresponds to 1.122 point improvement in the response to the item concerning savings forecast and 1.226 points improvement in the assessment of the household financial position. The index using the modified set of questions (CCICFA,MODIFIED) was also contrasted with the index calculated as the simple average with the standard set of questions (CCIBAL,STANDARD). Comparison of these two indices is illustrated in Figure 1. The graphical analysis in Figure 1 shows co-movements of CCICFA,MODIFIED and CCIBAL,STANDARD before the onset of the financial crisis (2008 Q3), as confirmed by the correlation coefficient of 0.9. Nevertheless, the confidence indicator based on household related items shows no significant decline afterwards. It is probably associated with stable assessment of the household financial position as compared with the general economic assessment for which the converse was observed. The correlation coefficient between the two indicators for the whole period of analysis was 0.63.
Due to negative orientation of the item associated with financial situation forecasts (FS.F) – higher values were associated with deterioration and lower values associated with improvement – “−1” instead of “1” was used in this marker variable for the slope coefficient relating it to the CCI. 16
50
-1.0
2000Q1 2000Q3 2001Q1 2001Q3 2002Q1 2002Q3 2003Q1 2003Q3 2004Q1 2004Q3 2005Q1 2005Q3 2006Q1 2006Q3 2007Q1 2007Q3 2008Q1 2008Q3 2009Q1 2009Q3 2010Q1 2010Q3 2011Q1 2011Q3 2012Q1 2012Q3 2013Q1 2013Q3
0.0
Piotr Białowolski
-2.0
0,4 0,3 0,2
-3.0 0,1 -4.0 0
-5.0
-0,1
-6.0 -7.0
-0,2 stndard CCI
CCI with new set of items
Figure 1. Comparison of CCI for the Polish economy – calculated as a simple average of balances with standard set of questions (CCIBAL,STANDARD) and with application of CFA on the modified set of questions (CCICFA,MODIFIED) Source: own calculations.
5. Consumer confidence and durable goods purchase forecast It is hypothesized that consumer confidence has significant impact on household projections of durable goods purchase. With more confidence in the household financial situation and greater optimism about the future, households may plan to increase their spending on durables. Based on the developed confirmatory factor model for consumer confidence, an extension to the structural model with durable goods purchase (Q9 – Appendix) as the dependent variable was provided. In this specification, consumer confidence was used in the equation for durable goods purchase in the following form:
MP.F t = α t + β1t CCI t + εt , where MP.F t represents projections about durable goods purchase and CCI represents values for CCICFA,MODIFIED. The assessment of the structural model used standard comparative fit statistics. The additional constraints on equality of intercepts and slopes between periods were tested with χ2 difference17. Using χ2 it was possible 17 Although we assume that our variables are measured on a linear scale, we do not assume normality of response distributions. Due to that, the estimation is performed with restricted maximum
Consumer confidence, durable goods purchase and unemployment forecast 51
to determine whether the relation between the latent factor (consumer confidence) and the durable goods purchase forecasts could be assumed constant between study periods. The results are presented in Table 1. Table 1. Structural model for durable goods purchases on consumer confidence Model
CFI
TLI
RMSEA
χ2 difference test p-value
1. Baseline (α and β allowed to vary between periods)
0.904
0.903
0.058
–
2. α constrained to be equal between periods
0.899
0.912
0.055
0.000
3. β constrained to be equal between periods
0.902
0.915
0.051
0.156
Source: own calculations.
During estimation, equality between periods was established with respect to the slope coefficients. All fit statistics were within the acceptable range for the final model, which took the form:
MP.Fi t = α t − 0.548 ⋅ CCI it + εti . (0.027)
This final equation implies that the higher the level of consumer confidence, the more likely it was for a household to declare major purchases (the MP.F is measured on an inverted scale – see Appendix). A one-point increase in the value of the confidence indicator stimulated a change in the household response to the item regarding major purchases by 0.548 points. It needs to be underlined that the impact of consumer confidence on major purchases can be considered independent of time only with respect to the slope coefficient. A varying intercept implies that for the given level of confidence different levels of intention to purchase major goods can be observed in different periods. Equality between slope factors implies that at all times a one point change in individual level of consumer confidence had the same impact on intention to purchase durable goods.
6. Consumer confidence and unemployment expectations To assess the co-movement of unemployment expectations with consumer confidence, it was hypothesised that they were mutually interrelated. The structural model was introduced in which the equation describing consumer confidence, covariance between CCI and unemployment expectation was introduced. It took the following form: likelihood estimator and the difference testing is performed with Satorra-Bentler chi-square difference testing procedure [Satorra, Bentler 2001].
52
Piotr Białowolski
Cov(UNEMP.F t , CCI t ) = ρ t , where UNEMP.F t represents unemployment expectation of households, which t are related to CCI (consumer confidence), ρ stands for period specific covariance coefficient. Superscript t indicates that covariance between consumer confidence and unemployment expectation can vary between study periods. However, simultaneous estimation of such a model for all periods (2000 Q1– 2013 Q4) led to the conclusion that the model did not fit the data sufficiently well: CFI = 0.868, TLI = 0.866, RMSEA = 0.073. Only after data had been divided into three subsamples (2000 Q1–2004 Q4, 2005 Q1–2008 Q4 and 2009 Q1–2013 Q4) did results improve significantly. The selection of interval dates was not by chance. Before 2005 State of the Household Survey consisted of a stable panel. In 2005 the original panel was disbanded and a completely new set of households was drawn. At the beginning of 2009 all the negative consequences of the financial crisis materialized in respondents’ opinions and significantly influenced their responses. The results of estimation for three models are presented in the following table. In this example, equality of covariance coefficients between periods within given subsamples was verified. Table 2. Structural model including unemployment forecasts and consumer confidence 2000 Q1–2004 Q4
2005 Q1–2008 Q4
χ2 RMSEA p-value
Model
CFI
TLI
1
0.928
0.926
0.075
2
0.918
0.927
0.074
2009 Q1–2013 Q4
χ2 RMSEA p-value
CFI
TLI
–
0.919
0.915
0.055
0.000
0.906
0.915
0.055
χ2 p-value
CFI
TLI
RMSEA
–
0.927
0.925
0.047
–
0.000
0.924
0.932
0.045
0.096
Model: 1. Baseline (covariance coefficients allowed to vary between periods); 2. Covariance constrained to be equal between periods. Source: own calculations.
In the sub-periods 2000 Q1–2004 Q4 and 2005 Q1–2008 Q4 the best fitting model was that with a time variant covariance coefficient between unemployment forecasts and consumer confidence. Only for the period 2009 Q1–2013 Q4 was it established that the best fitting model was the one with equal covariance between periods. Nevertheless, it has to be underlined that during all sub-periods, period specific coefficients of covariance were always as expected – there was a positive relation between consumer confidence and expectations regarding the labour market, i.e., a higher level of consumer confidence was associated with the lower expected unemployment growth. Only for the period 2009 Q1–2013 Q4 was a constant link with consumer confidence established, namely that a one-point increase in the level of consumer confidence was associated with unemployment expectations lower by 0.668 points with regards to the scale of the question UNEMP.F (see Appendix).
Consumer confidence, durable goods purchase and unemployment forecast 53
7. Conclusions The article should start discussion about methodology applied to the measurement of complex, latent phenomena in business and consumer surveys. The results demonstrated how a standard set of questions might fail to generate information consistent between rounds of the survey. The set of questions proposed by the European Commission was therefore not valid for CCI calculations in Poland. Of the two candidate indices, based on either responses to questions about the general economic situation or the household situation, the latter option was chosen for the analysis. This new index should be interpreted as reliable and valid, as confirmed by the comparative fit statistics. With the newly created index of consumer confidence, structural models show that more confident consumers demonstrate greater optimism about the labour market situation and willingness to increase their purchase of durables. It was further shown that the association between confidence and durable goods purchase was constant throughout study periods (2000 Q1–2013 Q4), while a stable relation between consumer confidence and unemployment forecasts was only confirmed for the period 2009 Q1–2013 Q4.
References Angevine G.E., 1974, Forecasting consumption with a Canadian consumer sentiment measure, The Canadian Journal of Economics/Revue Canadienne d’Economique, vol. 7(2), pp. 273–289. Batchelor R., Dua P., 1992, Survey expectations in the tome series consumption function, The Review of Economics and Statistics, vol. 74(4), pp. 598–606. Białowolski P., Dudek S., 2008, Wzorce formułowania ocen i prognoz przez polskie gospodarstwa domowe – fakty i mity, Prace I Materiały IRG SGH. Bovi M., 2006, Long-run biases in consumer sentiment. Micro evidence from European surveys, OECD Workshop on Business and Consumer Tendency Surveys. Brown T.A., 2006, Confirmatory Factor Analysis for Applied Research, The Guilford Press, New York. Byrne B.M., Shavelson R.J., Muthen B., 1989, Testing for the equivalence of factor covariance and mean structures: The issue of partial measurement invariance, Psychological Bulletin, vol. 105(3), pp. 456–466. Carroll C.D., Fuhrer J.C., Wilcox D.W., 1994, Does consumer sentiment forecast household spending? If so, why?, The American Economic Review, vol. 84(5), pp. 1397–1408. Curtin R.T., 1982, Indicators of consumer behavior: The University of Michigan Surveys of Consumers, Public Opinion Quarterly, vol. 46(3), pp. 340–352. Davidov E., 2008, A cross-country and cross-time comparison of the human values measurements with the second round of the European Social Survey, Survey Research Methods, vol. 2(1), pp. 33–46. Didow N.M., Perreault W.D., Williamson N.C., 1983, A cross-sectional optimal scaling analysis of the index of consumer sentiment, Journal of Consumer Research, vol. 10(3), pp. 339–347. European Commission, 2006, European Economy, Special Report no. 5, The Joint Harmonised EU Programme of Business and Consumer Surveys. Finkel S.E., 1995, Causal Analysis with Panel Data, Sage University Papers series on Quantitative Applications in the Social Sciences, SAGE Publications, Thousand Oaks.
54
Piotr Białowolski
Hu L., Bentler P.M., 1999, Cutoff criteria for fit indexes in covariance structure analysis: Conventional criteria versus new alternatives, Structural Equation Modeling, vol. 6(1), pp. 1–55. Ludvigson S.C., 2004, Consumer confidence and consumer spending, The Journal of Economic Perspectives, vol. 18(2), pp. 29–50. Marsh H.W., Hau K.T., Wen Z., 2004, In search of golden rules: Comment on hypothesis-testing approach to setting cut-off values for fit indexes and dangers in overgeneralizing Hu and Bentler’s (1999) findings, Structural Equation Modelling, vol. 11, pp. 320–341. Millsap R.E., Yun-Tein J., 2004, Assessing factorial invariance in ordered-categorical measures, Multivariate Behavioral Research, vol. 39(3), pp. 479–515. doi:10.1207/S15327906MBR3903_4. Pickering J.F., Harrison J.A., Cohen C.D., 1973, Identification and measurement of consumer confidence: Methodology and some preliminary results, Journal of the Royal Statistical Society. Series A, vol. 136(1), pp. 43–63. Rasmussen J.L., 1989, Analysis of Likert-scale data: A reinterpretation of Gregoire and Driver, Psychological Bulletin, vol. 105(1), pp. 167–170, retrieved from http://dx.doi.org/10.1037/00332909.105.1.167. Satorra A., Bentler P.M., 2001, A scaled difference chi-square test statistic for moment structure analysis, Psychometrika, vol. 66, pp. 507–514. Steenkamp J.E.M., Baumgartner H., 1998, Assessing measurement invariance in cross-national consumer research, The Journal of Consumer Research, vol. 25(1), pp. 78–90.
WSKAŹNIK UFNOŚCI KONSUMENCKIEJ, POPYT NA DOBRA TRWAŁE I PROGNOZY BEZROBOCIA Streszczenie: W artykule podjęty został temat oceny zgodności pomiaru dla zmiennych wskaźnikowych stosowanych przy obliczaniu wskaźnika zaufania w sektorze gospodarstw domowych. Za pomocą konfirmacyjnej analizy czynnikowej dla wielu grup (MGCFA) pokazane zostało, że zaproponowany przez wytyczne Komisji Europejskiej zestaw wskaźników nie jest zgodny. Statystyki dopasowania w modelu MGCFA były niesatysfakcjonujące i nie udało się zapewnić ani pełnej, ani częściowej zgodności pomiaru, co uniemożliwia porównywanie wartości wskaźnika złożonego między okresami. Zgodność pomiaru udało się otrzymać dla zmodyfikowanego zestawu wskaźników, uwzględniającego jedynie pytania dotyczące sytuacji gospodarstwa domowego. Dzięki wykorzystaniu zmodyfikowanego wskaźnika w modelu strukturalnym wykazano, że zaufanie konsumentów było silnie powiązane z prognozami bezrobocia, a także z prognozami formułowanymi przez gospodarstwa domowe w obszarze popytu na dobra trwałe. Do analiz wykorzystano zestaw wskaźników z badania Kondycji Gospodarstw Domowych prowadzonego przez Instytut Rozwoju Gospodarczego w Szkole Głównej Handlowej obejmujący okres między I kwartałem 2000 r. i IV kwartałem 2013 r. Słowa kluczowe: wskaźnik zaufania, konfirmacyjna analiza czynnikowa, popyt na dobra trwałe, niezmienność pomiaru, prognozy bezrobocia.
Consumer confidence, durable goods purchase and unemployment forecast 55
Appendix Set of questions with response categories used in the standardized consumer questionnaire. Question number and code
Question wording and response categories
Q2 (FS.F)
How do you expect the financial position of your household to change over the next 12 months? It will... 1.0 “get a lot better”; 2.0 “get a little better”; 3.0 “stay the same”; 4.0 “get a little worse”; 5.0 “get a lot worse”; −99 “don’t know”
Q4 (GES.F)
How do you expect the general economic situation in this country to develop over the next 12 months? It will... 1.0 “get a lot better”; 2.0 “get a little better”; 3.0 “stay the same”; 4.0 “get a little worse”; 5.0 “get a lot worse”; −99 “don’t know”
Q7 (UNEMP.F)
How do you expect the number of people unemployed in this country to change over the next 12 months? The number will... 1.0 “increase sharply”; 2.0 “increase slightly”; 3.0 “remain the same”; 4.0 “fall slightly”; 5.0 “fall sharply”; −99 “don’t know”
Q9 (MP.F)
Compared to the past 12 months, do you expect to spend more or less money on major purchases (furniture, electrical/electronic devices, etc.) over the next 12 months? I will spend… 1.0 “much more”; 2.0 “a little more”; 3.0 “about the same”; 4.0 “a little less”; 5.0 “much less”; −99 “don’t know”
Q11 (SAV.F)
Over the next 12 months, how likely is it that you save any money? 1.0 “very likely”; 2.0 “fairly likely”; 3.0 “not likely”; 4.0 “not at all likely”; −99 “don’t know”
Q12 (FIN.S)
Which of these statements best describes the current financial situation of your household? 1.0 “we are saving a lot”; 2.0 “we are saving a little”; 3.0 “we are just managing to make ends meet on our income”; 4.0 “we have to draw on our savings”; 5.0 “we are running into debt”; −99 “don’t know”


![consumer confidence - Nielsen [PDF]](https://m.moam.info/img/260x300/consumer-confidence-nielsen-pdf_647dcac3098a9e791c8b45e1.jpg)