the content distribution applications, where nodes are sub- scribers to content .... We can define contact-based metrics at the network or at the node level.
Contact-Based Mobility Metrics for Delay-Tolerant Ad Hoc Networking Abdelmajid Khelil, Pedro Jos´e Marr´on, Kurt Rothermel Universit¨at Stuttgart, IPVS Department of Ditributed Systems Universit¨atsstr. 38, 70569 Stuttgart, Germany Tel: (+49)711-7816-{251, 223, 434} Fax: (+49)711-7816-424 {khelil, marron, rothermel}@informatik.uni-stuttgart.de Abstract Mobility plays a major role in mobile ad hoc networks (MANETs) since it stresses networking tasks such as routing on one hand but aids to increase the network capacity and to overcome network partitioning on the other hand. To benefit from node mobility, a new class of MANET protocols and applications are designed to be delay-tolerant and mobility-aided. For delay-tolerant mobility-aided networking mobility on a large time-scale is a key feature. So far, in MANETs, the mobility is investigated on a short time-scale. That is why we present novel mobility metrics that quantify a large time-scale mobility. Our approach is based on the pair-wise contacts between mobile nodes. We present a detailed statistical study of our novel metrics using the widely used random waypoint mobility model as an example. For the random waypoint model we introduce an analytical model, which allows protocol developers to analytically compute some of the designed metrics. In order to provide an easy access to these metrics in a network simulator, we provide a framework for ns-2.
1 Introduction The number of mobile devices equipped with wireless network interfaces is continuously increasing. Many existing wireless technologies such as WLAN and Bluetooth provide besides an infrastructure-based communication mode an ad hoc communication mode. The ad hoc mode allows mobile devices to directly communicate if they enter each other’s communication range. If nodes can act as routers, multihop communication between nodes is possible. The so formed networks are refered to as mobile ad hoc networks (MANETs). MANETs are suitable for scenarios where an infrastructure is costly or even unavailable.
Mobility of network nodes stresses protocols and applications by disrupting routes, changing propagation effects and causing network partitioning. However, it can also be exploited to increase network capacity and to overcome network partitioning. In [13] the authors showed that the per node throughput in a multihop network drops to zero in the limit of large number of nodes. In [10] the authors showed however that the per node throughput of a mobile infostation network is O(1), independent from the number of nodes. This capacity is achieved through a two hops relay strategy. The order of magnitude improvement in network capacity comes at the cost of the unpredictable end-toend transmission delay. Furthermore, partition-aware protocols, such as hypergossiping [18], epidemic routing [27] and negotiation-based diffusion protocol [14], exploit mobility to overcome network partitioning. To profit from these mobility benifits, a new challenging class of mobility-aided applications and protocols have been recently developped. These protocols and applications tolerate higher communication delays. They are grouped under the delay-tolerant networking research field (see the Delay Tolerant Networking Research Group (DTNG) [12] [21] [8] [6] [7]). The communication in delay-tolerant networking architecture basically relies on asynchronous, store-andforward message delivery. This kind of communication does not assume a contemporaneous end-to-end connectivity; (some) mobile nodes have to physically transport data from source to destinations. We distinguish the following two classes of delaytolerant mobility-aided applications. The first class are the content distribution applications, where nodes are subscribers to content providers. The application typically runs in the background for a few hours or even a few days. Examples of this class are usenet-on-the-fly [2], latency insensitive data [16], delay-tolerant content distribution in mobile infostation networks [29], [30], [31] and Data MULEs [23]. The second class are biological information aquisition
and habit monitoring of wildlife species. To this class we count the Electronic Shepherd system [26], Whales [24], ZebraNet [17], and the Sami Network Connectivity project [19]. The underlying protocols should exploit the delaytolerance of the applications in order to increase the capacity of the network or to overcome network partitioning. They have to match the properties of the MANET, such as node spatial distribution and mobility, to the tolerated delay. Because node mobility plays an important role in realizing mobility-aided systems, there is a strong need for mobility metrics that simplify the design and the adaptation of delay-tolerant ad hoc protocols and applications. These metrics have to quantify the mobility of nodes on a large time scale, i.e. for time periods in the range of minutes, hours, or even days. Consider a campus scenario consisting of students and staff members. One can easily observe the variety of mouvement pattern of both groups on a large time scale, e.g. one working day. Students frequently roam between different departments, faculties, libraries, and cafeterias. Staff members however show a much lower move-to-pause ratio than students and intensively interact locally with neighbouring staff members and sometimes with visting students. To detect such large time scale mobility patterns, we have to investigate the mixture of mobile nodes, i.e. the relative mobility of nodes on a large time scale. For this, we rely on the pair-wise contacts of mobile nodes to define mobility metrics that quantify the mixture level of mobile nodes. Although there is advanced research in modeling realistic mouvement patterns, e.g. [25], there is still a strong need for mobility metrics. Existing mobility metrics are designed for non-delay-tolerant ad hoc routing protocols. These metrics model the mobility instantaneously and do not quantify it on a large time scale. The main contribution of this paper is the definition of novel contact-based mobility metrics that help network protocol developers to easily evaluate their delay-tolerant protocols or to adapt them to the node mobility. As an example, we perform investigation for the random waypoint model, which is the mostly used mobility model for MANETs. However, our metrics are applicable to any other mobility model. The remainder of this paper is structured as follows. In the next section, we define our system model and some impotant terms. In Section 3, we review the related work. We define our novel contact-based mobility metrics in Section 4. In Section 5, we present a detailed statistical analysis of the contact-based mobility metrics and some preliminary analytical results. In Section 6, we show how ns-2 users can easily access the contact-based mobility metrics and use them to evaluate their delay-tolerant protocols. The Section 7 concludes the paper and outlines our future work.
2 Preliminaries Let us now define our system model and our terminology.
2.1 System Model We consider a MANET composed of N mobile nodes populating a geographic square flat area A. Nodes move according to an arbitrary mobility model. We assume in this work that the nodes’ movement is restricted within A (closed population). We assume that nodes are uniquely identified, e.g. using the MAC addresses. Without lost of generality we uniquely identify the N nodes through enumerating them from 0 to N − 1. We assume that all nodes have the same communication range R and can communicate only if their sight distance is below R. The resulting topological graph of the MANET is therefore an undirected graph G(V, E). When the MANET is partitioned, the topological graph is also partitioned.
2.2 Terminology • Population: We define a node population as the set of all nodes forming the MANET over the time of interest T . A population is said to be closed if it does not change over T . It is said to be open if it changes over T . As we stated before, we consider only closed populations. • Link: A link is an edge in the topological graph of the MANET. A link between two nodes is considered to be established when the nodes come within each others communication range, and is considered to be broken when their distance exceeds the communication range. • Encounter: We say that two nodes encounter each other when the distance inbetween becomes smaller than the communication range R. The encounter is said to be lost, if the nodes leave the communication range of each other. We represent an encounter by the two nodes, its time of incidence and its duration. We denote by e nm an encounter of node n with node m. We define enm as follows: enm = {n, m, t, �t}
(1)
with t the time of incidence of the encounter and �t the duration of the encounter. • Contact: We define a contact between two nodes as the list of all encounters between them. A contact between two nodes begins with the first encounter between them, and ends with the last one. A contact is
considered as lost if there is no encounter between both nodes. We denote by c nm the contact of node n with node m. We represent c nm as a set of enm : cnm = {enm }
(2)
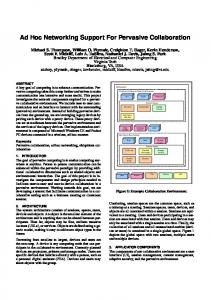
We assume that each node manages its contacts in a so-called contact table. An example of such contact tables is shown in Fig. 1. The contact of node 1 with node 6 until time t consists of two encounters: c 1,6 = {{1, 6, 7.5, 7.5}, {1, 6, 22.5, 12.5}}.
14 {32.5, 5} 5 Node-ID
{25, 12.5} 13 {22.5, 7.5}
{10, 7.5} 6 {7.5, 7.5}
time
duration
{0, 20} 0
10
20
30
In [28] authors use contacts to discover resources in partitioned networks. They assume that nodes know each other’s trajectory and define the so-called contact graph in order to predict future encounters of the mobile nodes. In [5, 11] the authors use the so-called last encounter age or the time elapsed since last encounter to efficiently route unicast messages to destinations. To this end nodes maintain a histroy of the closest last encounters. If the source wants to send a message to the destination, it forwards the message to the neighbor that encountered the destination more recently than the source and other neighbors. The rational behind their approach is that “a node that was my neighbor 5 seconds ago is probably closer to me than a node that was my neighbour 5 minutes ago”. This work shows the utility of encounter history or contacts even for non-delaytolerant networking. Unfortunately the above projects do not define mobility metrics.
4 Contact-Based Mobility Metrics
{22.5, 12.5}
9
3.2 Related Projects
t
In this section we reflect on the various aspects of contacts that could be helpful for delay-tolerant ad hoc networking.
time (sec)
4.1 Methodology Figure 1: Contact table of node 1 at time t
3 Related Work In this section, we revise the existing mobility metrics and investigate current research work that uses contacts.
3.1 Existing Mobility Metrics We classify existing metrics into three classes: First, velocity-based metrics, such as average speed and average relative speed between all nodes; Second, link-based metrics, such as link change rate [4] and link duration [9, 22]; and Third route-based metrics, such as route change rate [15], route duration [22] and average path availability [22]. These metrics are mainly designed for non-delaytolerant MANET routing protocols, where route information become faster stale with higher mobility [4]. Unfortunately, these metrics are not suitable to quantify the mixture of nodes of the MANET, since they do not explicitely consider the identity of nodes.
In epidemiology, contacts are important for the analysis and prediction of the spreading of infectious diseases. Contacts have there a great impact on the quarantine and vaccination decisions. We are convinced that contacts are useful for the analysis of the performance of delay-tolerant ad hoc applications and of the underlying delay-tolerant protocols. Furthermore contact information can help adapting these applications and protocols to the mobility of nodes. In the following we list some information that we think is very helpful for delay-tolerant mobility-aided networking. • How many new contacts does a node acquire per unit of time? • How frequent does a node encounter the same node? • How long does an encounter remain established? Or how long does a contact remain lost? This information quantifies the contact process between nodes on a large time scale, which makes the information interesting for delay-tolerant ad hoc applications and protocols that act on a large time scale. For delay-tolerant routing protocols we can select as carrier/relay node the node with the highest probability to next
encounter the destination. This decision may increase the probability to deliver the message and decrease the delivery delay. For delay-tolerant broadcasting protocols we can select nodes that contact the most nodes or that provide a larger encounter rate to buffer more broadcast messages to rebroadcast them later, e.g. on partition join. This may increase the number of reached nodes, decrease delivery delay and decrease the overall buffer overhead. For delay-tolerant content distribution applications, nodes that contact more frequent other nodes have to play the role of the content providers (publishers) more intensively. We can define contact-based metrics at the network or at the node level. At the network level, this information helps to understand the mixture of the population. If the information is node-centric it describes the relative mobility of that node to the other nodes. Network-wide metrics describe the contact process on a macroscopic view, i.e. how the population is mixed. Network-wide metrics are difficult to acquire at run-time. They are appropriate to simplify the evaluation of MANET protocols and applications, but not to their online adaptation.
4.2 Definition of Metrics We now define contact-based mobility (cbm) metrics by first defining them at the node level (node-centric) and then by making the average over all nodes (network-wide). We denote by Cn the set of contacts of node n within T (our observation period): Cn = {cnm }
• Contact Rate: We denote by ACRn the number of new contacts experienced by node n per unit of time (e.g. 3 contacts/min). We define ACRn as follows: |Cn | (5a) T Therefore, the network-wide Average Contact Rate (ACR) is the average of ACR n over all N nodes: ACRn =
(5b)
• Encounter Frequency: We denote by AEFn the number of encounters experienced by node n within T divided by the number of contacts experienced by node n within T .
N −1 1 � ∗ AEFn N n=0
AEF =
(6b)
• Encounter Rate: We denote by AERn the number of new encounters experienced by node n per unit of time (e.g. 9 encounters/min). We compute AER n as follows: |En | (7a) T We define the Average Encounter Rate (AER) as the average number of new encounters experienced by a node per unit of time. Therefore ACR is given by the average of ACR n over all N nodes: AERn =
N −1 1 � ∗ AERn N n=0
AER =
(7b)
• Contact Duration: We define the Average Contact Duration of node n over all contacted nodes by:
(3)
We denote by En the set of all encounters experienced by node n within T : (4) En = {enm }
N −1 1 � ACR = ∗ ACRn N n=0
|En | (6a) |Cn | We define the Average Encounter Frequency (AEF ) as the Average number of encounters per contact. Therefore AEF is given by the average of AEF n over all N nodes: AEFn =
�
enm .�t (8a) |Cn | Therefore the Average Contact Duration (ACD) in the network is the average of ACD n over oll nodes: enm ∈En
ACDn =
ACD =
N −1 1 � ∗ ACDn N n=0
(8b)
• Contact Loss Duration: We define ACLDn as the average contact loss duration of node n over all nodes it has contacted during T. � ACLDn = T −
enm .�t = T −ACDn |Cn |
enm ∈En
(9a)
The network-wide Average Contact Loss Duration (ACLD) is therefore the average of over oll nodes: ACLD =
N −1 1 � ∗ ACLDn = T − ACD N n=0
(9b)
• Encounter Duration: � AEDn =
enm .�t |En |
enm ∈En
(10a)
We define the network-wide Average Encounter Duration AED as the average of AED n over all nodes: N −1 1 � ∗ AED = AEDn N n=0
(10b)
We notice here that some contact-based metrics are identic to the existing link-based metrics. For example the Average Encounter Duration is equivalent to the Average Link Duration [22], which has been already investigated in [9,22] and therefore will not be considered in details here. We only present the results that we need for investigating the contact-based metrics.
Table 1: Simulation parameters Parameters Value(s) Simulation area 1000m x 1000m Number of nodes N ∈ {30, 50, 100, 200, 300} Com. range R = 100m Movement pattern Random Waypoint - Max speed - vmax ∈ {3, 10, 20, 30}m/s - Pause - uniform betw. 0 and 2s Statistical time T = 1800s The purpose of examining the detailed statistics of cbm metrics was to gain a deeper understanding of the mobility of nodes on a large time scale, so we arbitrarily set the statistical time T to 1800 s (30 min). For the same simulation scenario we ran 10 passes with 10 different movement traces and considered the average.
5.2 Statistical Analysis
5 Simulation and Analysis Having defined the metrics, we now focus our attention on obtaining the detailed statistics of the metrics for the widely used random waypoint model.
Because of space restrictions, we present only some statistical results for the random waypoint as an example of mobility models. We especially investigate the impact of node density and node mobility on the cbm metrics.
5.1 Simulation Model
5.2.1 Contact Rate
In the following, we introduce our approach and simulation settings we used to investigate the cbm metrics.
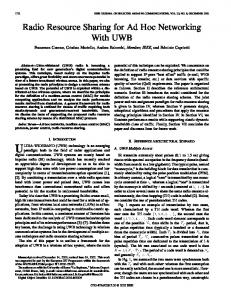
In this section, we discuss the impact of node density and mobility on the ACR. Fig. 2 shows for different max speeds the Average Contact Rate (ACR) versus node density.
5.1.1 Measuring the Contact-Based Metrics T = 1800 s , comm. range = 100m
5.1.2 Simulation Settings We generate N mobile nodes in a 1000mx1000m field, where these nodes move according to the random waypoint mobility model. Table 1 summarizes the simulation parameters of our experiments.
10 3m/s 10m/s 20m/s 30m/s
9 8
ACR (contacts/min)
For the purpose of measuring the metrics defined in Section 4 at the connectivity graph level, we developed a mobility trace analyzer program CBM. Given a mobility trace file, this program calculates the contact table for each mobile node based on its location information. Based on the contact tables the metrics are calculated like shown in Section 4. CBM expects the mobility trace format of the network simulator ns-2 [20]. Our study is based on average values as well as the pdfs of the metrics. The pdfs are estimated using simple statistical analysis of the simulation data. The simulation settings for estimating the probability density functions (pdf) are discussed in the next section.
7 6 5 4 3 2 1 0 0
50
100
150
200
250
300
number of nodes
Figure 2: Average contact rate (ACR)
We can easily conclude that the ACR increases linearly with the node density. This is due to that with increasing node density nodes tend to encounter more nodes it has never encountered before. Linearity is given due to the almost uniform distribution of nodes for the random waypoint
mobility model [3]. Also the ACR increases with the max speed. Faster node are more likely to encounter more nodes at the same time. But the ACR saturates if the max speed is very high, since the number of new contacts is limited by the number of nodes N .
empirical Cumulative Density Function (cdf emp ) is represented in a value D. The lower the value D is, the better the Weibul distribution fits the empirical distribution.
5.2.2 Encounter Frequency We first discuss the Average Encounter Frequency AEF versus the node density and depending on the node max speed for a time period of T = 1800s. Fig. 3 shows that the AEF is independent from node density and increases with the node max speed. T = 1800 s , comm. range = 100m 5 3m/s 10m/s 20m/s 30m/s
4.5
4
AEF
3.5
3
2.5
(a) T = 1800 s 2
1.5
1 0
50
100
150
200
250
300
number of nodes
Figure 3: Average Encounter Frequency (AEF )
We now discuss the encounter frequency pdfs and follow it up with a discussion of the relationship between ACR, AEF and AER. Fig. 4 shows two encounter frequency pdfs for the same scenario configuration (50 nodes and 30 m/s) but for different T values. Because the exponential distribution is a special case of the Weibul distribution for some parameter combinations, the encounter frequency pdf for the random waypoint model seems to be Weibul distributed. Thus, from our analysis, we observe that then the encounter frequency can be approximated by a Weibul distribution. To prove this hypothesis, we have to try to fit the Weibul density function
(b) T = 3600 s
(11)
Figure 4: pdf of encounter frequency for 50 nodes and 30m/s
to the empirical distribution. Therefore, we used the Maximum-Likelihood method. Having found the optimal parameters, the quality of fitting to the empirical data has to be evaluated. For the Goodness-of-Fit test we selected the Kolmogorov-Smirnov (K-S) test, because it does not depend on the number of samples. The distance between the theoretical Cumultive Density Function (cdf theo ) and the
We performed this statistical analysis with the open source statistical tool R [1]. The results of fitting are given in Table 2. While we have only reproduced the distribution for N = 50 nodes and max speed of 30 m/s, further simulations show that the above conclusion holds for further node densities and max speeds.
x α x α f (x) = ∗ ( )α−1 ∗ e−( β ) , x ≥ 0 β β
T = 1800 s , comm. range = 100m
Table 2: Fitting results α β KS-test distance 1.98 5.23 D = 0.0835 2.19 9.09 D = 0.0784
100 90 80
T = 1800 s , comm. range = 100m 50
AER (encounters/min)
70 60 50
3m/s 10m/s 20m/s 30m/s
45
3m/s 10m/s 20m/s 30m/s
110
AED (sec)
T = 1800s T = 3600s
120
40
40
30
35
20 10
30
0
50
100
150
200
250
300
number of nodes 25 20
Figure 7: Average Encounter (Link) Duration (AED)
15 10 5 0 0
50
100
150
200
250
300
ACD ∼ = AED ∗ AEF
number of nodes
Figure 5: Average Encounter Rate (AER)
We do not present the results for the contact loss duration, since it is easy to compute this metric given T and ACD: ACLD = T − ACD.
Fig. 5 shows the Average Encounter Rate (AER) versus the node density and depending on the node max speed. From Fig. 2,3,5 we can easily conclude that: AER ∼ = ACR ∗ AEF
(12)
5.2.3 Contact Duration and Contact Loss Duration Fig. 6 shows that the ACD is almost independent from node density and that ACD decreases with increasing max speed. T = 1800 s , comm. range = 100m 150 3m/s 10m/s 20m/s 30m/s
140
(13)
5.2.4 Conclusions From the statistical analysis above, we can learn some useful lessons about the contact-based mobility metrics. The AEF seems to play a central role for these metrics, since it relates some cbm metrics with each other. A deep analysis of the distribution of Encounter Frequency shows that this distribution can be approximated with a Weibul distribution. The investigation of the impact of node max speed and node density on cbm metrics shows a clear regularity. The AEF , AED and ACD are independent from node density; The AER and ACR increase linearly with node density.
5.3 Theoretical Analysis
130
ACD (sec)
120
110
100
90
80
70 0
50
100
150
200
250
300
number of nodes
Figure 6: Average Contact Duration (ACD)
From Fig. 7 we conclude that the Average Encounter Duration (AED) shows a similar behaviour with varying node density and mobility. From Fig. 3,6,7 we can easily conclude a relation between ACD and AED:
In this section, we introduce our analytical model and analytically compute the Average Encounter Rate for the random waypoint mobility model. We rely here on the theory of atom kinetics. If nodes have a transmission range of R, then the effective cross-section for encounter can be modeled by using a circle of radius R to represent a node’s effective encounter area while treating the ”target” nodes as points. The effective Encounter Area of a given node is π ∗ R 2 . At time t, the circle would sweep out the area F shown and the number of encounters can be estimated from the number of nodes that were in that area (Fig. 8). F = (2 ∗ R)v ∗ t
6 Use of cbm Metrics Node A
Node A
R
In this section, we present our framework that helps the ns-2 users to easily generate and use cbm metrics. Then, we show, using the example of information dissemination, the relevance of cbm metrics. x=v.t
6.1 Providing cbm Metrics for ns-2 Users
Area, where node A encounters other nodes while moving New Nodes encountered by node A while moving
Figure 8: F : The potential area for encounters for node A
where v is the mean speed of each node. For random waypoint v = (vmax − vmin)/2 = vmax/2. Then F = (2 ∗ R) ∗ vmax/2 ∗ t = R ∗ vmax ∗ t. Assuming a uniform node spatial distribution, the number of encountered nodes at time t is
For ns-2 we provide a tool, CBM, that annotates a given mobility scenario (in ns-2 format) with cbm information such as the contact table of nodes and some network-wide metrics. Then the General Operations Director (GOD) of ns-2 can load this information from the annotated file and provide it to the ns-2 protocol and application developers. This approach is similar to that of generating GOD information for MANET routing protocol developers. Fig. 10 illustrates our approach. Ns-2 mvmt trace file
#encounters = F ∗ d
mvmt info
offline
#encounters/t = R ∗ vmax ∗ d
Simulation begin
CBM (Annotates cbm information)
where d is the node density, i.e. number of nodes per unit of area. Finally, the number of encountered nodes per unit of time is
Fig. 9 shows the Encounter Rate according to Equation (14) for different node densities and depending on node max speed. From Fig. 9 one can easily see that the analytical results are very comparable with the simulation results, which indicates that our analytical model is suitable for further analytical studies, for example to compute the Average Encounter Frequency and the Average Contact Rate.
cbm info NS-2 GOD instance Interface
During simulation
(14)
Mvmt file with cbm information
Use cbm information DTN protocols and applications
Figure 10: Preparation and use of cbm metrics
comm. range=100m 60
50
AER (encounters/min)
The tool CBM is able to annotate already existing ns-2 mvmt trace files, independently from the mobility model and from the generation tool. The annotation is a set of OTCL commands for ns-2. The annotation is done offline, in order to increase reusability of trace files and to reduce simulation run time. One disadvantage of the offline generation is that cbm information is dependent on the fixed communication range. We extend the GOD object with procedures to query network-wide as well as node-centric cbm metrics.
3 m/s - analysis 3 m/s - simulation 10 m/s - analysis 10 m/s - simulation 20 m/s - analysis 20 m/s - simulation 30 m/s - analysis 30 m/s - simulation
40
30
20
10
0 0
50
100
150 200 node density d (node/km^2)
250
300
6.2 Accessing cbm Metrics Figure 9: Average Encounter Rate (AER) In real world scenarios nodes have to acquire cbm information by managing local contact tables. Encounters
are perceived using a simple neighbor discovering protocol such as hello beaconing. Contact-based metrics may be used at design-time to evaluate delay-tolerant protocols and applications, but also at run-time to adapt these protocols and applications. In [4] the authors mentioned the requirements on mobility metrics for adaptation of protocols. Network-wide metrics are metrics that are not easy to compute at run-time, since they need a high communication overhead. Network-wide metrics are appropriate at the design stage and should be used by developers to well design their protocols for a wide range of mobilities. Node-centric metrics are easy to acquire at run-time. Nodes have to manage a history of their encounters, e.g. by using hello beaconing. These metrics can be then used to adapt protocols and application on-the-fly. Note that, since hello beacons are not assumed to be synhronized among nodes, if node A encounters node B, node B does not necessarily encounter node A at the same time. Furthermore the maintained history should keep the memory requirements low.
6.3 Practical Relevance of cbm Metrics Now we show the relevance of cbm metrics, using the example of information dissemination in a campus scenario. We consider the MANET formed by mobile devices carried by students and staff members on a campus during working hours. First, we qualitatively analyse the properties of the mobility of nodes on a large time scale using our cbm metrics. Secondly, we show the usefulness of these metrics for delay-tolerant information dissemination in the considered MANET. Staff members are generally grouped in departments, which in their turn are grouped in faculties. Offices for one department or one faculty are normally grouped geographically. Staff members work most of time in their offices, and sometimes meet each other. From these observations, we can conclude that mobile devices carried by staff members form a relative stable network topology. Thus they show low encounter and contact rates but high encounter and contact durations. Students commute frequently between departments, faculties, classrooms, libraries and cafeterias. Therefore, their encounter and contact rates are higher, but their contact and encounter durations are lower than that of staff members. Table 3 shows a qualitative analysis of the cbm metrics for both groups. Using Hypergossiping [18] we now aim at disseminating a message from a source node, e.g. the mobile device of a staff member, to all MANET nodes on the campus. Using probabilistic flooding (gossiping [18]) the source node may reach all nodes in the partition containing this source
Table 3: Campus scenario staff students encounter rate low high contact rate low high encounter frequency ≈1 ≈1 encounter duration high low contact duration high low node. The dissemination stops in case of network partitioning. To overcome this partitioning hypergossiping lets nodes buffer messages in order to rebroadcast them on partition joins. Currently hypergossiping lets every node buffer every received message during its lifetime [18]. This strategy however shows a high buffer overhead, which we could reduce using the cbm mobility metrics. We suggest following simple heuristic to reach this goal. Students and not staff members have to buffer messages, since students commute more probably between different network partitions. Therefore students are more suitable as a transport mechanism between partitions. From Table 3 hypergossiping can easily approximate, if a node is suitable for buffering the message. Nodes with higher contact rate should be chosen.
7 Conclusion and Future Work We have proposed a set of novel mobility metrics for deeper understanding of the mobility on a large time-scale. Following the epidemiology our metrics are contact-based, since they quantify the spatial encouters between nodes. We examined the detailed statistics of the defined metrics for the popular random waypoint mobility model. We proposed a simple analytical model that shows very comparable results to the simulation results. For ns-2 users we provide the needed support 1 to easily use our novel metrics. We are convinced that our novel mobility metrics will help developers designing and adapting delay-tolerant ad hoc protocols and applications. We are looking at using these metrics to adapt the buffering strategy of our delaytolerant broadcast protocol hypergossiping [18] to the node mobility. In future work we want also to investigate the contact-based mobility metrics for other mobility models. We also aim at considering open populations, i.e. scenarios where nodes may leave or join the considered population of mobile nodes.
Acknowledgment We thank Foued Krichene for initial discussions on the problem. We are also very grateful to Illya Stepanov for his helpful comments. 1 http://canu.informatik.uni-stuttgart.de/cbm
References [1] Center for computational intelligence of the tu wien. The R project for statistical computing, April 2005. [2] C. Becker, M. Bauer, and J. H¨ahner. Usenet-on-the-fly: supporting locality of information in spontaneous networking environments. In Proceedings of CSCW 2002 Workshop on Ad hoc Communications and Collaboration in Ubiquitous Computing Environments, 2002. [3] C. Bettstetter and C. Wagner. The spatial node distribution of the random waypoint mobility model. In Proc. of the 1st German Workshop on Mobile Ad-Hoc Networks (WMAN’02), March 2002. [4] J. Boleng, W. Navidi, , and T. Camp. Metrics to enable adaptive protocols for mobile ad hoc networks. In Proceedings of the International Conference on Wireless Networks (ICWN ’02), pages 293–298, 2002. [5] H. Dubois-Ferriere, M. Grossglauser, and M. Vetterli. Age matters: Efficient route discovery in mobile ad hoc networks using encounter ages. In Proc. MobiHoc 2003, pages 257– 266, June 2003. [6] V. C. et al. Delay-tolerant network architecture. In Internet draft, draft-irtf-dtnrg-arch-02.txt, March 2003. [7] V. C. et. al. Delay tolerant network architecture. In draftirtf-dtnrg-arch-02.txt, July 2004. [8] K. Fall. A delay-tolerant network architecture for challenged internets. In Proc. of SIGCOMM’03, September 2003. [9] M. Gerharz, C. de Waal, M. Frank, and P. Martini. Link stability in mobile wireless ad hoc networks. In In Prodeecings of the 27th Annual IEEE Conference on Local Computer Networks (LCN’02), pages 30–39, November 2002. [10] M. Grossglauser and D. Tse. Mobility increases the capacity of ad hoc wireless networks. volume 10, pages 388–404, August 2002. [11] M. Grossglauser and M. Vetterli. Locating nodes with ease: Last encounter routing in ad hoc networks through mobility diffusion. In IEEE INFOCOM. 2003, 2003. [12] T. D. T. N. R. Group. dtnrg. [13] P. Gupta and P. R. Kumar. The capacity of wireless networks. volume IT-46, pages 388–404, March 2000. [14] J. H¨ahner, C. Becker, and K. Rothermel. A protocol for data dissemination in frequently partitioned ad-hoc networks. In Proceedings of the IEEE International Symposium on Computers and Communications (ISCC), 2003. [15] Y.-C. Hu and D. B. Johnson. Caching strategies in ondemand routing protocols for wireless ad hoc networks. In Proc. of the ACM/IEEE Mobicom, pages 231–242, 2000. [16] A. G. E. d. L. Jing Su, Alvin Chin. User mobility for opportunistic ad-hoc networking. In Proc. of the 6th IEEE Workshop on Mobile Computing Systems and Applications, 2004. [17] P. Juang, H. Oki, Y. Wang, M. Martonosi, L.-S. Peh, and D. Rubenstein. Energy-efficient computing for wildlife tracking: Design tradeoffs and early experiences with zebranet. In Proc. of the 10th Int. Conf. on Architectural Support for Programming Languages and Operating Sytems (ASPLOS), 2002. [18] A. Khelil, P. J. Marr´on, C. Becker, and K. Rothermel. Hypergossiping: A generalized broadcast strategy for mobile ad hoc networks. In Proceedings of The 2005 Conference
[19]
[20] [21] [22]
[23]
[24]
[25]
[26]
[27]
[28]
[29]
[30]
[31]
on Communication in Distributed Systems (KiVS), February 2005. A. Lindgren, A. Doria, and O. Schel´en. Poster: Probabilistic routing in intermittently connected networks. In Proceedings of The Fourth ACM International Symposium on Mobile Ad Hoc Networking and Computing (MobiHoc 2003), June 2003. S. McCanne and S. Floyd. Ns network simulator. R. P. S. Jain, K. Fall. Routing in a delay tolerant networking. In Proc. of SIGCOMM’04, Aug/Sep 2004. N. Sadagopan, F. Bai, B. Krishnamachari, and A. Helmy. Paths: Analysis of path duration distributions in manet and their impact on routing protocols. In Proceedings of ACM MobiHoc 2003, pages 245–256, June 2003. R. C. Shah, S. Roy, S. Jain, and W. Brunette. Data mules: Modeling a three-tier architecture for sparse sensor networks. In IEEE SNPA, May 2003. T. Small and Z. Haas. The shared wireless infostation model - a new ad hoc networking paradigm (or where there is a whale, there is a way). In Proceedings of the ACM MobiHoc 2003 conference, June 2003. I. Stepanov, J. H¨ahner, C. Becker, J. Tian, , and K. Rothermel. A meta-model and framework for user mobility in mobile networks. In proceedings of 11th IEEE International Conference on Networks 2003 (ICON 2003), October 2003. B. Thorstensen, T. Syversen, T. Walseth, and T.-A. Bjornvold. Electronic shepherd - a low-cost, low-bandwidth, wireless network system. In Proc. mobisys04, 2004. A. Vahdat and D. Becker. Epidemic routing for partiallyconnected ad hoc networks. Technical report, 2000. Duke University. O. Wolfson, A. Ouksel, and B. Xu. Resource discovery in disconnected mobile ad-hoc networks. In Proc. of the international Workshop on Next Generation Geospatial Information, 2003. W. H. Yuen, R. D. Yates, and S.-C. Mau. Exploiting data diversity and multiuser diversity in noncooperative mobile infostation networks. In Proceedings of Infocom, March 2003. W. H. Yuen, R. D. Yates, and S.-C. Mau. Noncooperative content distribution in mobile infostation networks. In Proceedings of WCNC, March 2003. W. H. Yuen, R. D. Yates, and C. W. Sung. Effect of node mobility on highway mobile infostation networks. In Proceedings of MSWIM, 2003.