Most adaptive delivery mechanisms for streaming multimedia con- ... Loss-Delay Adaptation (LDA) algorithm using a content-based dynamic OAT. Some.
Content-Based Adaptation of Streamed Multimedia Nikki Cranley1, Liam Murphy1, Philip Perry2 1
Department of Computer Science, University College Dublin, Belfield, Dublin 4, Ireland 2
{Nicola.Cranley, Liam.Murphy}@UCD.ie School of Electronic Engineering, Dublin City University, Glasnevin, Dublin 9, Ireland PerryP@eeng. DCU.ie
Abstract. Most adaptive delivery mechanisms for streaming multimedia content do not explicitly consider user-perceived quality when making adaptations. We show that an Optimal Adaptation Trajectory (OAT) through the set of possible encodings exists, and that it indicates how to adapt encoding quality in response to changes in network conditions in order to maximize user-perceived quality. The OAT is related to the characteristics of the content, in terms of spatial and temporal complexity. We describe an objective method to automatically determine the OAT in response to the time-varying characteristics of the content. The OAT can be used with any transmission adaptation policy. We demonstrate content-based adaptation using the OAT in a practical system, and show how this form of adaptation can result in differing adaptation behaviour.
1 Introduction Best-effort IP networks, particularly wireless networks, are unreliable and unpredictable. There can be many factors that affect the quality of a transmission, such as delay, jitter and loss. Adaptation techniques should attempt to reduce network congestion and packet loss by matching the rate of the video stream to the available network bandwidth. Without adaptation, any data transmitted exceeding the available bandwidth could be discarded, lost or corrupted in the network. This has a devastating effect on the playout quality of the received stream. A slightly degraded quality but uncorrupted video stream is less irritating to the user than a corrupted stream. In general, adaptation policies (whether sender-based [1], receiver-based [2],[3], or encoder-based are [4]) address the problem of how to adapt only in terms of adjusting the transmission rate or the window size and are thus bitrate centric. Other adaptation approaches include utility-based schemes [5],[6], which adapt video quality encoding configurations by using a utility function (UF). However, rapidly fluctuating quality should also be avoided as the human vision system (HVS) adapts to a specific quality after a few seconds and it becomes annoying if the viewer has to adjust to a varying quality over
short time scales [7]. Controlled video quality adaptation is needed to reduce the negative effects of congestion on the stream whilst providing the highest possible level of service and perceived quality. In previous work we proposed that there is an optimal way in which multimedia transmissions should be adapted in response to network conditions to maximize the user-perceived quality. Extensive subjective testing demonstrated the existence of an Optimum Adaptation Trajectory (OAT) in the space of possible encodings and that it is related to the content type [8]. However, due to the time-varying nature of content characteristics, there is a need to automatically and dynamically determine the OAT based on these contents characteristics in order to properly apply the OAT. This knowledge can then be used as part of a content-based adaptation strategy, which aims to maximize the user-perceived quality of the delivered multimedia content. This paper is structured as follows. Section 2 describes the concept of an Optimum Adaptation Trajectory (OAT) that exists for each class of video content. Section 3 describes how content can be characterized by its spatial and temporal complexities. Section 4 presents an objective means of determining the OAT that is dynamic and can react to the time varying characteristics of content. Section 5 describes our content-based adaptive streaming system. The system is demonstrated using the existing Loss-Delay Adaptation (LDA) algorithm using a content-based dynamic OAT. Some preliminary simulation results from our system are presented to show system operation and behavior. Conclusions and directions for future work are presented in Section 6.
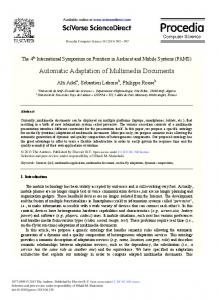
2 Optimum Adaptation Trajectories In previous work, the concept of an Optimum Adaptation Trajectory (OAT) has been presented [8] and has been shown to complement the sender-based Loss-Delay Adaptation algorithm using a static OAT determined by subjective testing, or as the basis of a Perceptual Quality Adaptation (PQA) algorithm [9]. The OAT embodies the idea that there is an optimal way in which multimedia transmissions should be adapted (upgraded/downgraded) in response to network conditions to maximize the user-perceived quality. This is based on the hypothesis that within the set of different ways to achieve a target bit rate, there exists an encoding configuration that maximizes the user-perceived quality. If a particular multimedia file has n independent encoding configurations then, there exists an adaptation space with n dimensions. Adaptation space consists of all possible dimensions of adaptation for the content that can be implemented as part of an adaptive streaming server or adaptive encoder. When adapting the transmission from some point within that space to meet a new target bit rate, the adaptive server should select the encoding configuration that maximizes the user-perceived quality for that given bit rate. The example shown in Figure 1 indicates that, when degrading the quality from an encoding configuration of 25fps and a spatial resolution of 100%, there are a number of possibilities – such as reducing the frame rate only to 15fps, reducing the spatial resolution only to 70%, or reducing a combination of both the frame rate and resolution. The choice of which encoding configuration that should be adopted is determined as the encoding configura-
tion that maximizes the user-perceived quality. When the transmission is adjusted across its full range, the locus of these selected encoding configurations should yield an OAT within that adaptation space.
Fig. 1. Encoding Quality Options
There is much research into developing objective metrics for video quality assessment [10],[11],[12],[13]. The most commonly used objective metric of video quality assessment is the Peak Signal to Noise Ratio (PSNR), which has been widely used in many applications and adaptation algorithms [14] to assess video quality. The advantage of PSNR is that it is very easy to compute using the Mean Square Error (MSE) of pixel values of luminance for frames from the degraded and reference clips. However, PSNR does not match well to the characteristics of the human vision system (HVS) [15]. However, the main problem with using PSNR values as a quality assessment method is that even though two images may be different, the visibility of this difference is not considered. The PSNR metric does not take into consideration any details of the HVS such as its ability to “mask” errors that are not significant to the human comprehension of the image. Several objective metrics, namely the Video Quality Metrics (VQM) and PSNR were investigated to determine whether they yielded an OAT. The ITU-T has recently accepted the VQM as a recommended objective video quality metric that correlates adequately to human perception in [16], [17], [18]. However, our findings were that these objective metrics produce an OAT which jumped through adaptation space with no sense of direction or continuity. In contrast, subjective methods were consistent across content types and produced a smooth graceful OAT through adaptation space. The OAT is dependent on the characteristics of the content. There is a content space in which all types of video content exist in terms of spatial and temporal complexity (or detail and action). The OAT was discovered through extensive subjective testing for a number of different content types using the forced choice methodology. Subjective testing results showed that the OAT is logarithmic with the general form Resolution = A*Ln(Frame rate) + B
(1)
for some constants A and B. It was also found that the temporal and spatial complexity of the scene plays an important role in the curvature of the OAT. The usefulness of the OAT relies on the contents’ spatial and temporal characteristics being known by the adaptive server. Since the spatial and temporal complexity of content will vary over time, we propose a method to automate the process of determining the OAT in response to these changing content characteristics.
3 Spatial and Temporal Complexity Metrics User perception of video quality varies with the content type; for example, viewers perceive action clips differently from slow moving clips. Thus, there exists a different OAT for different types of content based on their spatial and temporal characteristics. The spatial and temporal complexity of content can be determined using the metrics Spatial Information (SI) and Temporal Information (TI). The Spatial Information parameter, SI, is based on the Sobel filter, and is implemented by convolving two 3 x 3 kernels over the luminance plane in the video frame [19]. Let Conv1n(i, j) be the result of the first convolution for the pixel of the input nth frame at the ith row and jth column and let Conv2n(i, j) be the result of the second convolution for the same pixel. The output of the Sobel filtered pixel at the ith row and jth column in the nth frame, yn(i,j), is the square root of the sum of the squares of both convolutions. The SI value is the standard deviation (stdspace) over all pixels in the nth frame and is computed as follows:
y n (i , j ) =
[Conv1n (i, j )]2 + [Conv 2 n (i, j )]2 SI = std space [ y n ]
(2)
(3)
This process is repeated for each frame in the video sequence and results in a time series of spatial information of the scene. The calculations are performed on a subimage of the video frame to avoid unwanted edge and border effects. The size of the original image is QCIF (176x144 pixels) and so a centrally located sub-image of 100x100 was used. The Temporal Information parameter, TI, is based upon the motion difference feature in successive frames. The motion difference, Mn(i, j), is the difference between the pixel values in the ith row and jth column in nth frame Fn (i, j), and the value for the same pixel in the previous frame, Fn-1 (i, j). The measure of Temporal Information, TI, is the standard deviation over all pixels in the sub-image space (stdspace) and is computed as follows:
M n (i, j ) = Fn (i, j ) − Fn −1 (i, j )
(4)
TI = std space [ M n ]
(5)
Both the SI and TI values result in a time varying measure of the spatial and temporal complexity of a piece of content. This information can be used to create a time varying understanding of the characteristics and requirements of the content to generate the OAT. The calculation of the SI and TI complexity parameters is not computationally expensive for small image sizes such as QCIF.
4 Objective OAT Upon analysis of the OATs discovered by subjective testing, it was observed that the OAT for different content types was not strongly dependent on the precise SI-TI values, but more influenced by the relationship between spatial and temporal complexity. For example, when the SI value was significantly greater than the TI value, the resulting OAT tended towards the spatial resolution, and vice versa. However, for a number of test sequences where the spatial and temporal complexities were approximately equal, the OATs were “neutral”. To represent the relative dominance of one characteristic over another, a weighting factor, W, is introduced which is determined using the SI and TI metrics. The factor W is the relative dominance of temporal complexity over the spatial complexity. Since the scales of spatial complexity and temporal complexity are different, both parameters were converted to their respective fractional values. The fractional SI value is thus the SI value divided by the maximum SI value; similarly, the fractional TI value is the TI value divided by the maximum TI value. The maximum SI and TI values can be found by applying the equations to the luminance plane of an image with alternating black and white pixels.
Fractional _ SI = SI
Fractional _ TI = TI
SI MAX
TI MAX
W = Weighting factor = Fractional _ TI Fractional _ SI
(6)
(7)
(8)
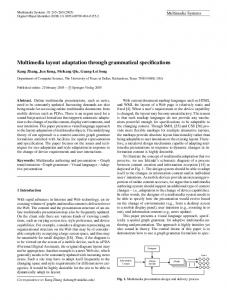
From Figure 2, it can be seen that when SI=TI, the weighting factor, W, is equal to 1, therefore there is no dominant characteristic and the OAT is neutral. If SI>TI, then the weighting factor W1 Temporal Dominant
0.8
W=1 No dominant characteristic
0.6 0.4
W